
SPYX
SP500 tokenized ETF (xStock)
| Trader | Signal Type | Profit Price/Stop Loss Price | Publish Time | View Message |
|---|---|---|---|---|
 DatTongRank: 35 | BUY | Profit Price: ۷٬۰۰۰ Stop Loss Price: ۶٬۷۶۵ | 10/28/2025 | |
 julia17Rank: 116 | SELL | Profit Price: Not specified Stop Loss Price: Not specified | 10/30/2025 | |
 The_STARank: 119 | BUY | Profit Price: Not specified Stop Loss Price: Not specified | 10/29/2025 | |
 JoeChampionRank: 180 | BUY | Profit Price: Not specified Stop Loss Price: Not specified | 10/10/2025 | |
 isahebdadiRank: 779 | BUY | Profit Price: ۷٬۰۰۰ Stop Loss Price: ۶٬۱۴۵ | 10/18/2025 |
Price Chart of SP500 tokenized ETF (xStock)
Profit 3 Months :
Signals of SP500 tokenized ETF (xStock)
Filter
Sort messages by
Message Type
Trader Type
Time Frame

S&P 500 Daily Chart Analysis For Week of Oct 31, 2025
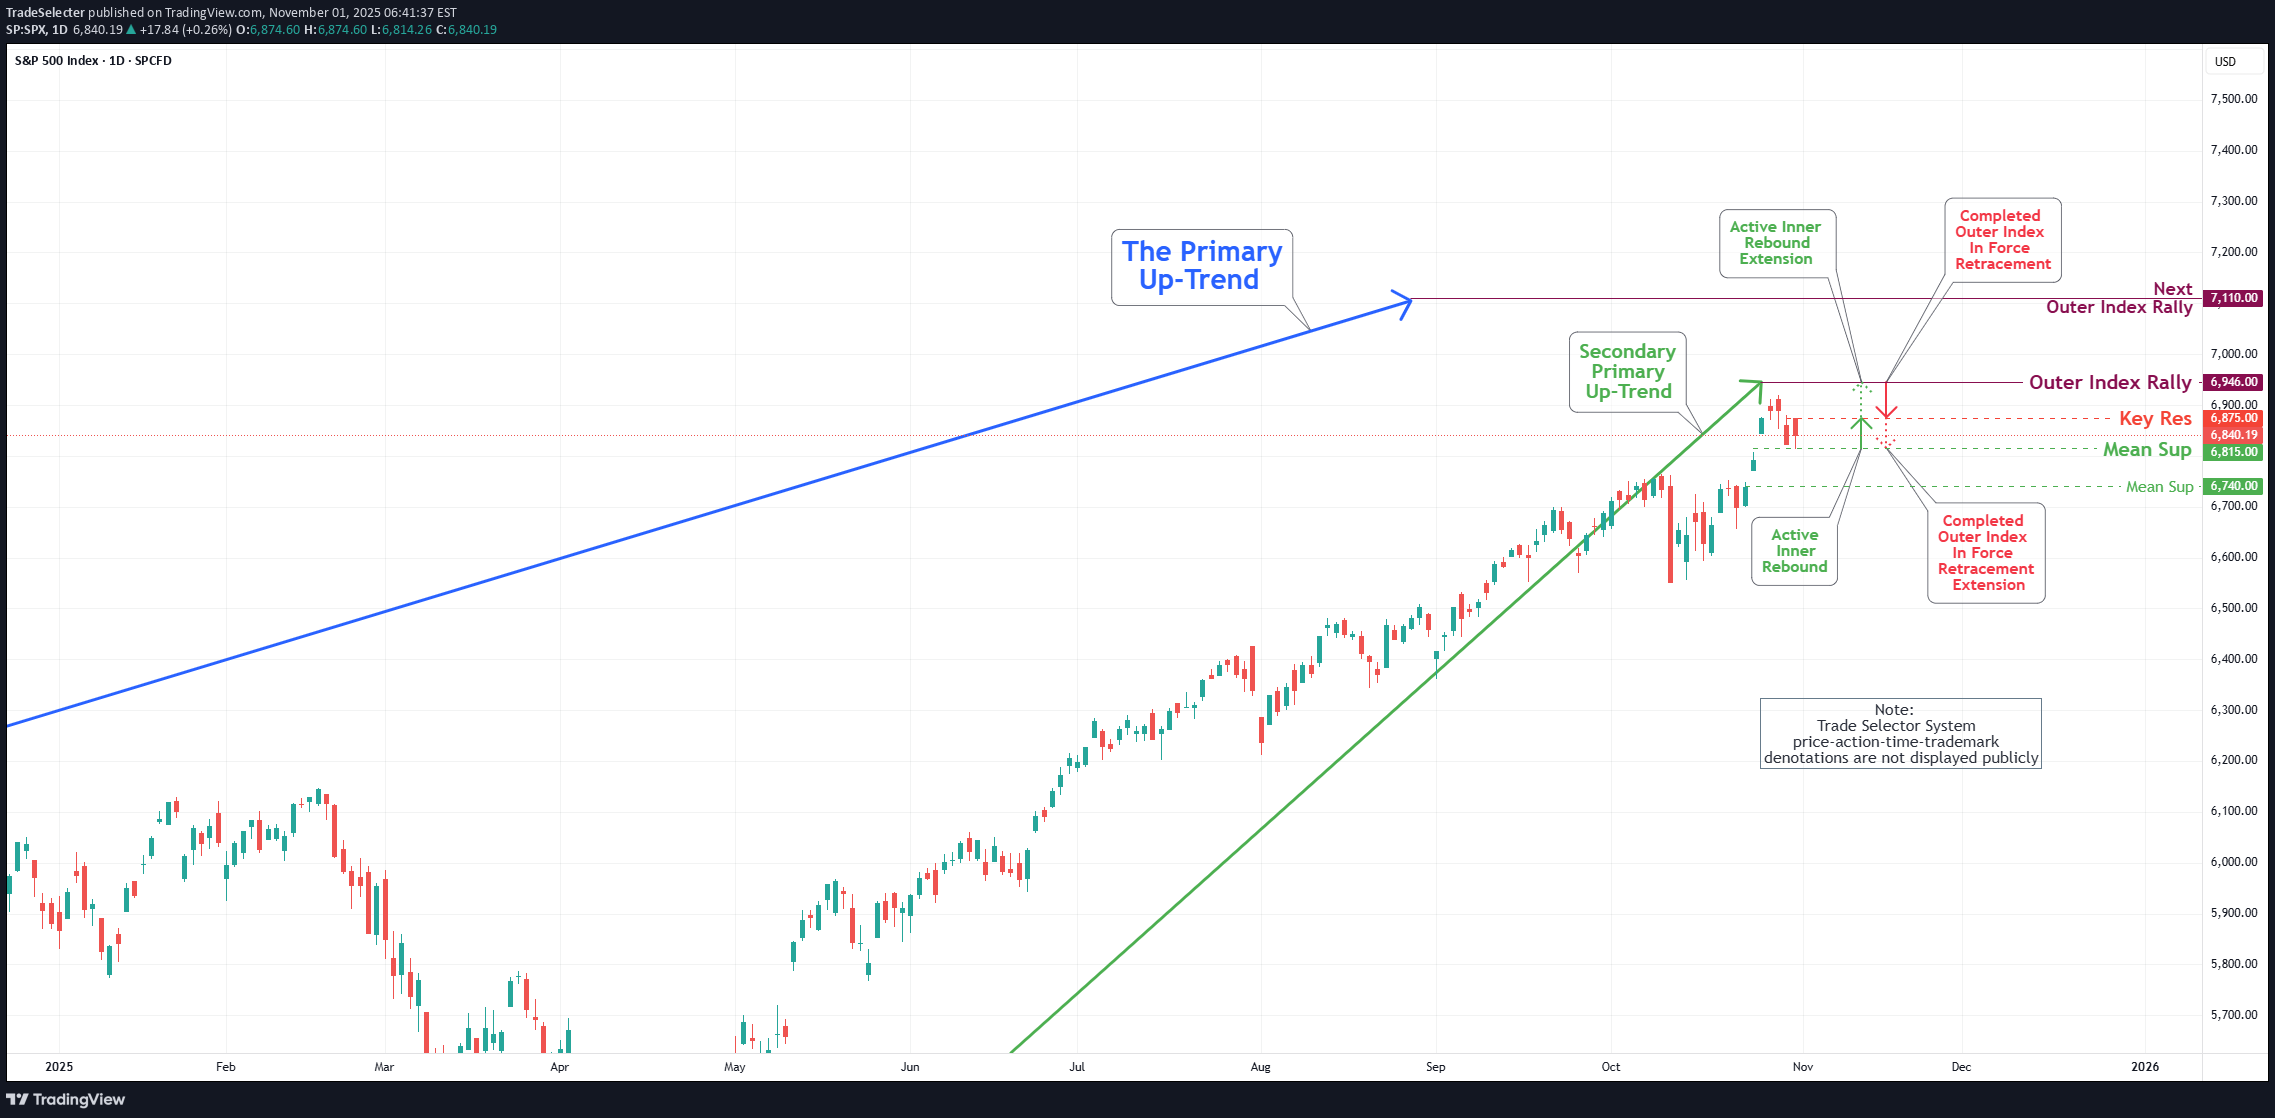
Technical Analysis and Outlook: During the recent trading session, the S&P 500 Index continued its wild ride, highlighting the importance of our key target, which stands as an Outer Index Rally at 6946. Fluctuations between the Mean Support at 6815 and the Key Resistance at 6875 serve as a crucial threshold for market participants. This positioning suggests the potential for further upward momentum, as the prevailing trend indicates a well-structured Active Inner Rebound extension toward the target stated above. Nevertheless, it is essential to acknowledge the possibility of a sustained and gradual pullback within the current Active Inner Rebound zone. Such a pullback may retest the Mean Support at 6815 and could decline further to the Mean Support at 6740 before ultimately resuming an upward trajectory.

EURUSD - GBPUSD - BTC - AUDCAD - S&P500
This weekly insights has a great possibility for a clear directions for [EURUSD - GBPUSD - BTC - AUDCAD - S&P500]

sunya
S&P 500 INDEX | Institutional Technical Analysis Masterpiece
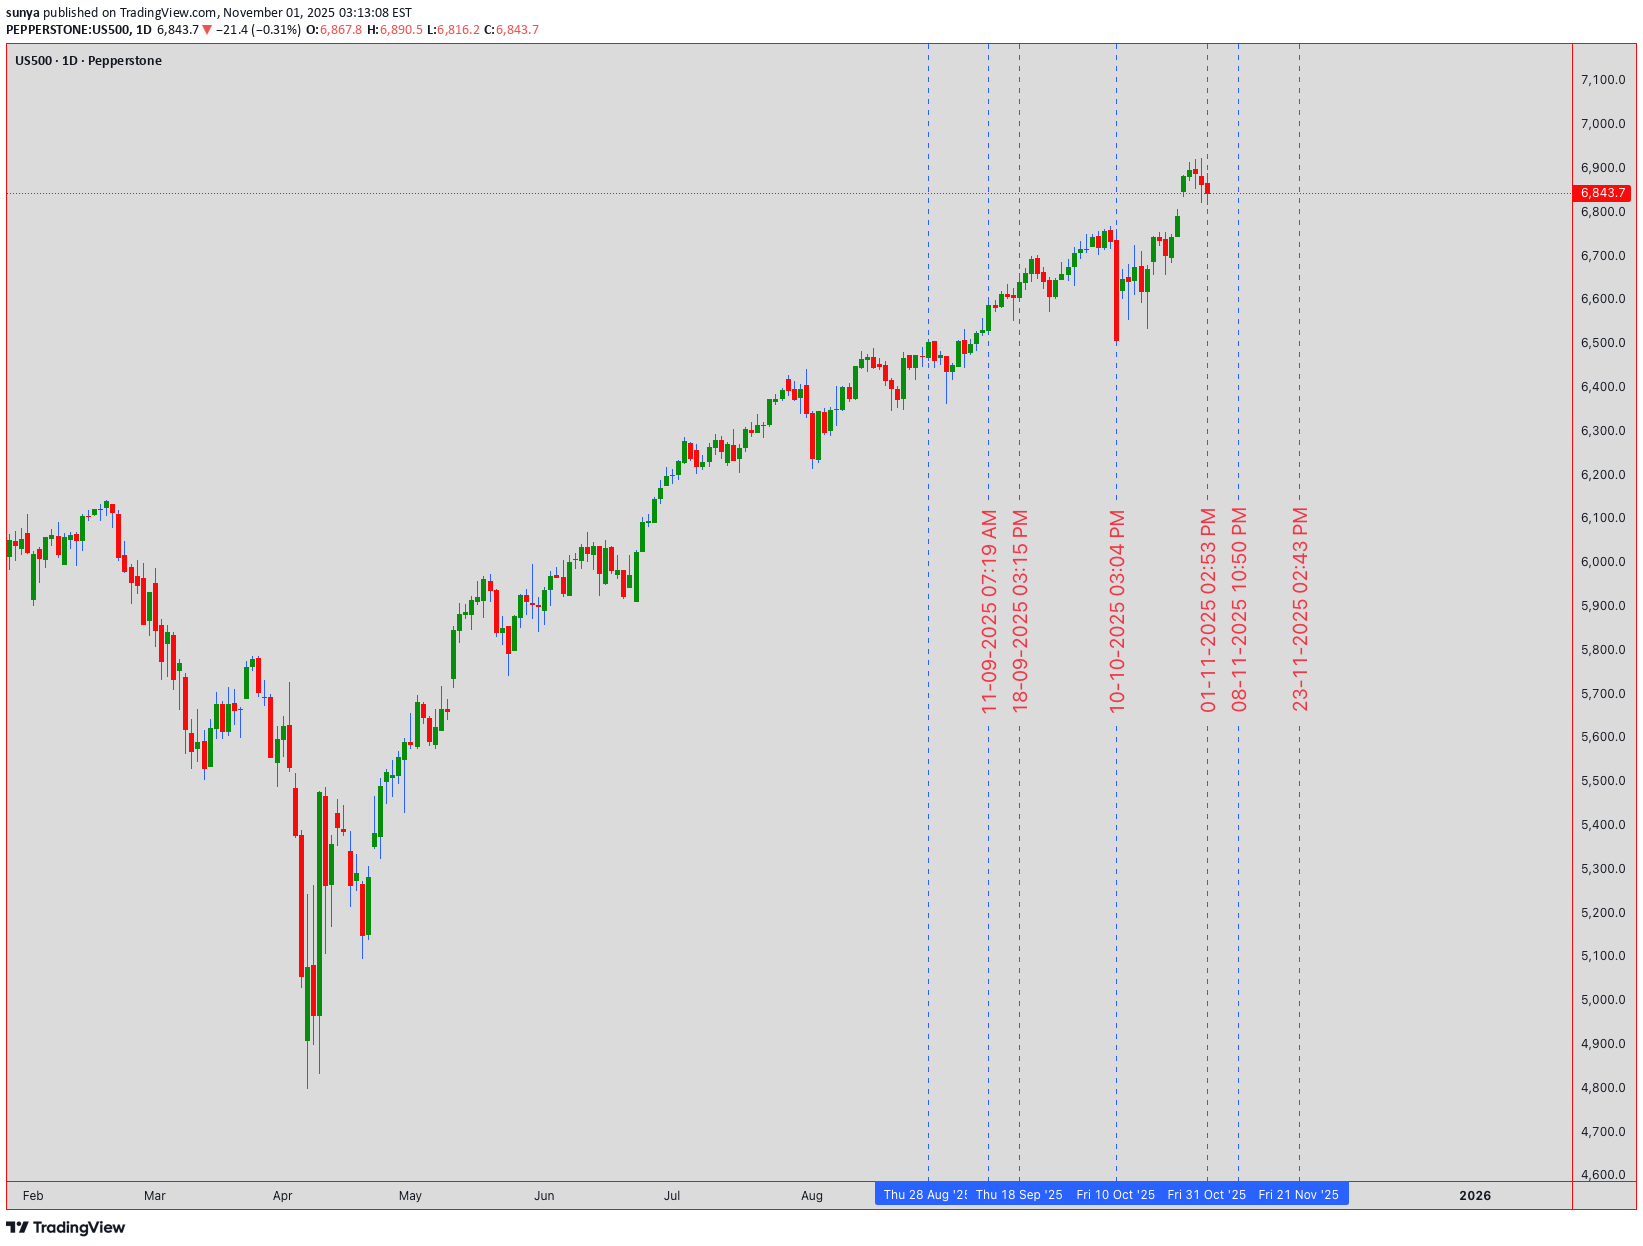
🔥 US500 S&P 500 INDEX | Institutional Technical Analysis Masterpiece | 6,843.7 🔥 📈 ELITE MULTI-TIMEFRAME BREAKDOWN | NOVEMBER 3-7, 2025 TRADING ROADMAP 📈 Current Level: 6,843.7 | Analysis Date: November 1, 2025, 00:54 UTC+4 Hello, TradingView community! 👋 The S&P 500 has been on an absolute tear, closing the week at a staggering 6,843.7 . The big question on everyone's mind is: Are we witnessing a final euphoric push before a correction, or is this simply a pause before the next leg up? This week, from November 3rd to 7th, will be critical. Let's break down the multi-timeframe picture, blending classic theories with modern indicators to build a comprehensive trading plan for both intraday and swing traders. 🧠 ═══════════════════════════════════════════════════════════════════ 🎯 MARKET INTELLIGENCE EXECUTIVE SUMMARY The S&P 500 stands at 6,843.7 , navigating a historic technical confluence zone that will determine the market's trajectory through year-end 2025. Our algorithmic and classical analysis fusion reveals bullish continuation potential with measured risk parameters. This week presents asymmetric opportunities as institutional positioning, technical patterns, and macro catalysts align for potentially explosive moves. Critical Support Infrastructure: 🛡️ Immediate Floor: 6,820 - 6,830 (Algorithmic bid zone) Secondary Base: 6,800 - 6,810 (Institutional accumulation) Major Support: 6,750 - 6,770 (Weekly pivot nexus) Ultimate Defense: 6,700 - 6,720 (Psychological fortress) Resistance & Target Architecture: 🎯 First Ceiling: 6,860 - 6,870 (Intraday supply) Secondary Wall: 6,900 - 6,910 (Round number magnet) Breakout Zone: 6,950 - 6,970 (Pattern objective) Major Extension: 7,000 - 7,020 (Psychological milestone) ═══════════════════════════════════════════════════════════════════ 📊 WEEKLY TIMEFRAME (1W) - MACRO MARKET STRUCTURE Elliott Wave Grand Architecture: 🌊 We're positioned in Minor Wave 3 of Intermediate Wave (5) within the secular bull market. The impulsive structure projects targets at 7,100-7,200 based on Fibonacci extensions. Critical validation: maintaining above 6,720 preserves the bullish count. Primary Count: Wave 3 of (5) targeting 7,100 Alternative: Wave B of expanded flat, risk below 6,650 Invalidation: Weekly close below 6,600 Time projection: Completion by late November Wyckoff Accumulation Schematic: 📚 Phase D - Markup Beginning - Preliminary Supply (PSY): 6,920 tested - Buying Climax (BC): 6,950 rejection - Automatic Reaction (AR): 6,750 hold - Last Point of Support (LPS): Current 6,843 - Sign of Strength (SOS): Pending above 6,870 Ichimoku Cloud Mastery: ☁️ Pine Script® Tenkan-sen: 6,815 (9-period support) Kijun-sen: 6,780 (26-period base) Senkou A: 6,850 (cloud top resistance) Senkou B: 6,720 (cloud bottom support) Chikou Span: Clear above price (bullish) Cloud status: Thick and ascending Expand 1 line Advanced Harmonic Patterns: 🦋 Developing Bullish Gartley with precision ratios: - XA leg: 6,500 to 6,950 (450 points) - AB retracement: 0.618 at 6,672 ✅ - BC extension: Testing 0.786 at 6,845 (current) - D completion: 0.786 XA at 6,850-6,870 - Target upon completion: 7,050-7,100 ═══════════════════════════════════════════════════════════════════ 📉 DAILY TIMEFRAME (1D) - SWING TRADING COMMAND CENTER Japanese Candlestick Mastery: 🕯️ Yesterday's Doji Star at resistance signals equilibrium. Today's action critical: - Close above 6,860 = Three White Soldiers continuation - Close below 6,820 = Evening Star reversal warning - Current bias: Neutral-bullish pending confirmation Master Pattern Recognition: Cup and Handle formation nearing completion: - Cup low: 6,650 (October) - Cup high: 6,920 (Recent peak) - Handle forming: 6,820-6,870 range - Breakout target: 7,190 (270-point measured move) - Volume requirement: 25% above 20-day average Bollinger Bands Configuration: 📊 Upper Band: 6,875 (immediate resistance) Middle Band (20-SMA): 6,810 (dynamic support) Lower Band: 6,745 (oversold boundary) Band Width: Expanding (volatility increasing) %B Indicator: 0.68 (upper half, bullish bias) RSI Multi-Timeframe Analysis: Daily RSI: 59 (room for upside) Hidden bullish divergence vs price action Support trend line from September intact Resistance at 70 provides 11-point runway ═══════════════════════════════════════════════════════════════════ ⚡ 4-HOUR TIMEFRAME (4H) - TACTICAL EXECUTION FRAMEWORK Gann Theory Application: 📐 Pine Script® Current Gann Angles: 1x1: 6,825 (45-degree support) 2x1: 6,850 (current resistance) 1x2: 6,790 (major support) Square of 9: 6,889 (next target) Gann Box: 6,750-6,950 range Time cycles: Nov 5 critical date Expand 2 lines Dow Theory Confirmation Checklist: ✅ Primary Trend: Bullish (new highs achieved) Secondary Trend: Consolidation/Correction Volume Confirmation: Accumulation on dips Breadth Analysis: 65% stocks above 50-DMA Sector Rotation: Technology leading (bullish) Transportation Confirmation: Pending Moving Average Symphony: - EMA 8: 6,838 (ultra-short support) - EMA 21: 6,825 (short-term support) - EMA 50: 6,810 (medium support) - SMA 100: 6,785 (strong support) - SMA 200: 6,750 (major trend support) Pattern Alert: 🚨 Ascending Triangle resolution imminent: - Horizontal resistance: 6,860-6,870 - Rising support: 6,820-6,830 - Apex convergence: November 4 - Breakout projection: 6,950+ ═══════════════════════════════════════════════════════════════════ 🎪 1-HOUR TIMEFRAME (1H) - PRECISION TRADING LABORATORY Micro Pattern Development: 🔬 Double Bottom forming at 6,825: - First bottom: 6,823 (10:00 UTC) - Second bottom: 6,826 (14:00 UTC) - Neckline resistance: 6,855 - Pattern target: 6,885 (30-point move) VWAP Trading Matrix: Daily VWAP: 6,841 Weekly VWAP: 6,825 Monthly VWAP: 6,795 Upper Band 1: 6,858 (first resistance) Upper Band 2: 6,875 (second resistance) Lower Band 1: 6,824 (first support) Lower Band 2: 6,807 (second support) Support & Resistance Precision Grid: Pine Script® R4: 6,890 (Major resistance) R3: 6,875 (Daily upper BB) R2: 6,860 (Pattern neckline) R1: 6,850 (Immediate resistance) PIVOT: 6,843.7 (Current Price) S1: 6,835 (Micro support) S2: 6,825 (VWAP support) S3: 6,810 (Major support) S4: 6,795 (Monthly VWAP) Expand 4 lines ═══════════════════════════════════════════════════════════════════ ⚡ 30-MINUTE TIMEFRAME (30M) - SCALPING COMMAND POST Microstructure Analysis: 🎯 Bull Flag pattern developing: - Pole: 6,810 to 6,855 (45 points) - Flag consolidation: 6,835-6,845 - Breakout trigger: 6,846 - Target: 6,890 (45-point measured move) Volume Profile Intelligence: 📊 POC (Point of Control): 6,837 VAH (Value Area High): 6,848 VAL (Value Area Low): 6,828 HVN (High Volume Node): 6,835-6,840 LVN (Low Volume Node): 6,855-6,860 (breakout zone) Scalping Execution Zones: Buy Zones: • Zone 1: 6,835-6,838 (POC test) • Zone 2: 6,828-6,831 (VAL support) • Zone 3: 6,820-6,823 (Strong bid) Sell Zones: • Zone 1: 6,848-6,851 (VAH resistance) • Zone 2: 6,858-6,861 (Supply zone) • Zone 3: 6,868-6,871 (Major resistance) ═══════════════════════════════════════════════════════════════════ 🏃 15-MINUTE & 5-MINUTE HYPERSPEED SCALPING 15-Minute Lightning Analysis: ⚡ Wedge pattern near apex: - Upper trendline: 6,847 - Lower trendline: 6,839 - Breakout direction: 70% probability upward - Quick target: 6,855 (+12 points) - Stop: 6,835 (-8 points) 5-Minute Algorithmic Signals: Pine Script® Long Entry Conditions: RSI(5) < 30 AND Price > VWAP = BUY MACD crossover AND Volume > Average = BUY Price touches EMA(20) from above = BUY Short Entry Conditions: RSI(5) > 70 AND Price < VWAP = SELL MACD crossunder AND High volume = SELL Price rejected at resistance = SELL Exit Rules: Take profit: 8-10 points Stop loss: 5-6 points Time stop: 15 minutes max hold Expand 9 lines Session Volatility Map: 🕐 Asian: 10-15 point range (quiet) London Open: 20-30 point expansion NY Premarket: 25-35 point volatility NY Open: 40-50 point moves NY Afternoon: 20-30 point consolidation ═══════════════════════════════════════════════════════════════════ 📅 WEEKLY STRATEGIC FORECAST (NOVEMBER 3-7, 2025) Monday, November 3: 🚀 Opening gap probability: 60% bullish Strategy: Buy weakness to 6,830, target 6,870 Key levels: Support 6,820, Resistance 6,880 Expected range: 50 points Tuesday, November 4: 🗳️ Election Day - Extreme volatility expected Strategy: Straddle/strangle positions Potential range: 6,750-6,920 (170 points!) VIX spike likely above 25 Wednesday, November 5: 💥 Post-election directional resolution Strategy: Trade the breakout aggressively Bullish above 6,880 → Target 6,950 Bearish below 6,800 → Target 6,720 Thursday, November 6: 📊 FOMC minutes and economic data Strategy: Fade first move, trade reversal Expected consolidation: 6,850-6,900 Options gamma concentration: 6,875 Friday, November 7: 🎯 Weekly options expiration dynamics Strategy: Theta decay trades around 6,850 Pin risk: 6,850 strike concentration Weekly close above 6,870 = Bullish next week ═══════════════════════════════════════════════════════════════════ ⚖️ INSTITUTIONAL RISK MANAGEMENT PROTOCOLS Intraday Risk Framework: 🛡️ Position sizing: 0.5-1% risk per trade Risk-Reward: Minimum 1:2.5 ratio Daily loss limit: -2% portfolio max Consecutive losses: 3 max, then pause Profit trailing: 60% of maximum gain Breakeven stop: At 10-point profit Scaling strategy: 3 entries maximum Swing Position Architecture: 💼 Core position: 50% at 6,820-6,830 Add-on levels: 25% at 6,800, 25% at 6,780 Stop loss: Below 6,750 (all positions) Target 1: 6,900 (25% exit) Target 2: 6,950 (35% exit) Target 3: 7,000 (25% exit) Runner: 7,050+ (15% hold) ═══════════════════════════════════════════════════════════════════ 🔴 RISK SCENARIOS & CIRCUIT BREAKERS Bearish Invalidation Levels: 🐻 15-min close below 6,835 = Micro caution Hourly close below 6,820 = Intraday bearish 4H close below 6,800 = Swing bearish shift Daily close below 6,750 = Trend reversal risk Weekly close below 6,700 = Major bear signal Tail Risk Considerations: 🦢 • Geopolitical shock (100+ point gap risk) • Fed policy surprise (2-3% moves) • Tech earnings disasters (sector rotation) • Credit event contagion (systemic risk) • AI bubble concerns (valuation reset) ═══════════════════════════════════════════════════════════════════ 💎 ELITE CONFLUENCE TRADING ZONES Premium Buy Zone: ✅ 6,820-6,830 (Multi-timeframe support + Fibonacci 61.8% + VWAP + Moving average cluster) Optimal Sell Zone: ❌ 6,870-6,880 (Resistance confluence + Pattern targets + Round number + Options barrier) Breakout Trigger: 🚀 6,870-6,875 (Triangle apex + Bollinger Band + Volume breakout zone) ═══════════════════════════════════════════════════════════════════ 🏆 MASTER TRADER'S FINAL VERDICT The S&P 500 at 6,843.7 presents a high-conviction bullish opportunity with exceptional risk-reward dynamics. Technical confluence across multiple timeframes, combined with constructive market internals and seasonal factors, supports upside continuation toward 6,900-6,950 initially, with 7,000+ potential. Top 3 Highest Probability Trades: 🎯 Swing Long: 6,820-6,830 → Target: 6,950 (RR 1:4) Breakout Long: Above 6,870 → Target: 6,920 (RR 1:3) Scalp Long: VWAP 6,841 → Target: 6,855 (RR 1:2.5) Trading Wisdom: 🧠 Position for probability, not possibility. Size for survival, not home runs. The best traders are risk managers who happen to trade. "Markets can remain irrational longer than you can remain solvent. Trade the chart, not the opinion!" 💡 ═══════════════════════════════════════════════════════════════════ 📍 ACTIONABLE INTELLIGENCE SUMMARY Bull market intact above 6,750. Accumulate dips toward 6,820. Target 7,000 by month-end. Risk management is paramount during election week volatility. Trade with discipline. Prosper with patience. 💰 ═══════════════════════════════════════════════════════════════════ #SPX #SP500 #US500 #TechnicalAnalysis #Trading #StockMarket #Indices #DayTrading #SwingTrading #ElliottWave #Wyckoff #HarmonicPatterns #OptionsTrading #VIX #MarketStructure #OrderFlow #InstitutionalTrading #AlgorithmicTrading #TradingView #MarketForecast #SPY #ES_F 🔔 Follow for Institutional-Grade Analysis | Precision • Discipline • Profits 📊 Disclaimer: This analysis is educational only. Trading carries substantial risk of loss. Past performance does not guarantee future results. Always conduct independent research and employ proper risk management.

Understanding the Concept of Exotic Options
Introduction: Beyond the Vanilla Options In the world of derivatives trading, options are among the most powerful instruments available to investors. Traditional or “vanilla” options—such as calls and puts—are already versatile tools for hedging and speculation. However, as financial markets evolved, traders and institutions began to seek more sophisticated instruments that could offer customized payoffs, align with complex risk management needs, or exploit specific market views. This need gave birth to a more advanced class of derivatives known as exotic options. Exotic options go beyond the standard payoff structure of vanilla options. They can depend on multiple underlying assets, trigger conditions, time periods, or paths that prices follow. These options have become integral in structured products, risk management, and tailored investment strategies, particularly in global forex, commodity, and equity-linked markets. This essay explores the concept, types, valuation, applications, advantages, and risks of exotic options—providing a comprehensive understanding of how these instruments work in modern finance. 1. What Are Exotic Options? Exotic options are non-standard derivative contracts that have complex features differentiating them from traditional options. While vanilla options grant the right to buy (call) or sell (put) an asset at a predetermined strike price before or at expiration, exotic options can alter how and when payoffs are determined. They may: Depend on the path of the underlying asset’s price, not just its final value. Have multiple exercise or settlement dates. Involve different underlying assets or currencies. Include barriers, averages, or digital features that modify payouts. For instance, a barrier option may only become active (“knock-in”) or inactive (“knock-out”) if the underlying price crosses a specified level. Similarly, an Asian option’s payoff depends on the average price of the underlying over time, reducing volatility effects. Exotic options are thus tailored to specific investor needs—allowing hedgers or speculators to fine-tune their exposure to price movements, volatility, and time decay. 2. Evolution and Market Use The development of exotic options traces back to the late 1970s and 1980s, when financial innovation surged alongside advances in computing and quantitative finance. Early forms appeared in the foreign exchange and commodity markets, where traders needed customized hedging tools to manage complex exposures. By the 1990s, exotic options became a cornerstone of structured finance, used by investment banks to create tailor-made products for corporate clients and high-net-worth investors. Today, exotic options are found across: Currency markets (FX options): Commonly used for hedging exchange rate risks. Commodity markets: To manage exposure to volatile prices. Equity-linked notes and structured products: For customized return profiles tied to indices or stock baskets. Interest rate and credit derivatives: To hedge rate movements or credit events. Exotic options have thus evolved from niche instruments into mainstream financial engineering tools—allowing traders to achieve precise risk-return outcomes that vanilla options cannot offer. 3. Key Characteristics of Exotic Options Exotic options differ from vanilla options through unique features such as: a. Path Dependency In vanilla options, only the final price of the underlying asset matters. In exotic options, however, the entire price path may influence the payoff. Example: In an Asian option, the payoff depends on the average price over time, not the terminal price at expiration. b. Conditional Payoffs Many exotic options include “if-and-only-if” conditions. For instance: Barrier options activate or deactivate based on price thresholds. Lookback options depend on the maximum or minimum price achieved during the option’s life. c. Multi-Asset Dependence Some exotic options depend on more than one underlying, such as currency pairs, indices, or stock baskets. Example: A basket option may be based on the average performance of multiple assets. d. Complex Exercise Rules Unlike American or European options, some exotics allow customized exercise schedules or partial exercises tied to specific market events. e. Tailored Payout Structures Payoffs can be linear, binary, capped, or floored—allowing unique risk-reward combinations suited to specific strategies. 4. Major Types of Exotic Options There are numerous exotic options, but the following categories are among the most common and important: a. Barrier Options Barrier options are activated or extinguished when the underlying asset hits a certain level. Types include: Knock-in options: Become active only if the price crosses the barrier. Knock-out options: Become void if the barrier is breached. Double-barrier options: Have both upper and lower thresholds. These are popular in currency and commodity markets due to their cost-effectiveness and targeted exposure. b. Asian Options Also known as average options, these derive their value from the average price of the underlying over a period. They are used to smooth out volatility and reduce the impact of short-term price swings—ideal for commodities or volatile assets. c. Lookback Options Lookback options allow the holder to “look back” over the life of the option to determine the optimal strike or payoff. For instance, the holder of a lookback call can buy at the lowest price observed during the option period. These are valuable for volatility trading and performance-linked bonuses, but are more expensive due to the flexibility they provide. d. Binary (Digital) Options Binary options provide all-or-nothing payouts. If a condition is met (for example, the asset price exceeds the strike), a fixed amount is paid; otherwise, nothing is received. They are used in speculative trading and hedging against specific events (like rate announcements or price thresholds). e. Compound Options A compound option is an option on another option. There can be four variants—call on call, call on put, put on call, and put on put. These are primarily used by institutional investors managing portfolios of options or structured exposures. f. Chooser Options These allow the holder to decide, at a future date, whether the option will be a call or put. They are ideal for hedging uncertainty, especially in situations where the future direction of prices is unclear. g. Rainbow or Basket Options These depend on multiple underlying assets. The payoff may be linked to the best or worst performer, or an average of all. Used widely in equity-linked structured products to diversify exposure. h. Barrier-Rebate and Range Options In these, the payoff depends on whether the price stays within a certain range or hits a barrier, sometimes offering a rebate if deactivated. 5. Pricing and Valuation Challenges Pricing exotic options is more complex than pricing vanilla ones because of path dependency and non-linear payoffs. Traditional Black-Scholes models are insufficient for many exotics. Instead, advanced methods such as: Monte Carlo simulation (for path-dependent options), Binomial or trinomial tree models (for barrier options), Finite difference methods (for solving partial differential equations), are used for accurate valuation. Moreover, the valuation must incorporate: Volatility skew and smile effects, Interest rate differentials (especially in FX exotics), Time decay and path volatility, and Counterparty credit risks. Due to these complexities, exotic option trading is typically limited to institutional investors and quantitative traders with access to robust pricing models and computing power. 6. Strategic Applications in Markets Exotic options play several strategic roles in modern finance: a. Risk Management Corporations use them to hedge specific exposures that vanilla options cannot cover efficiently. For example: A company importing oil may use an Asian call to hedge against the average price rather than the spot price. Exporters use barrier options to hedge currency risks only if extreme price movements occur. b. Yield Enhancement Investors seeking higher returns may purchase structured products embedding exotic options (like range accrual notes) that provide enhanced coupons tied to certain price conditions. c. Speculation and Arbitrage Traders exploit exotic options to speculate on volatility, correlations, or price ranges rather than pure direction. For instance, digital options allow bets on whether a price will surpass a level by expiration. d. Structured Product Design Exotic options form the building blocks of many structured investment products—such as equity-linked notes, autocallables, and principal-protected instruments—allowing issuers to customize payoffs. 7. Advantages of Exotic Options Customization: Can be precisely structured to match unique market views or hedge specific risks. Cost Efficiency: Often cheaper than vanilla options offering similar exposures due to conditional triggers. Strategic Flexibility: Allow exposure to volatility, time, or correlation rather than simple price direction. Diversification: Multi-asset or path-based structures provide diversification benefits. Creative Payoffs: Enable innovative investment products appealing to both retail and institutional investors. 8. Risks and Limitations While attractive, exotic options carry significant risks: a. Complexity Risk The intricate payoff structures make them hard to value or understand, leading to potential mispricing. b. Liquidity Risk Most exotic options are over-the-counter (OTC) products, not exchange-traded, hence low liquidity and wider bid-ask spreads. c. Counterparty Risk Since many trades are bilateral, there is always the possibility of default by the counterparty. d. Model Risk Valuation depends on complex models and assumptions about volatility, correlation, and interest rates. Incorrect assumptions can lead to misestimation of fair value. e. Regulatory and Transparency Issues Post-2008, regulators have tightened rules around complex derivatives, requiring greater disclosure and collateralization. Yet, transparency remains limited compared to exchange-traded instruments. 9. Real-World Examples Currency Knock-Out Options: Commonly used by multinational corporations to hedge FX exposure cost-effectively. Asian Options in Oil Markets: Used by airlines to manage jet fuel price volatility. Autocallable Notes: Retail structured products embedding digital and barrier options that offer enhanced coupons but risk early termination. These examples show how exotic options have integrated into mainstream hedging and investment frameworks, providing flexibility and innovation. 10. The Future of Exotic Options With the rise of AI, quantitative finance, and data-driven analytics, the design and pricing of exotic options are becoming increasingly sophisticated. Innovations in machine learning, stochastic volatility models, and blockchain-based smart derivatives promise to make exotic options more transparent and accessible. However, the challenge remains balancing complexity with clarity. Regulators and financial educators are emphasizing the need for greater transparency and investor awareness to prevent misuse or misunderstanding of such instruments. Conclusion Exotic options represent the pinnacle of financial innovation—a class of derivatives that blend mathematics, creativity, and risk management into one. They extend beyond the simplicity of vanilla options, allowing investors to capture nuanced market scenarios, hedge complex exposures, or design innovative return profiles. However, their sophistication also brings inherent risks—especially in valuation, liquidity, and counterparty exposure. As global markets evolve, the role of exotic options continues to expand, bridging the gap between customized investment strategies and advanced financial engineering. In essence, understanding exotic options is not merely about mastering a financial product—it’s about appreciating how modern finance tailors risk, reward, and imagination into instruments that shape the dynamics of the global derivatives market.

bwy
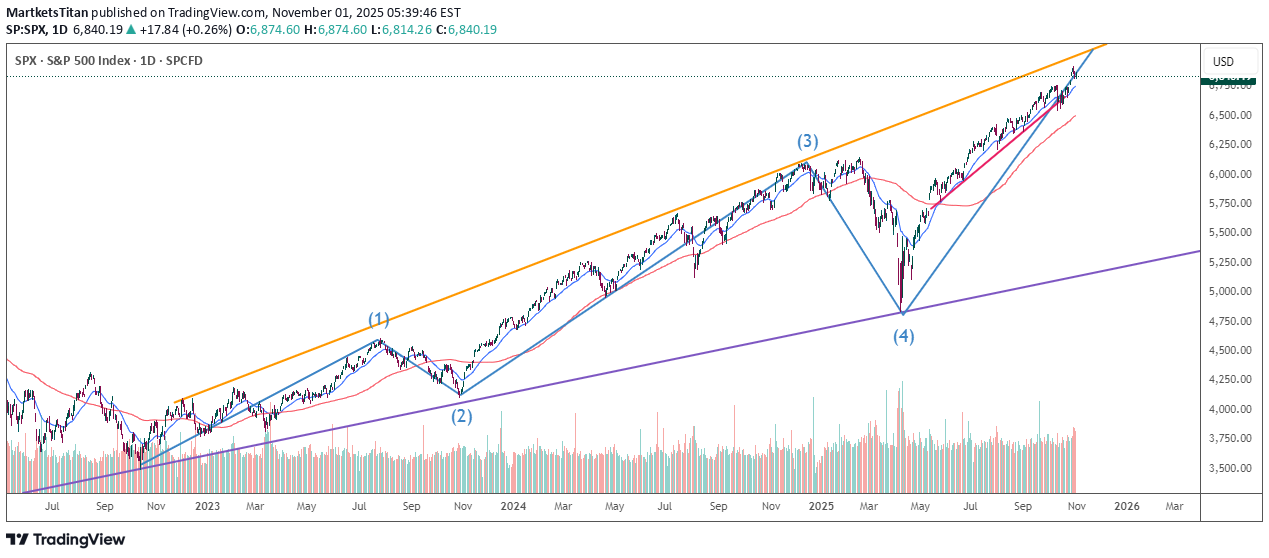
S&P Nearing Major Resistance (Update)
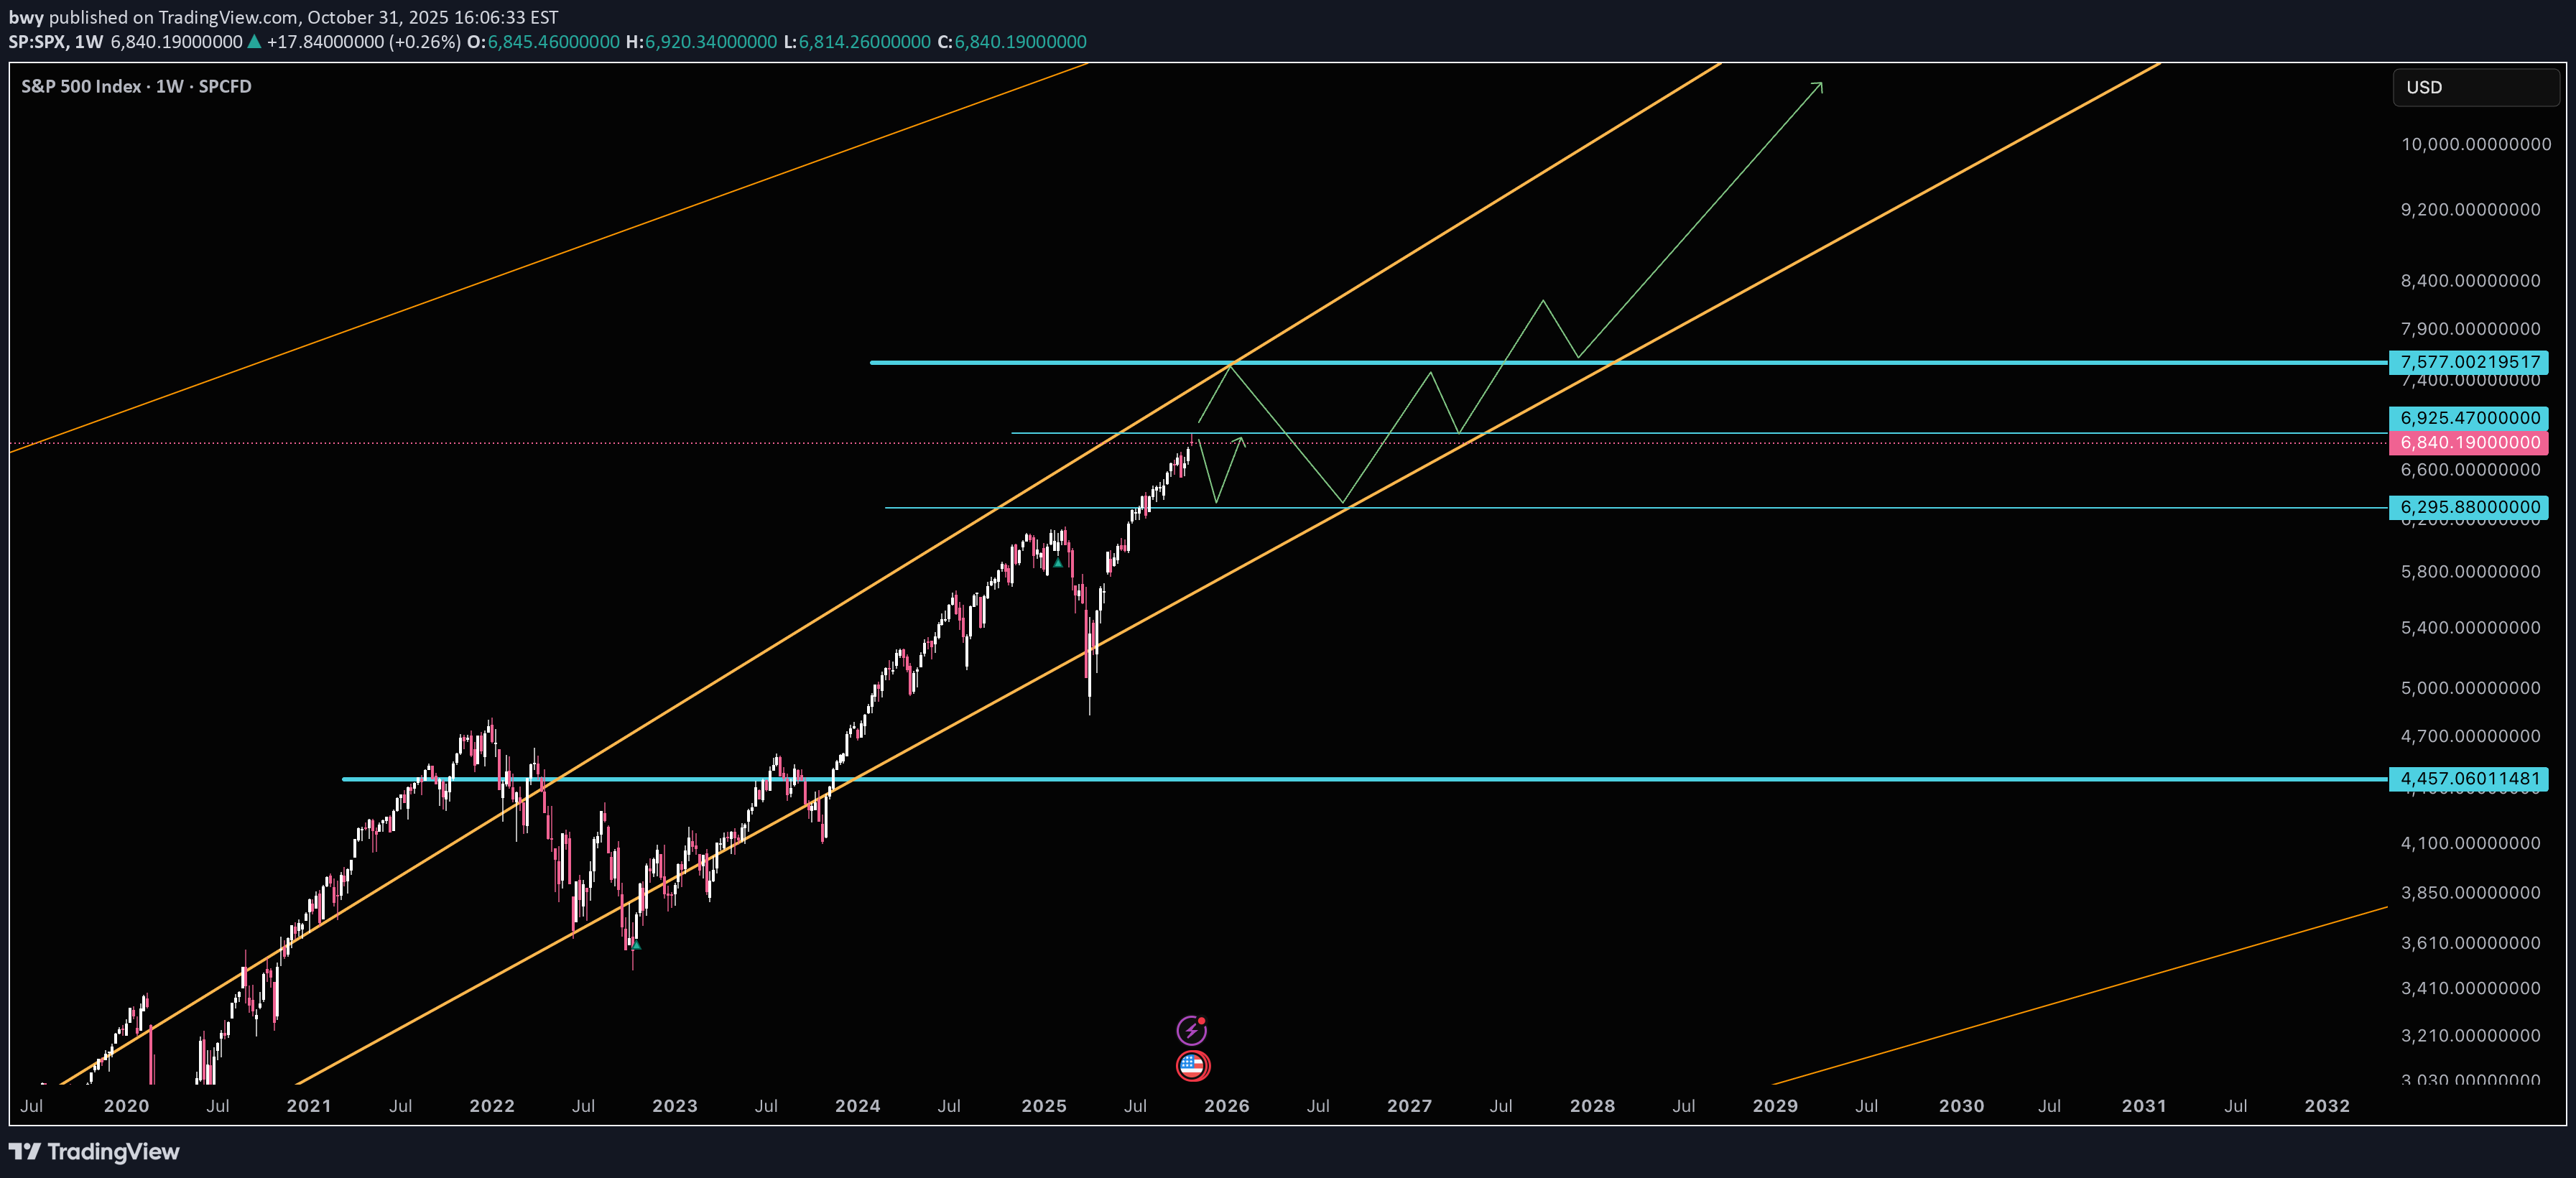
This updates my previous S&P chart back last year showing the S&P still had room to run until any major resistance. We're nearing that major resistance at 7577. Looks like it might hit around January 2026. The trouble is this trend is heating up and we needed a pullback to 6295. With all the excitement from Nvidia and other major Hyperscalers I'm worried it's going to just go straight to Major resistance. *If it does* we could be looking at a decently large pullback next year (finishing around August) down to that 6295 area and back into the supporting trend line for the next big uptrend to start. If however we slow down here and get a pullback back to 6295 then I think we're good to make it over the major resistance without that big pullback next year. Either way once we hit the major resistance at 7577 we'll need to get close to that lower trend line at some point to begin a new bull run. Good luck and take caution as we approach this resistance!

NoFOMO_
Topping Signal?
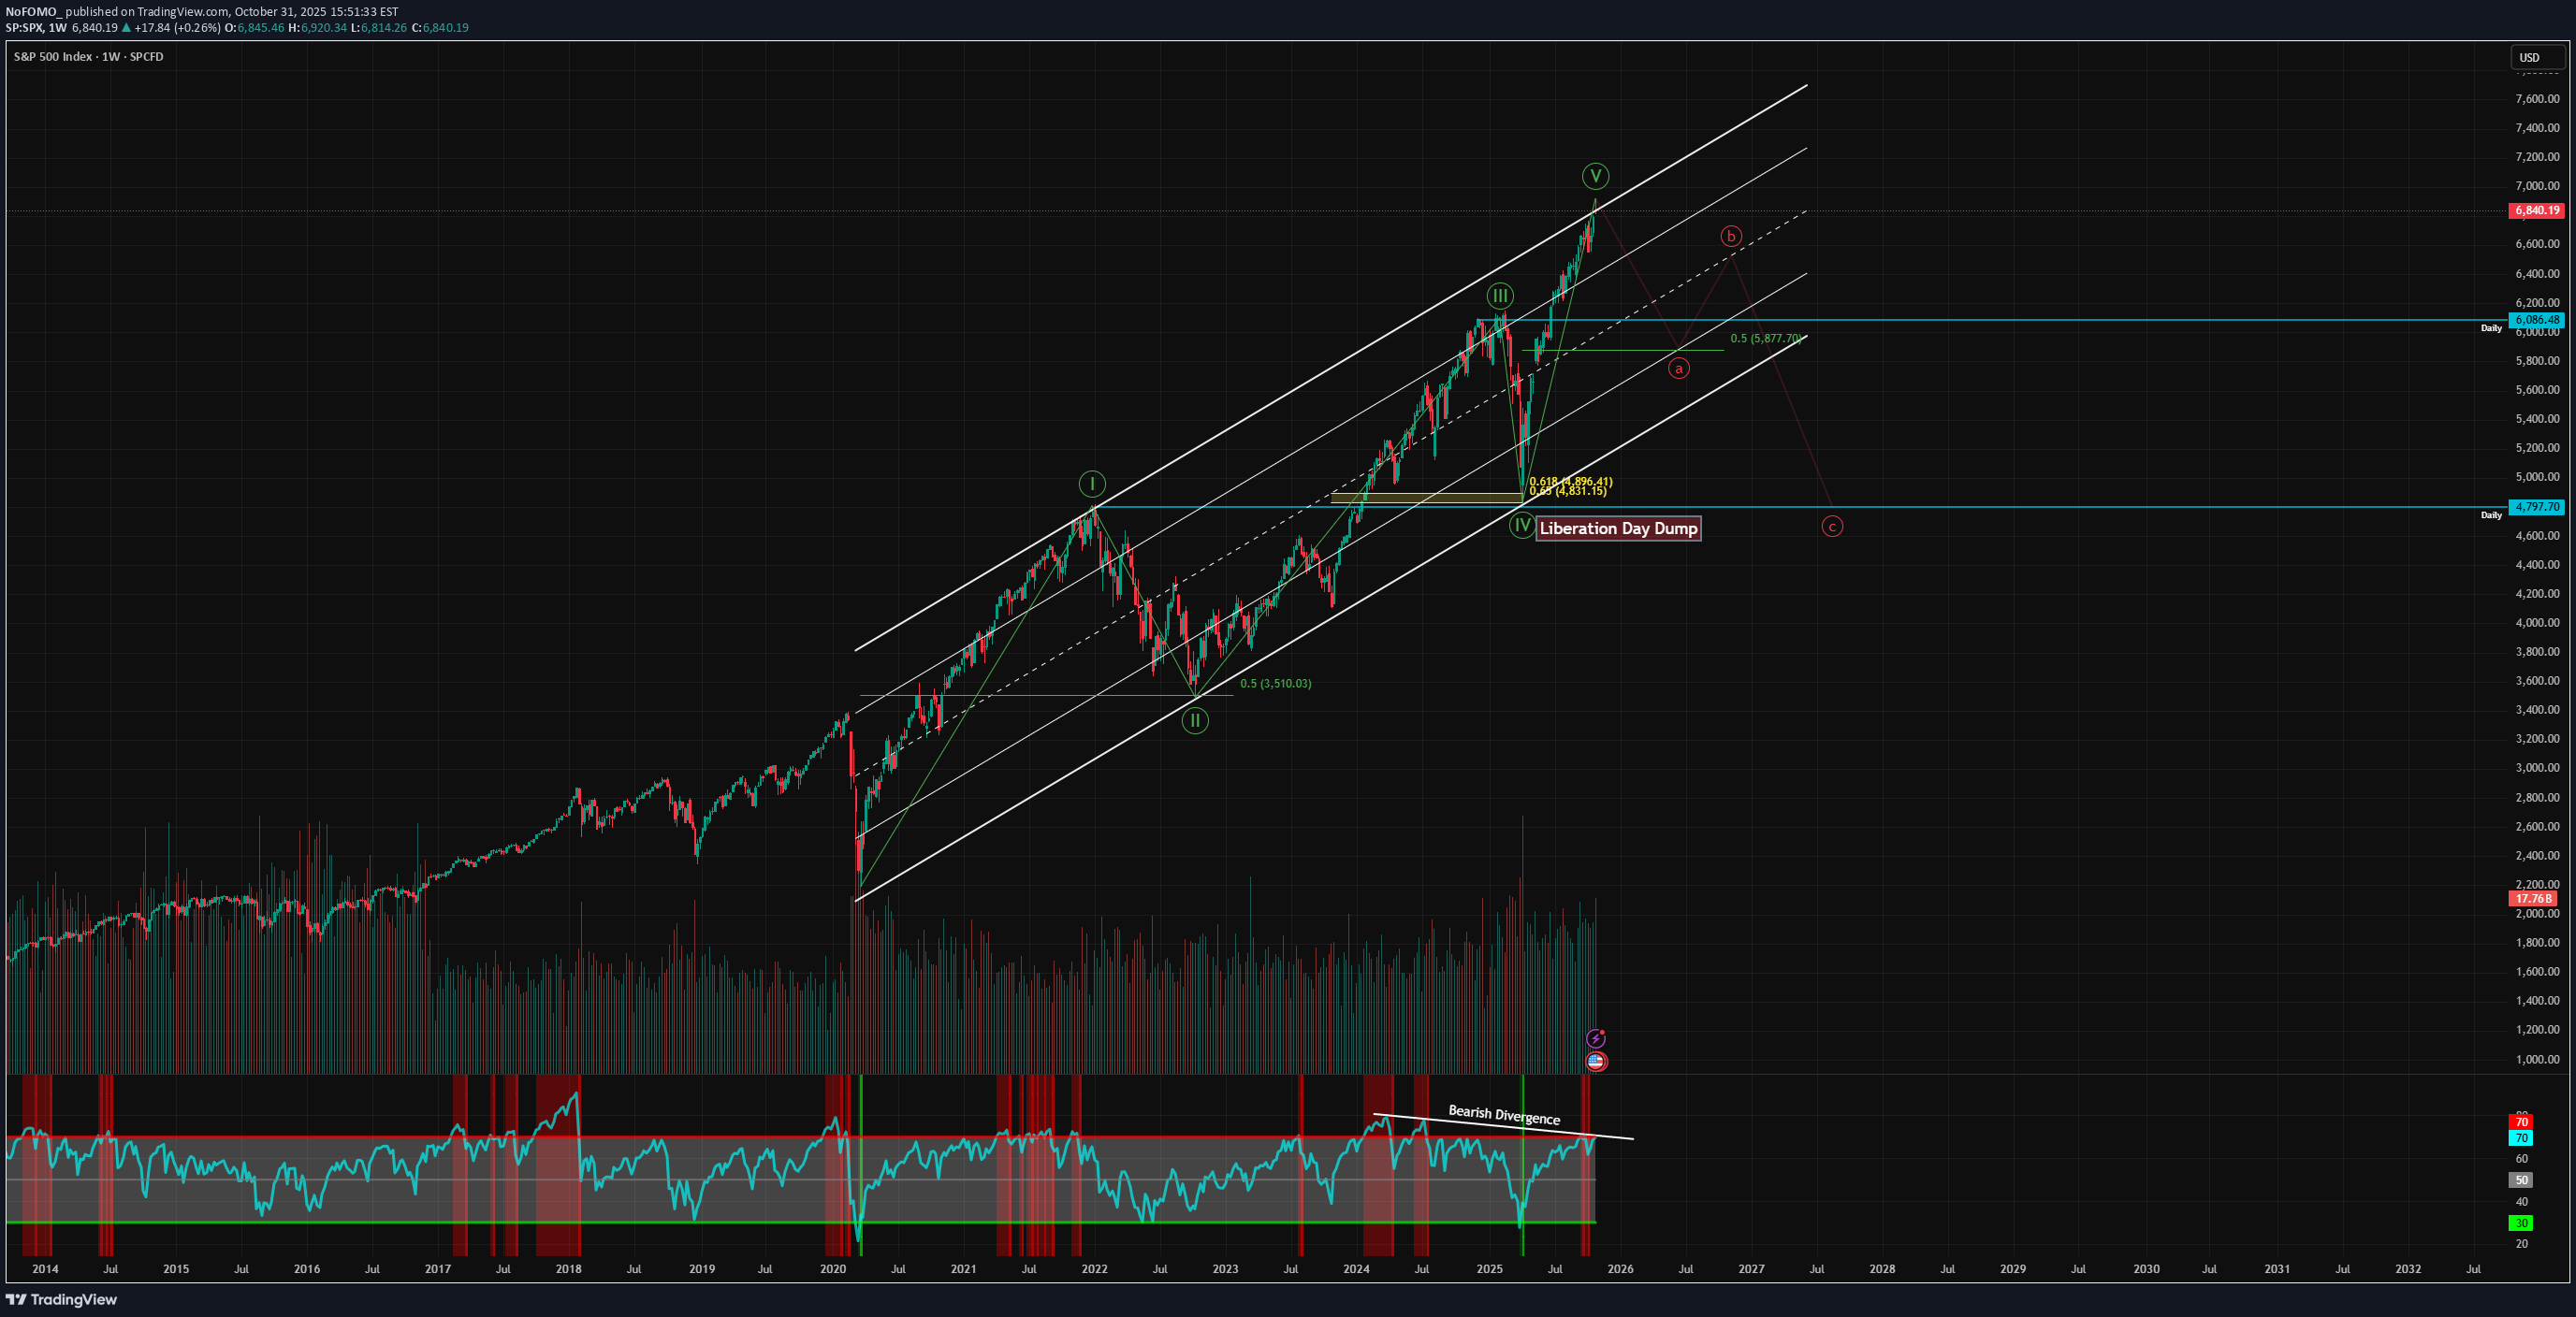
To me this looks like Wave 5 of the Elliott Wave supercycle in the stock market. We had a monster rally since the liberation day dump, now we are coming up against some strong resistance. Should we be concerned? So far I have taken a lot of chips of the table. I am still very much long, we don't fight the tape, but if you haven't already started booking profits; have a good hard think about how much higher we could go from here. The government shutdown will start to filter through the earnings reports next earnings season, especially if it persists over a month. Consumer stocks are showing weakness, whilst the AI trade continue to go vertical, but it will not go on forever - something will eventually give.

WiseLeoTrading
US500 Strong Bullish Momentum
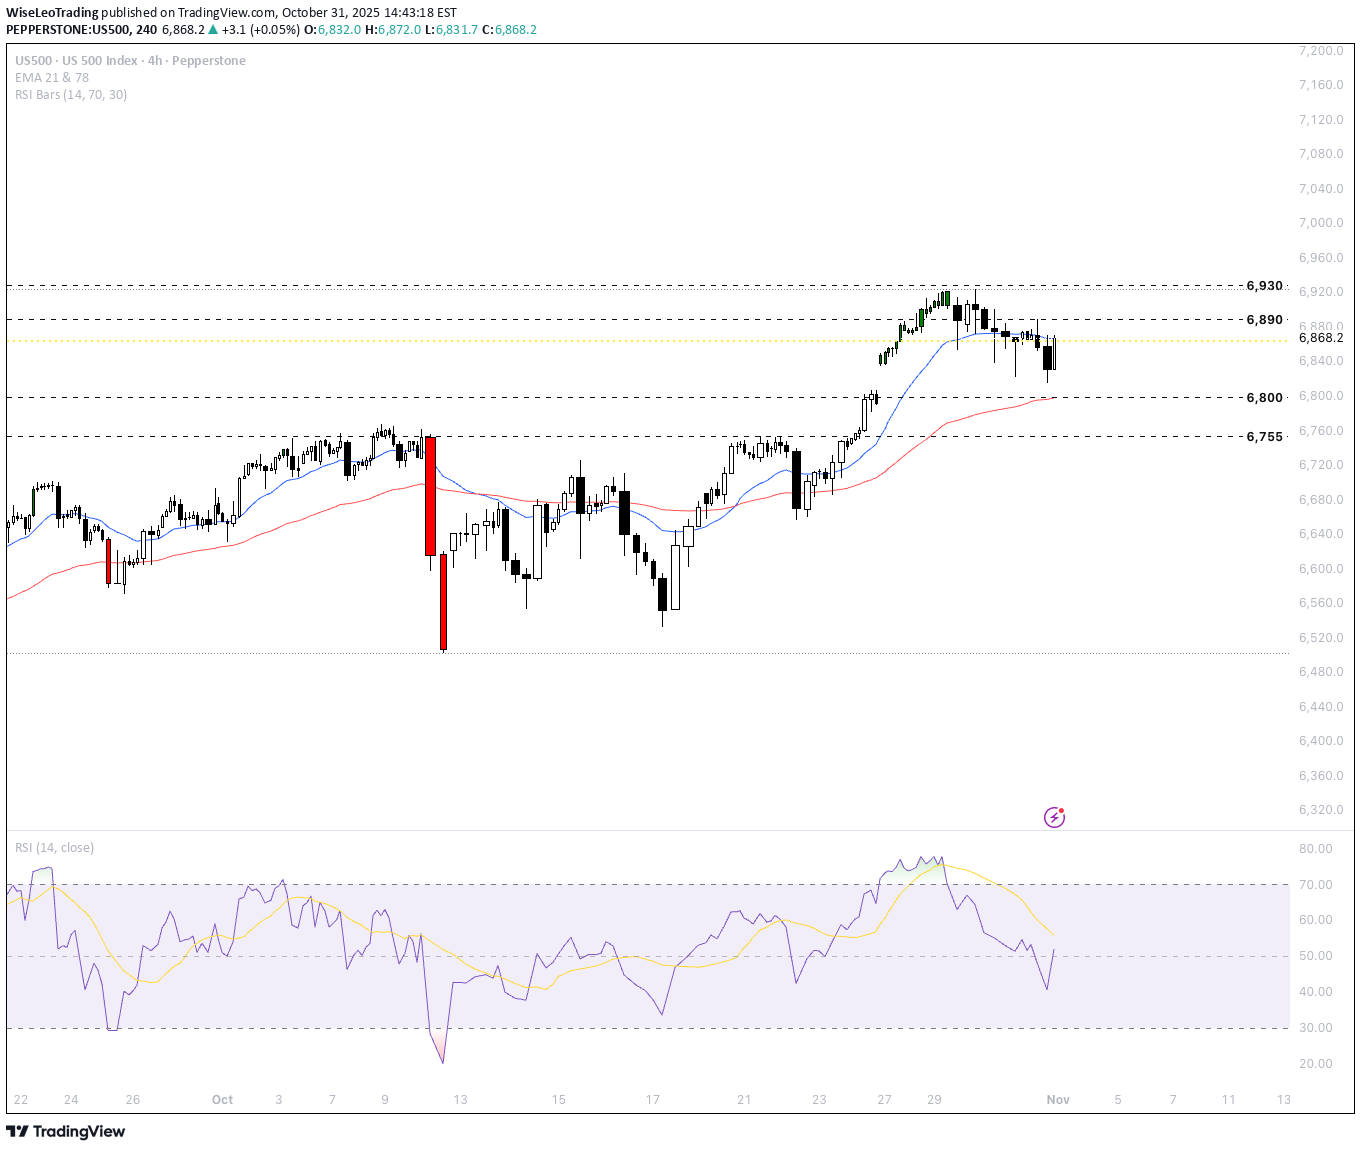
Fundamental Analysis The current bullish trajectory of the US500, is overwhelmingly earnings driven. Robust Q3 corporate results, notably massive beats from tech and consumer giants like Apple with record iPhone sales and services, Amazon’s cloud revenue surge , have provided a decisive fundamental lift. This resilient performance has overshadowed macro uncertainties around Fed policy caution, trade tensions and cemented investor confidence in double digit earnings growth projections for 2026. The rally is characterized by solid breadth, extending beyond mega caps to sectors like Energy, suggesting a durable economic foundation. Technical Analysis The US500 exhibits strong bullish momentum, on track for its best monthly streak in years. The index is testing a critical resistance zone between 6,885 and 6,890, formed by the convergence of long-term trend lines. A confirmed weekly close decisively above 6,900 is necessary to validate a powerful breakout toward the psychological 7,000 level and signal an acceleration in the uptrend. Short term downside is currently contained by strong support levels, indicating that pullbacks are likely to be met with active dip buying. Outlook The overall outlook for the US500 is constructively bullish into year end. As positive earnings guidance reinforces investor sentiment, the path of least resistance remains higher. However, given the proximity to all time highs and critical technical resistance, short-term volatility and consolidation are likely as the market digests the risk of stretched valuations e.g. (Nvidia's high GDP ratio is a notable concern) before attempting a sustainable move toward the 7,000 mark. Analysis is by Terence Hove, Senior Financial Markets Strategist at Exness

SPX into Halloween
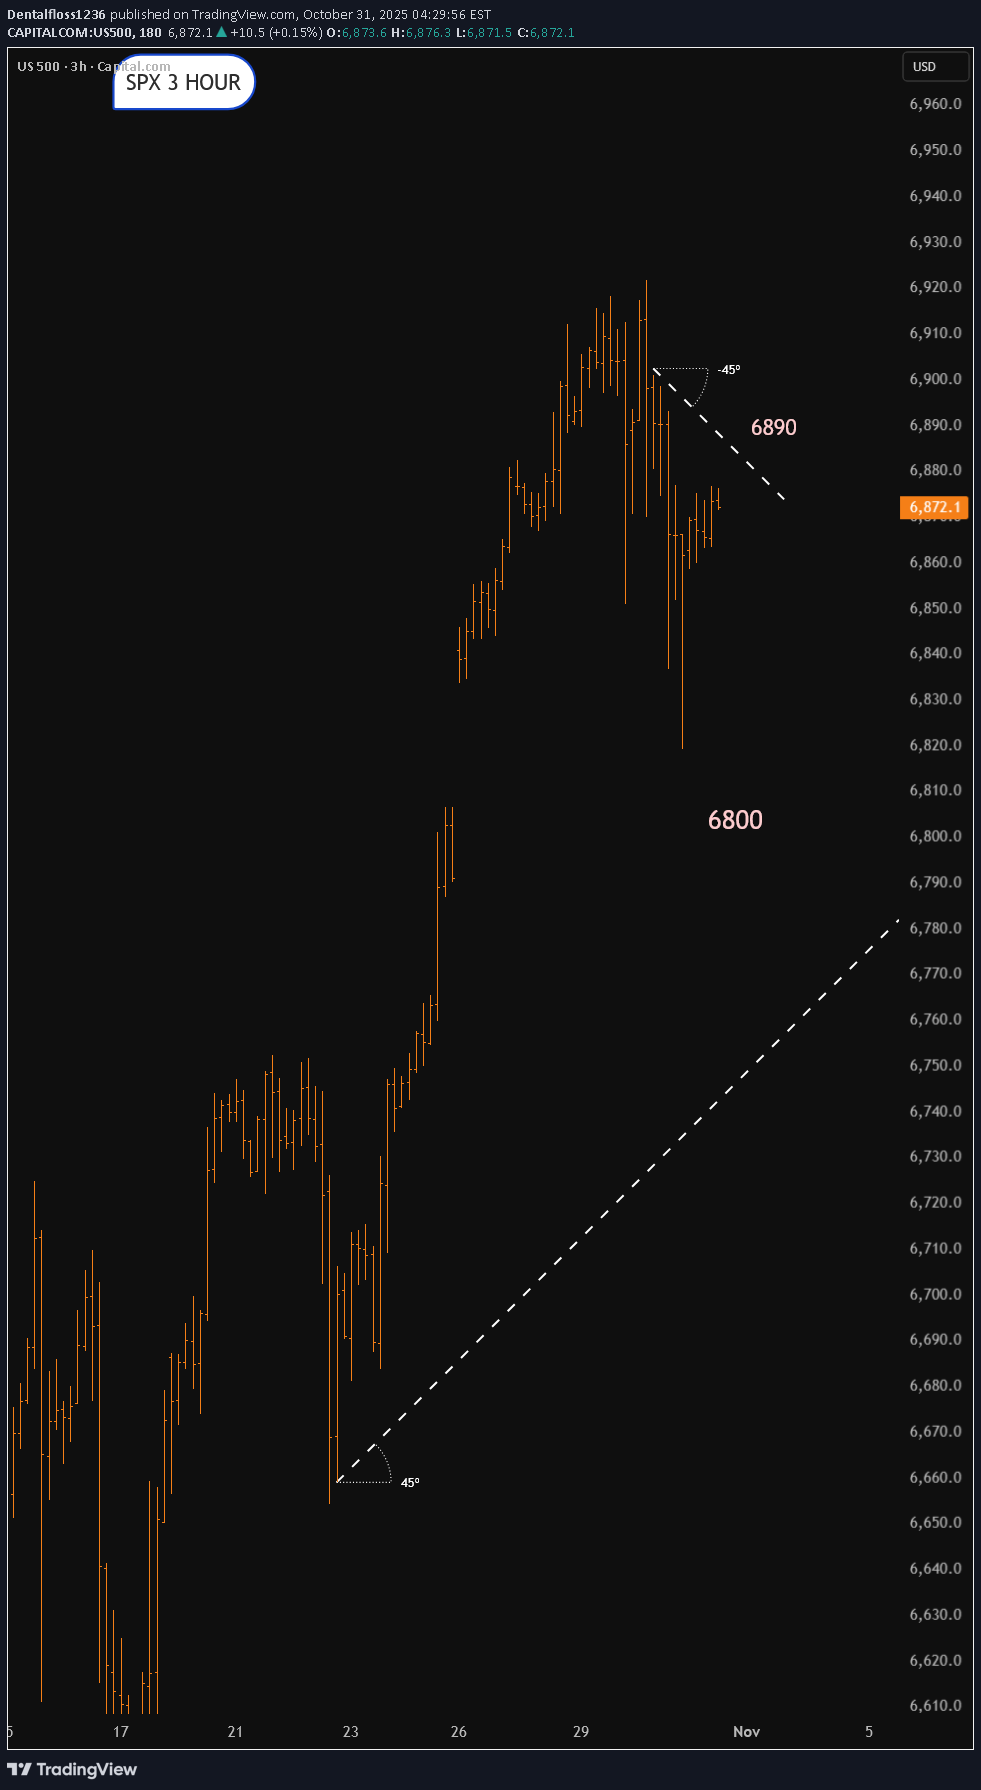
Possibly above 6890 may not be liked 6800 could get tested Lets see what happens
What Is CPI and Why It Matters Globally
Introduction: The Pulse of the Global Economy In the complex world of economics, few indicators hold as much influence and significance as the Consumer Price Index (CPI). Whether it’s a policymaker setting interest rates, an investor predicting market movements, or an ordinary consumer noticing rising grocery bills, CPI plays a role in everyone’s financial life. It acts as a mirror reflecting changes in the cost of living and inflation, shaping everything from global monetary policies to household budgets. Simply put, CPI measures how much prices have increased or decreased for a basket of goods and services that consumers typically buy. However, behind this simple concept lies a powerful tool that helps nations assess economic stability, business competitiveness, and the real purchasing power of their citizens. Understanding CPI: The Basics The Consumer Price Index (CPI) is an economic indicator that measures the average change in prices of a fixed basket of goods and services over time. This basket includes everyday items such as food, housing, clothing, healthcare, transportation, and education — essentially capturing the spending habits of urban consumers. CPI as a Measure of Inflation CPI is the most widely used tool to measure inflation — the general increase in prices and fall in the purchasing power of money. When CPI rises steadily, it indicates inflation; when it falls, it suggests deflation. Inflation can be both a sign of growth and a warning signal. Moderate inflation encourages spending and investment, as people prefer to buy now rather than later. But excessive inflation — as seen in countries like Argentina or Turkey in recent years — erodes savings, raises borrowing costs, and destabilizes economies. Conversely, deflation (a sustained drop in prices) might sound appealing but can trigger economic stagnation. Falling prices reduce business revenues and wages, discouraging spending and investment. Thus, tracking CPI helps governments strike a delicate balance between economic growth and price stability. Types of CPI Economists often use different versions of CPI to capture varied aspects of price changes: Headline CPI: This is the broadest measure, including all goods and services in the consumer basket. It reflects the overall inflation rate but can be volatile due to changes in food and energy prices. Core CPI: Excludes food and energy components, as they are prone to short-term fluctuations. Core CPI gives a clearer picture of long-term inflation trends. CPI-W and CPI-U (in the U.S.): CPI-W tracks the spending habits of urban wage earners and clerical workers. CPI-U includes all urban consumers and is considered the official measure of inflation. HICP (Harmonized Index of Consumer Prices): Used by the European Union, this version allows for consistent inflation comparisons across member states. Each variation of CPI serves a specific policy or analytical purpose, allowing economists to monitor inflation more accurately across different sectors and regions. CPI and Global Monetary Policy CPI plays a central role in shaping global monetary policy. Central banks like the Federal Reserve (U.S.), European Central Bank (ECB), Bank of England, and the Reserve Bank of India (RBI) rely on CPI trends to make key decisions about interest rates and money supply. When CPI shows rising inflation, central banks often raise interest rates to cool down spending and borrowing. When CPI indicates deflation or weak inflation, they lower rates to stimulate economic activity. For instance, during the COVID-19 pandemic, global CPI levels dropped as demand collapsed. Central banks responded with historically low interest rates and massive stimulus packages. However, post-pandemic supply chain disruptions and energy shortages sent CPI soaring globally — prompting rapid interest rate hikes in 2022–2023. These fluctuations show how closely CPI data influences global financial stability, currency values, and investment decisions. CPI and Purchasing Power CPI also helps determine changes in purchasing power — how much goods and services a unit of currency can buy. If wages rise slower than CPI, real income effectively decreases, meaning consumers can buy less with the same money. For example: If CPI rises by 6%, but wages increase by only 3%, then real wages have fallen by 3%. This erosion in purchasing power can reduce consumer confidence and spending — key drivers of economic growth. Governments and labor unions often use CPI data to adjust wages, pensions, and social benefits (a process called indexation) to maintain people’s living standards. CPI as a Global Benchmark CPI data is not just a domestic concern — it has international ramifications. Global investors, financial institutions, and multinational corporations all monitor CPI across different countries to assess economic health and currency risks. Here’s how: Exchange Rates: High inflation (rising CPI) typically weakens a nation’s currency because it erodes purchasing power. Investors may move money to countries with lower inflation and higher returns, affecting foreign exchange markets. Investment Flows: CPI trends help guide foreign direct investment (FDI) and portfolio investment decisions. For instance, a stable CPI and moderate inflation attract investors seeking predictable returns. Trade Competitiveness: Countries with lower inflation maintain price stability in exports, making their goods more competitive globally. Conversely, high CPI growth can make exports expensive and hurt trade balances. Thus, CPI serves as a universal barometer for comparing economic conditions across nations. CPI and the Financial Markets The stock market, bond market, and commodity markets react strongly to CPI reports. Traders and investors treat CPI announcements as key economic events because they directly influence interest rate expectations and corporate profitability. Equity Markets: Rising CPI may hurt company profits by increasing input costs. However, certain sectors — like energy, commodities, and consumer staples — often benefit during inflationary periods. Bond Markets: Bonds are highly sensitive to inflation. When CPI rises, bond yields increase because investors demand higher returns to offset the loss of purchasing power. This inversely affects bond prices. Commodity Markets: Commodities such as gold and crude oil often act as inflation hedges. A high CPI can push investors toward tangible assets that retain value when currencies lose purchasing power. Thus, CPI data can trigger short-term volatility and long-term investment strategy shifts across asset classes. Limitations of CPI While CPI is an essential tool, it’s not without flaws. Economists often debate its accuracy and representativeness due to several factors: Substitution Bias: Consumers tend to switch to cheaper alternatives when prices rise, but CPI assumes a fixed basket — overstating inflation. Quality Adjustments: Technological improvements often increase product quality (e.g., smartphones), but CPI may not fully capture this added value. Geographical Variations: Price changes differ between regions. Urban CPI may not accurately reflect rural cost-of-living changes. Lagging Indicator: CPI measures inflation after it has occurred, meaning policymakers are often reacting to past data. Exclusion of Certain Costs: CPI may exclude investment assets like real estate or stocks, even though they significantly affect household wealth. Despite these limitations, CPI remains the most reliable and widely accepted inflation measure because of its consistency and comparability. Case Studies: CPI in Action 1. United States: Inflation and Federal Reserve Policy In 2022, U.S. CPI surged above 9%, the highest in four decades. Rising food, fuel, and housing costs prompted the Federal Reserve to raise interest rates aggressively throughout 2022–2023. This decision cooled inflation but also slowed economic growth and rattled stock markets. It showcased how CPI data can reshape monetary strategy and ripple through global markets. 2. India: Balancing Growth and Inflation India’s CPI basket is heavily weighted toward food and housing. When food prices rise due to poor monsoon or supply shortages, CPI spikes quickly. The RBI uses CPI as its main inflation target, aiming to keep it between 2–6%. By adjusting repo rates based on CPI trends, the RBI manages both growth and price stability. 3. Eurozone: The Battle with Deflation and Energy Prices For years, the Eurozone struggled with low inflation and deflation risks, prompting the ECB to maintain ultra-low interest rates. However, after the Ukraine conflict in 2022, energy-driven CPI spikes forced the ECB to tighten policy sharply. This swing illustrated CPI’s impact on regional economic integration and fiscal coordination. CPI in the Context of Global Challenges Today’s world faces unprecedented inflationary pressures due to factors like: Geopolitical conflicts (e.g., Russia–Ukraine) Supply chain disruptions Energy market volatility Climate change impacting agriculture Post-pandemic demand surges As a result, global CPI data has become a critical early warning system for potential recessions, stagflation, or monetary tightening cycles. International institutions such as the IMF and World Bank rely on CPI trends to forecast global growth and recommend policy adjustments. Future of CPI: Adapting to a Changing Economy As consumption habits evolve, CPI calculations must also adapt. The rise of digital goods, subscription services, and AI-driven economies is reshaping how statisticians define the “consumer basket.” Future CPI methodologies may include: Real-time price tracking using big data and AI Regional CPI dashboards for urban and rural contrasts Inclusion of environmental costs and green inflation (the impact of climate policies on prices) Better adjustments for technological improvements Such innovations will make CPI a more accurate, dynamic, and inclusive measure of global inflation. Conclusion: The Global Significance of CPI The Consumer Price Index is more than just a number; it is the heartbeat of the world economy. It influences how central banks set interest rates, how investors allocate capital, how governments plan budgets, and how families manage their daily expenses. Understanding CPI is crucial not only for economists but for anyone navigating an interconnected global economy. Whether inflation is surging or stabilizing, CPI tells the story of how value, consumption, and confidence move together in shaping our economic future. In a world of shifting trade patterns, volatile energy markets, and evolving digital economies, CPI remains the compass that helps policymakers, businesses, and citizens alike find direction amid economic uncertainty.
Trade Nation
S&P500 Earnings to drive market volatility
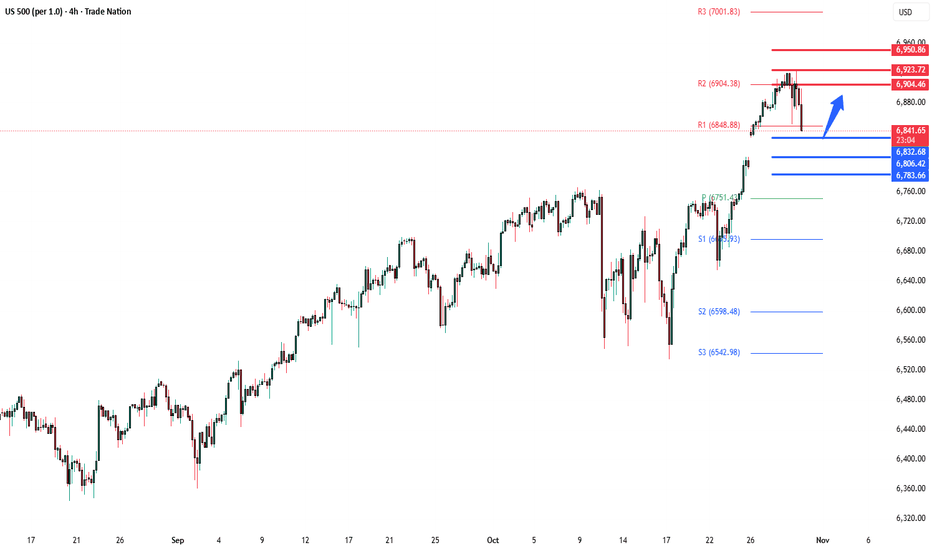
The S&P 500 closed flat (-0.004%) as Powell tempered expectations for another Fed rate cut in December, while upbeat Trump–Xi trade talks and Nvidia’s milestone $5trn valuation buoyed sentiment. Yields spiked (+10.1bps on 10yr Treasuries) as the BoJ held steady and tech gains drove the NASDAQ (+0.55%) and Mag-7 (+1.03%) to new highs. US equity futures are modestly higher ahead of today’s key events — Apple and Amazon earnings, which will steer Nasdaq direction, and the ECB’s policy decision, where rates are expected to remain unchanged at 2%. Broader attention will also be on results from Eli Lilly, Merck, and Gilead in pharma, alongside major releases in energy and industrials. Key Support and Resistance Levels Resistance Level 1: 6904 Resistance Level 2: 6923 Resistance Level 3: 6950 Support Level 1: 6832 Support Level 2: 6806 Support Level 3: 6783 This communication is for informational purposes only and should not be viewed as any form of recommendation as to a particular course of action or as investment advice. It is not intended as an offer or solicitation for the purchase or sale of any financial instrument or as an official confirmation of any transaction. Opinions, estimates and assumptions expressed herein are made as of the date of this communication and are subject to change without notice. This communication has been prepared based upon information, including market prices, data and other information, believed to be reliable; however, Trade Nation does not warrant its completeness or accuracy. All market prices and market data contained in or attached to this communication are indicative and subject to change without notice.
Disclaimer
Any content and materials included in Finbeet's website and official communication channels are a compilation of personal opinions and analyses and are not binding. They do not constitute any recommendation for buying, selling, entering or exiting the stock market and cryptocurrency market. Also, all news and analyses included in the website and channels are merely republished information from official and unofficial domestic and foreign sources, and it is obvious that users of the said content are responsible for following up and ensuring the authenticity and accuracy of the materials. Therefore, while disclaiming responsibility, it is declared that the responsibility for any decision-making, action, and potential profit and loss in the capital market and cryptocurrency market lies with the trader.