
Yurino86
@t_Yurino86

What symbols does the trader recommend buying?
Purchase History
Trader Messages
Filter
Message Type
XAUUSD: Gold is going to hit $5,000 USD.
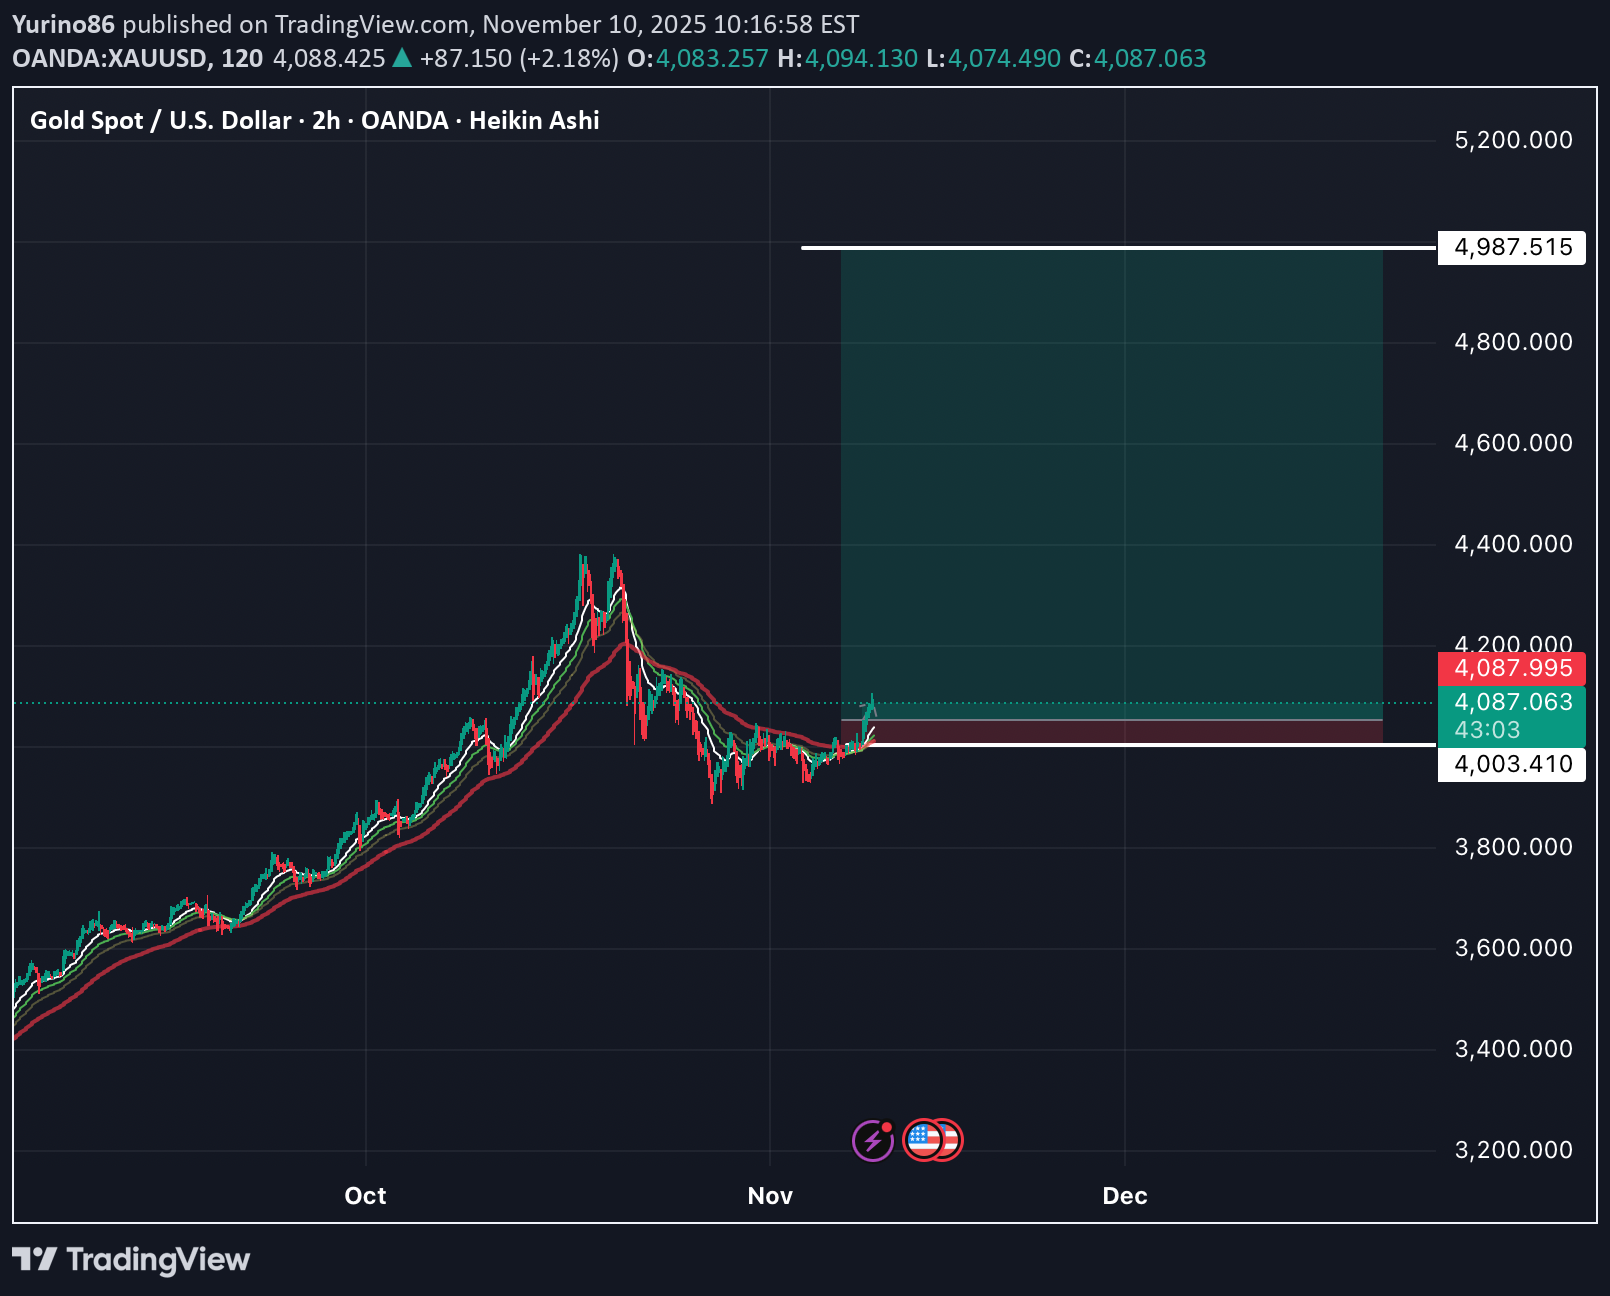
1. Uptrend Confirmation: • After a period of correction/sideways movement (from around mid-October to early November), the recent Heikin Ashi candles have started turning green/bullish (corresponding to the dark green color in your target zone). • The green candle bodies are lengthening and have short or non-existent lower wicks, which is a classic sign of a strong and sustainable uptrend on a Heikin Ashi chart. 2. Short-term Resistance Breakout: • The current price ($4,087.880) has broken above the previous short-term resistance area (the red line and the price zone around $4,003.410 - $4,091.265), and is above the moving averages (EMAs - the thin red and green lines), indicating that buying pressure has taken control. 3. Buy Trade Setup (Long Position): • The chart shows a BUY trade setup with an entry price within the $4,091.265 region. • Take Profit (TP) Target: Set at a very high level, $4,987.515. This implies an extremely strong expectation for price appreciation, possibly based on extended analysis (Fibonacci Extension) or large institutional price forecasts. • Stop Loss (SL) Level: Set at $4,003.410, just below the old support/resistance zone, demonstrating clear risk control.
BUY TEZOS NOWW
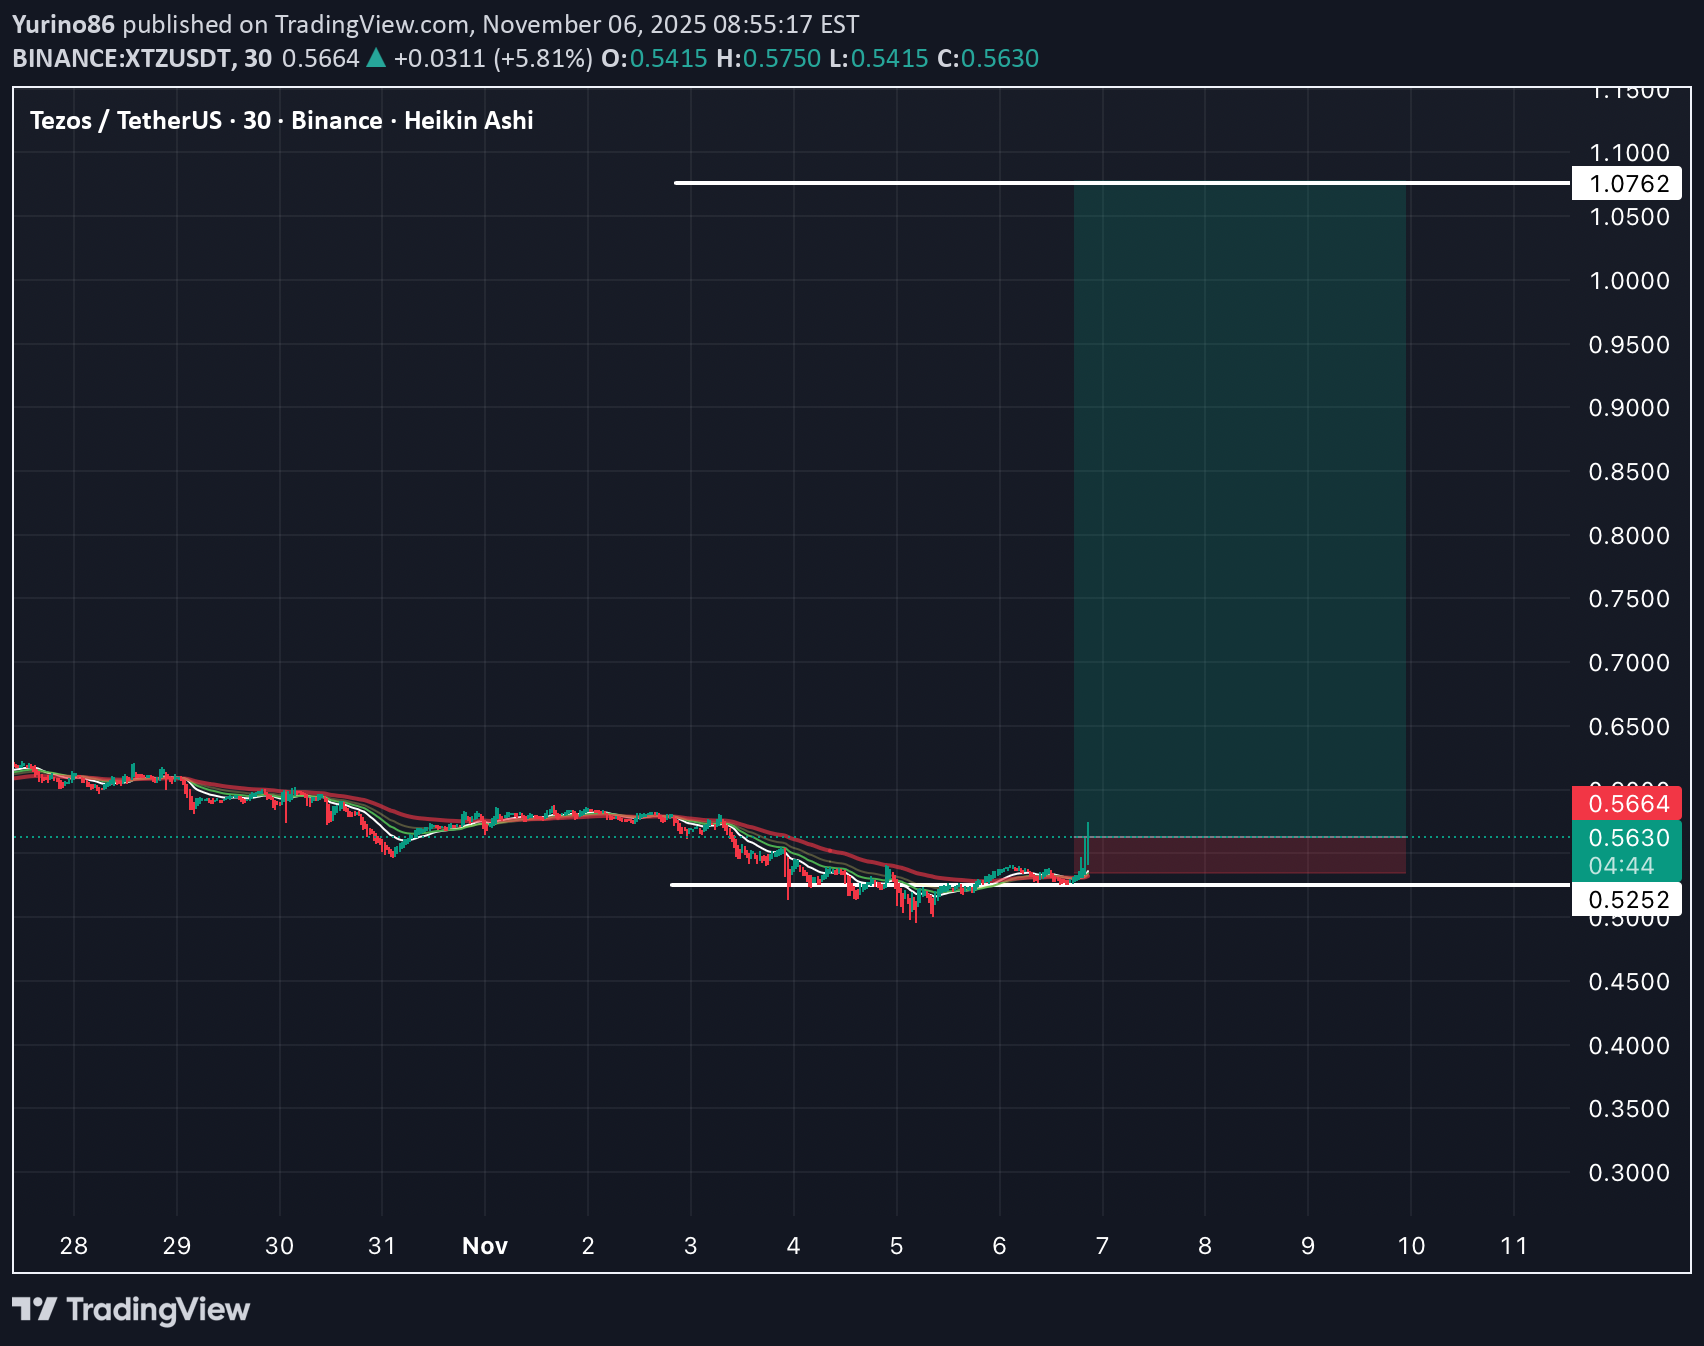
Based on the XTZ/USDT 30-minute chart using Heikin Ashi candles: • Current Price: The price is around $0.5636 (as of 20:49 on November 06, 2025). • Support Zone: The chart shows a strong support area around $0.5252. The price has touched and held firm above this level in recent days, showing consolidation in this region, which indicates buying pressure is starting to emerge and preventing the price from dropping lower. • Trade Setup: • Entry: Currently around the market price, approximately $0.5636. • Stop Loss: Placed below the nearest support zone, around $0.5252 (or slightly lower to avoid wick-hunts). • Take Profit: A relatively distant target, around $1.0762 (based on the peak level drawn on the chart). • Candlestick Signal: Using Heikin Ashi candles, small green candles are starting to appear after a period of red accumulation, which is an early sign of a reversal or at least an impending upward move. • Risk/Reward Ratio (R:R): With Risk: $0.5636 - $0.5252 = $0.0384 and Reward: $1.0762 - $0.5636 = $0.5126. The R:R ratio is $0.5126 / $0.0384 \approx 13.3:1. This is an extremely attractive ratio, suggesting that a successful trade could yield massive profits relative to the risk.
Disclaimer
Any content and materials included in Finbeet's website and official communication channels are a compilation of personal opinions and analyses and are not binding. They do not constitute any recommendation for buying, selling, entering or exiting the stock market and cryptocurrency market. Also, all news and analyses included in the website and channels are merely republished information from official and unofficial domestic and foreign sources, and it is obvious that users of the said content are responsible for following up and ensuring the authenticity and accuracy of the materials. Therefore, while disclaiming responsibility, it is declared that the responsibility for any decision-making, action, and potential profit and loss in the capital market and cryptocurrency market lies with the trader.