
davidjulien369
@t_davidjulien369

What symbols does the trader recommend buying?
Purchase History
Trader Messages
Filter
Message Type
davidjulien369
Long trade
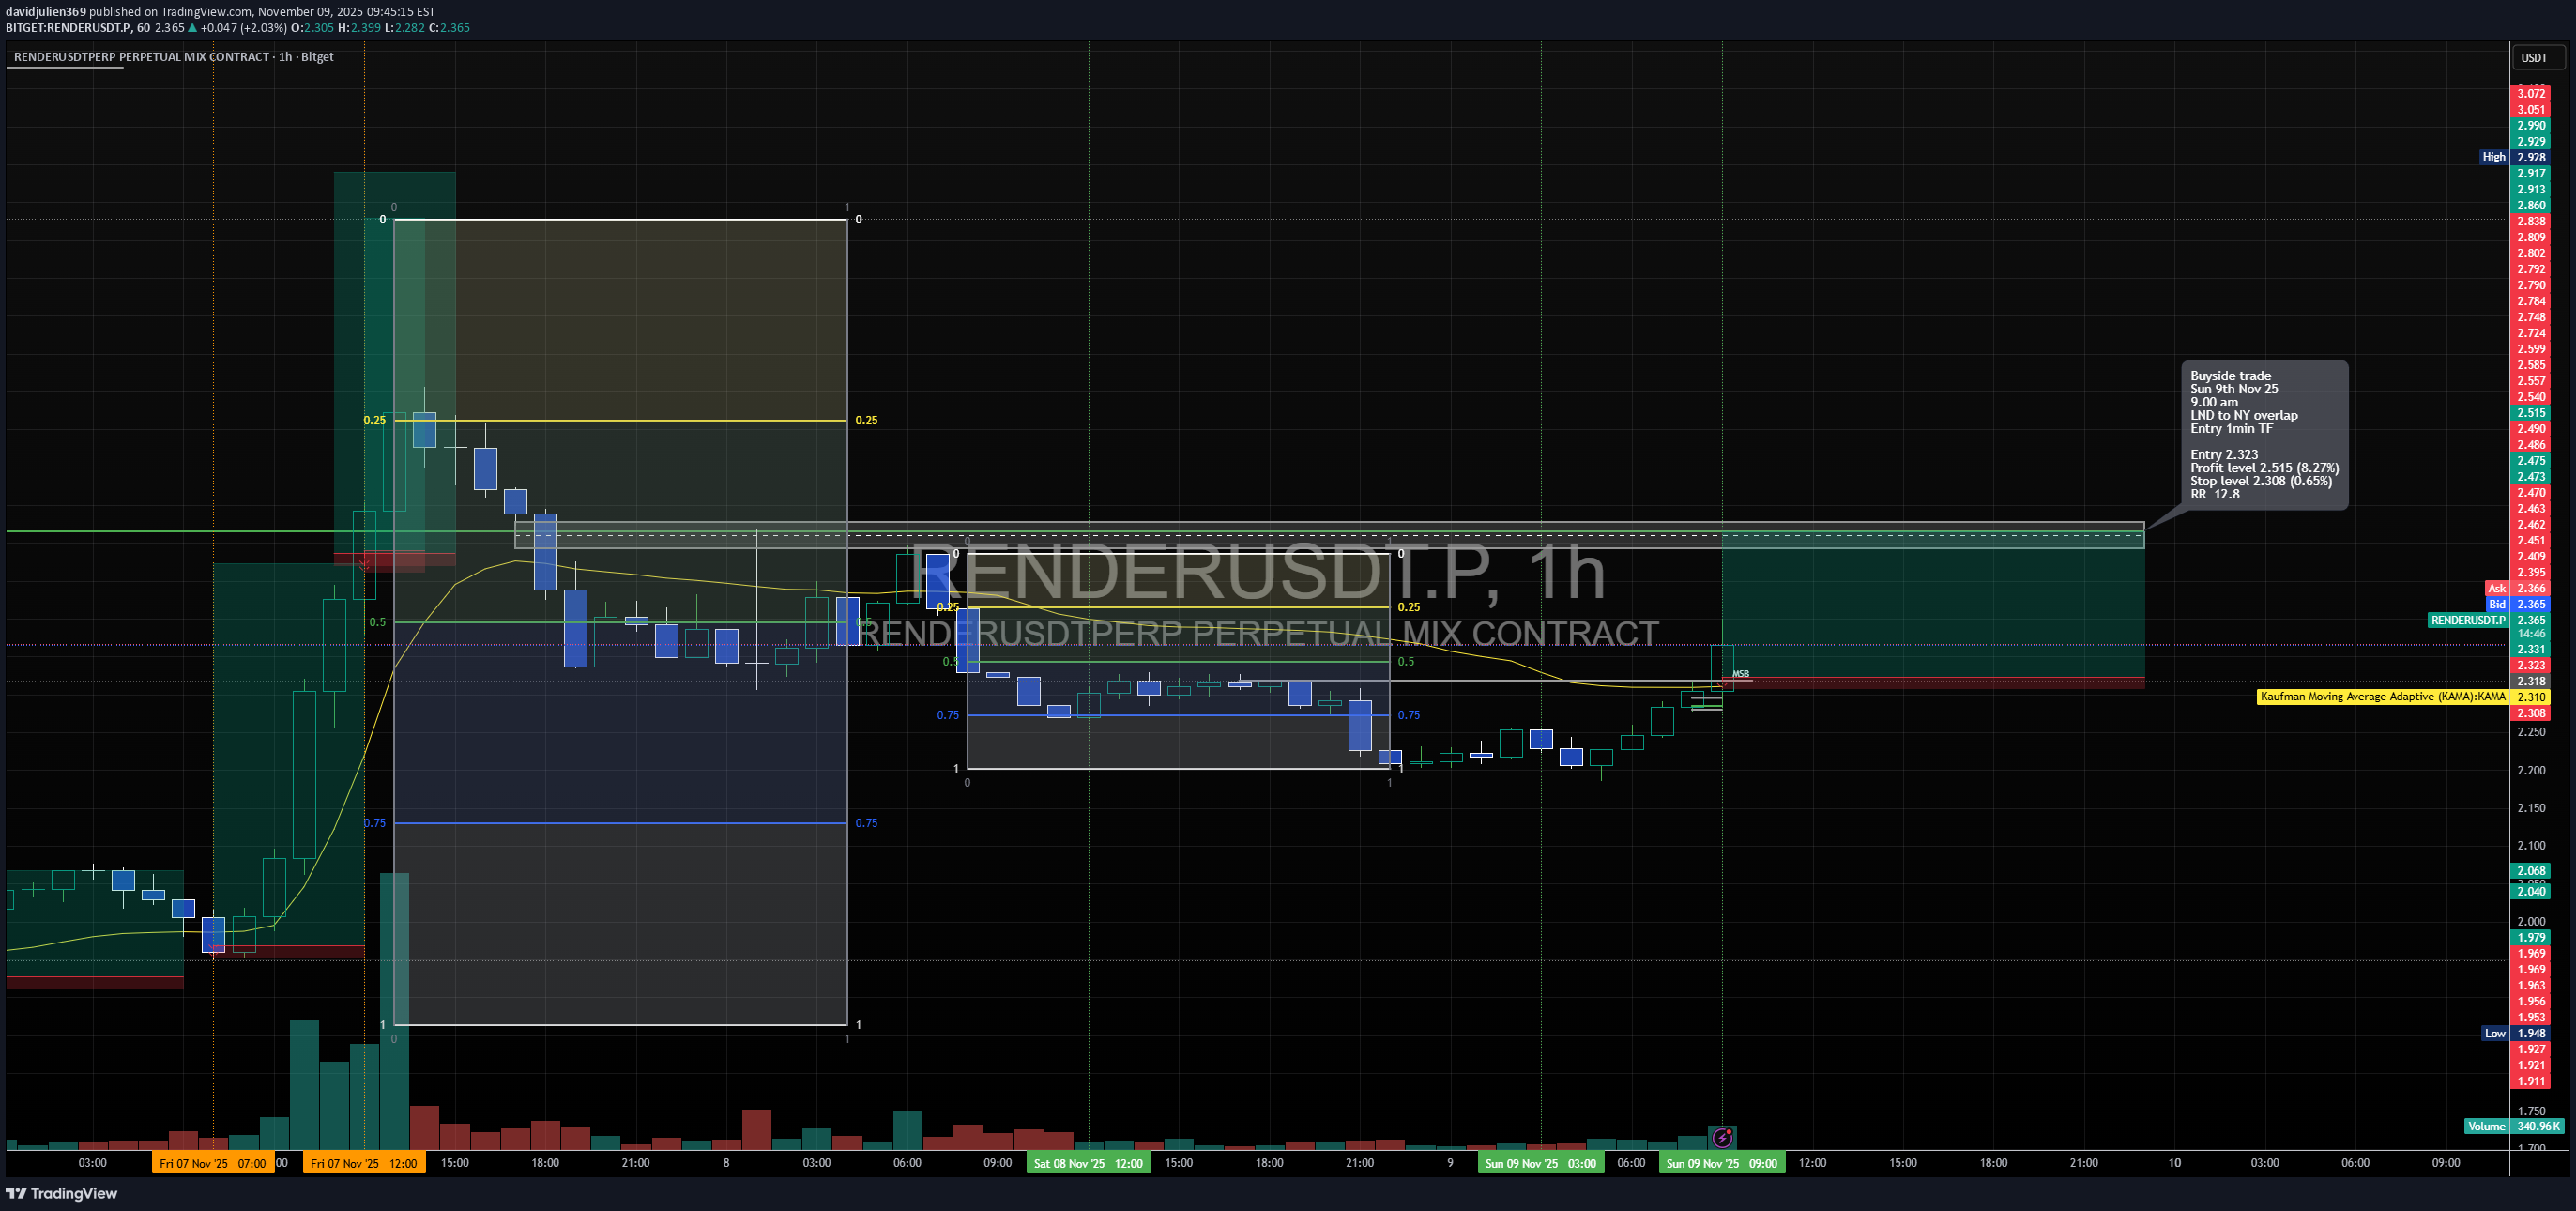
1Ht TF overview 📘 Trade Journal Entry Pair: RENDERUSDT.P Date: Sun 9 Nov 2025 Session: London → New York Overlap Direction: Buy-side Trade Timeframe: 1 Hour (Entry refined on 1-min TF) 🔹 Trade Details Entry: 2.323 Take Profit (TP): 2.515 (+8.27 %) Stop Loss (SL): 2.308 (–0.65 %) Risk / Reward (RR): 12.8 R 🔹 Market Context 🧾Following an aggressive markup leg on Nov 7, the price entered a retracement phase that mitigated the previous bullish FVG. 🧾The discount region (0.75 Fib) aligned with the KAMA dynamic support (≈ 2.31), forming a low-risk accumulation zone. 🧾Volume contraction and the formation of a mini-range indicated absorption of residual supply. 🧾Break above micro-breaker (2.33) confirmed a structural CHOCH on the lower TF, setting up a potential continuation toward 2.51 liquidity. 🔹 Model Type Re-accumulation → Breaker Block → Continuation Model A corrective decline retraced into prior OB support; bulls defended it. Entry executed on confirmation of bullish displacement through intraday structure. Target aims for upper inefficiency fill near 2.50–2.52 range, aligning with HTF imbalance. 1min Tf overview 📈 Execution Notes Entry triggered immediately after bullish MSB on 1-min TF. SL is placed below reactive OB at 2.308 to maintain tight risk. TP is positioned just under the premium Fib extension, (0.25 zone ≈ 2.515) to secure profits before the major liquidity pool. Volume signature: buying pressure returned with a mid-range engulfing candle — institutional buying confirmed. 🔹 Trade Narrative This RENDER setup highlights a refined continuation entry within a developing bullish expansion. After the Nov 7 impulse, market structure rotated into a controlled pullback; the reaction from the discount zone confirmed the re-accumulation phase. The buyside trade leverages momentum alignment on KAMA and volume acceleration during session overlap, projecting a measured move toward 2.5 premium liquidity for an approximate 12 R return. 5min TF (Sweep/trigger/model 010)Stop level moved (5.55%)
davidjulien369
Long trade
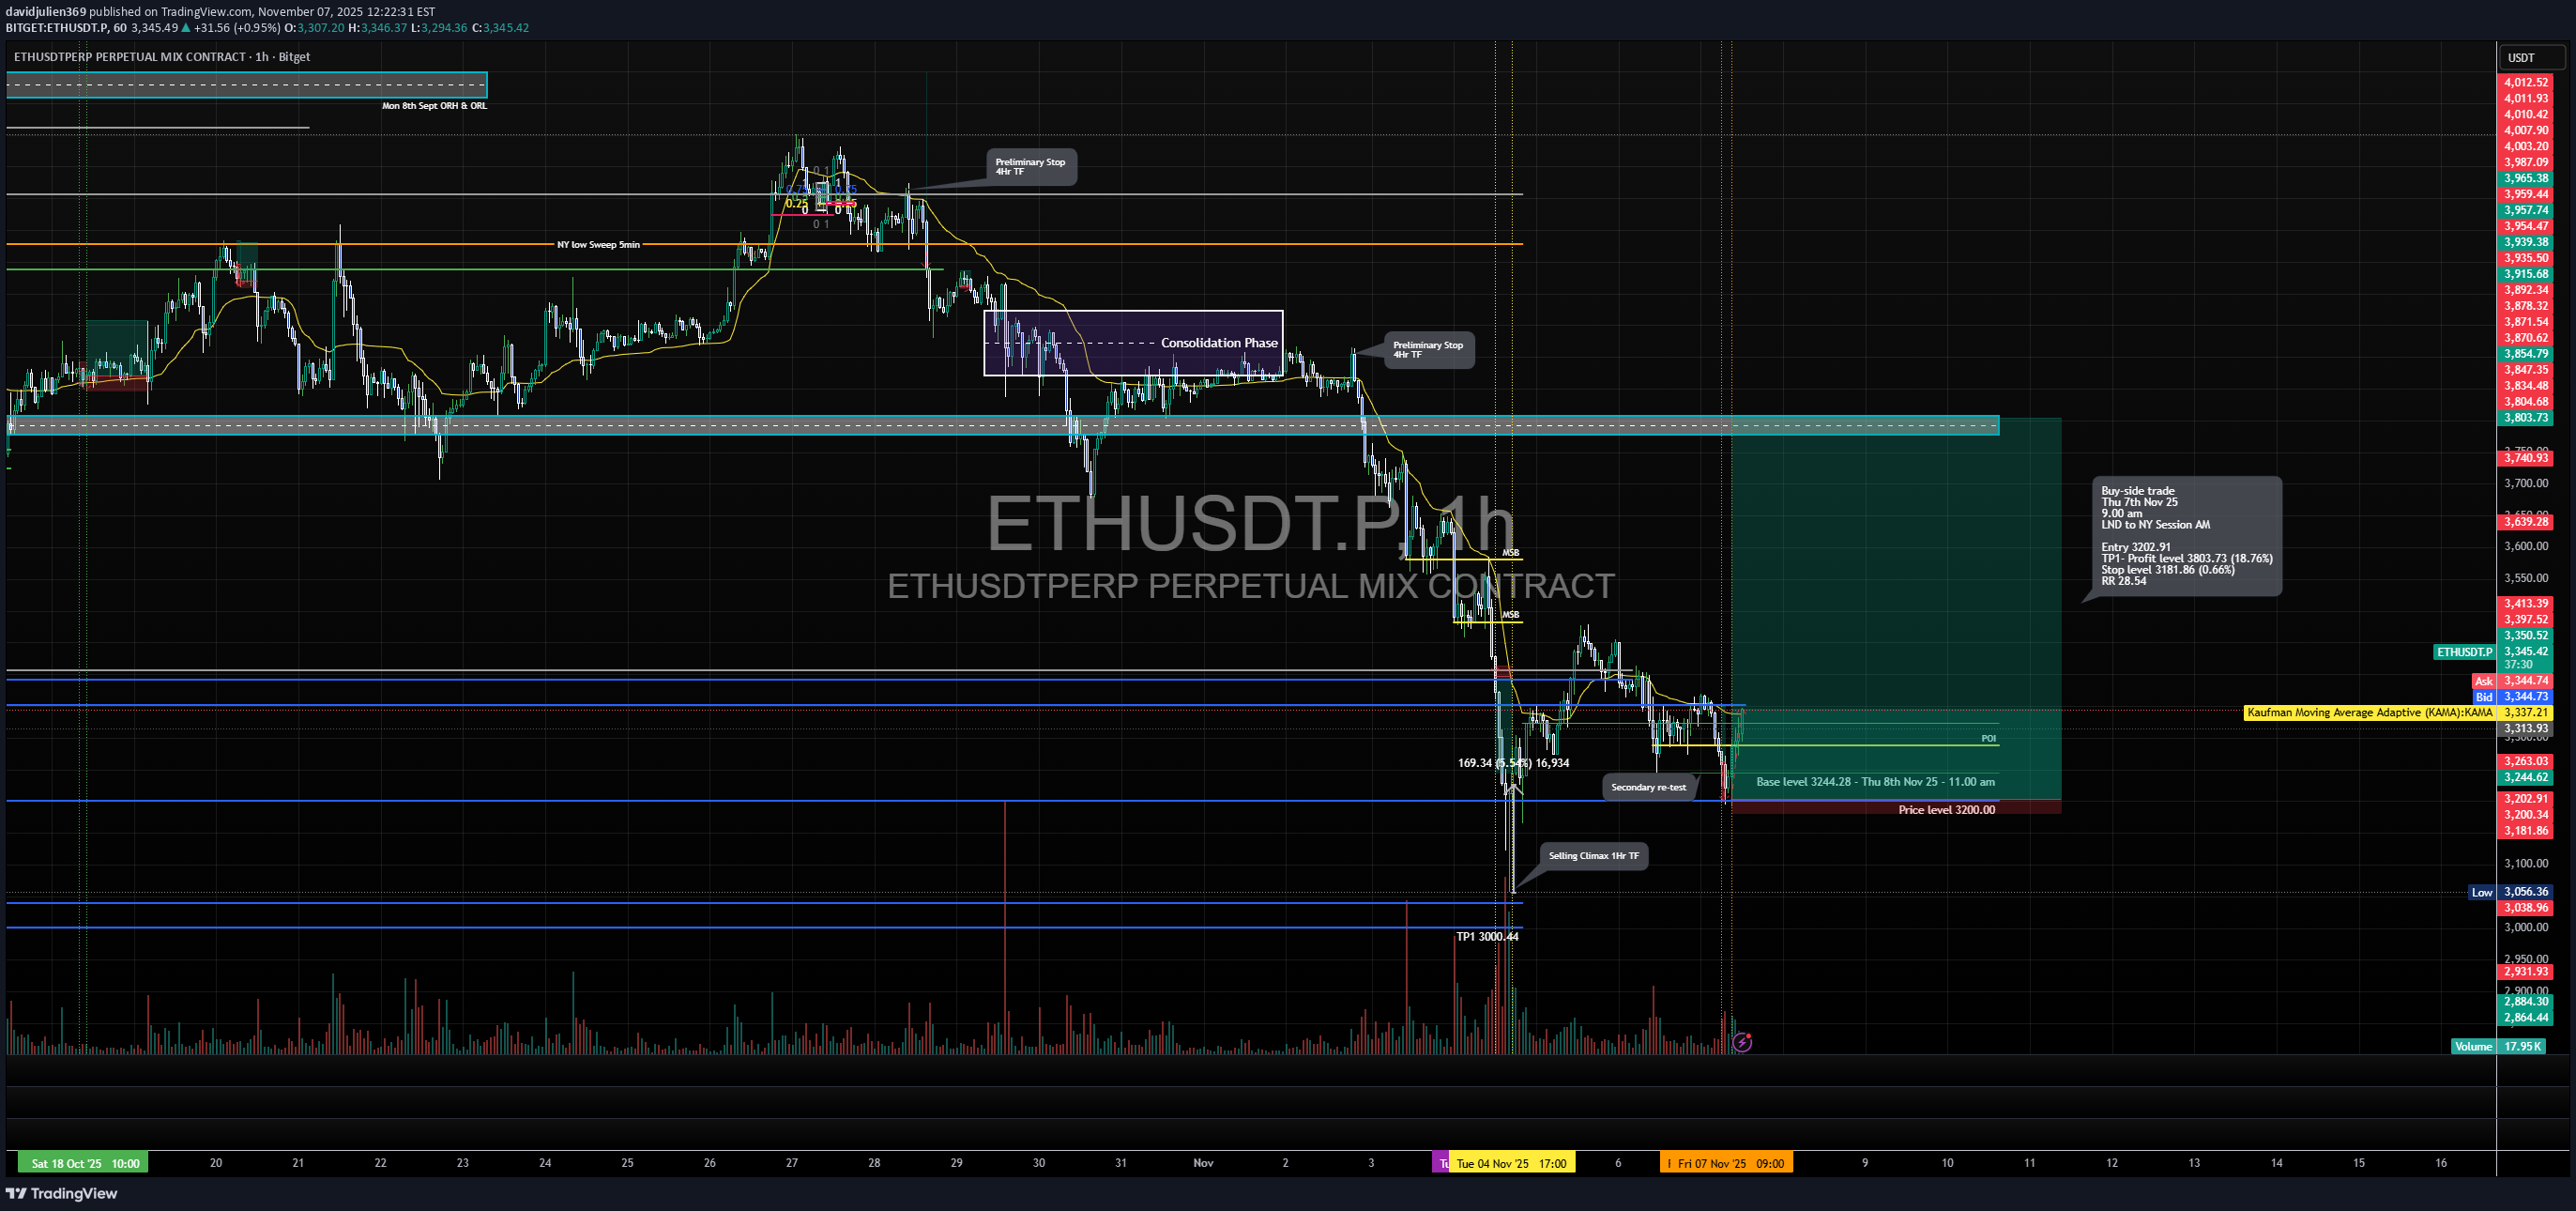
📘 Trade Journal Entry Pair: ETHUSDT.P Date: Thu 7 Nov 2025 Session: London → New York AM Direction: Buy-side Trade Timeframe: 1 Hour 🔹 Trade Details Entry: 3202.91 Take Profit (TP): 3803.73 (+18.76 %) Stop Loss (SL): 3181.80 (–0.64 %) Risk / Reward (RR): 28.54 R 🔹 Market Context The structure shows a clear Selling Climax with heavy volume expansion, signalling the potential completion of the markdown leg. 🧾A Secondary Re-test at the 3200 base level confirms buyer absorption and shift in short-term order flow. 🧾The Consolidation Phase and Preliminary Stop above mark prior distribution range now serving as the target zone (premium liquidity pool). 🧾KAMA (MA) flattening suggests a transition from distribution to accumulation. 🧾Price defended the POI (Point of Interest) at ≈ approximately 3244, forming higher lows in the intraday structure — confirmation of buyside intent. 1Hr TF 🔹 Model Type Accumulation → Re-accumulation → Continuation Model 🧾The setup follows a textbook Wyckoff Accumulation: Selling Climax → Automatic Rally → Secondary Test → Spring → Markup. 🧾The Spring formed via liquidity sweep below 3200, reclaiming structure with strong close and volume support. 🔹 Execution Notes Entry refined at re-test of the spring low on volume tapering (sign of absorption). Risk confined below the Selling Climax wick. Target placed at prior consolidation premium zone (≈ 3.8 k) aligning with inefficiency fill. Volume profile and session timing support entry during London–New York overlap, consistent with institutional execution windows. 🔹 Trade Narrative This ETHUSDT setup captures a phase-transition shift from markdown into early markup. After the Selling Climax, the market re-tested structural demand at 3200 — confirming buyer presence. The confluence of liquidity sweep, volume divergence, and EMA / KAMA flattening provides a strong foundation for a buyside reversal. 🧩The trade aims to ride the short-term expansion leg toward the higher-timeframe premium zone, capturing displaced liquidity left by prior distribution. A clean break and close above 3.4 k would further confirm continuation toward the 3.8 k objective.Price observed Mon 10th Nov 25 (3.00 am NY time) Stop level moved (9.30%)
davidjulien369
Short trade
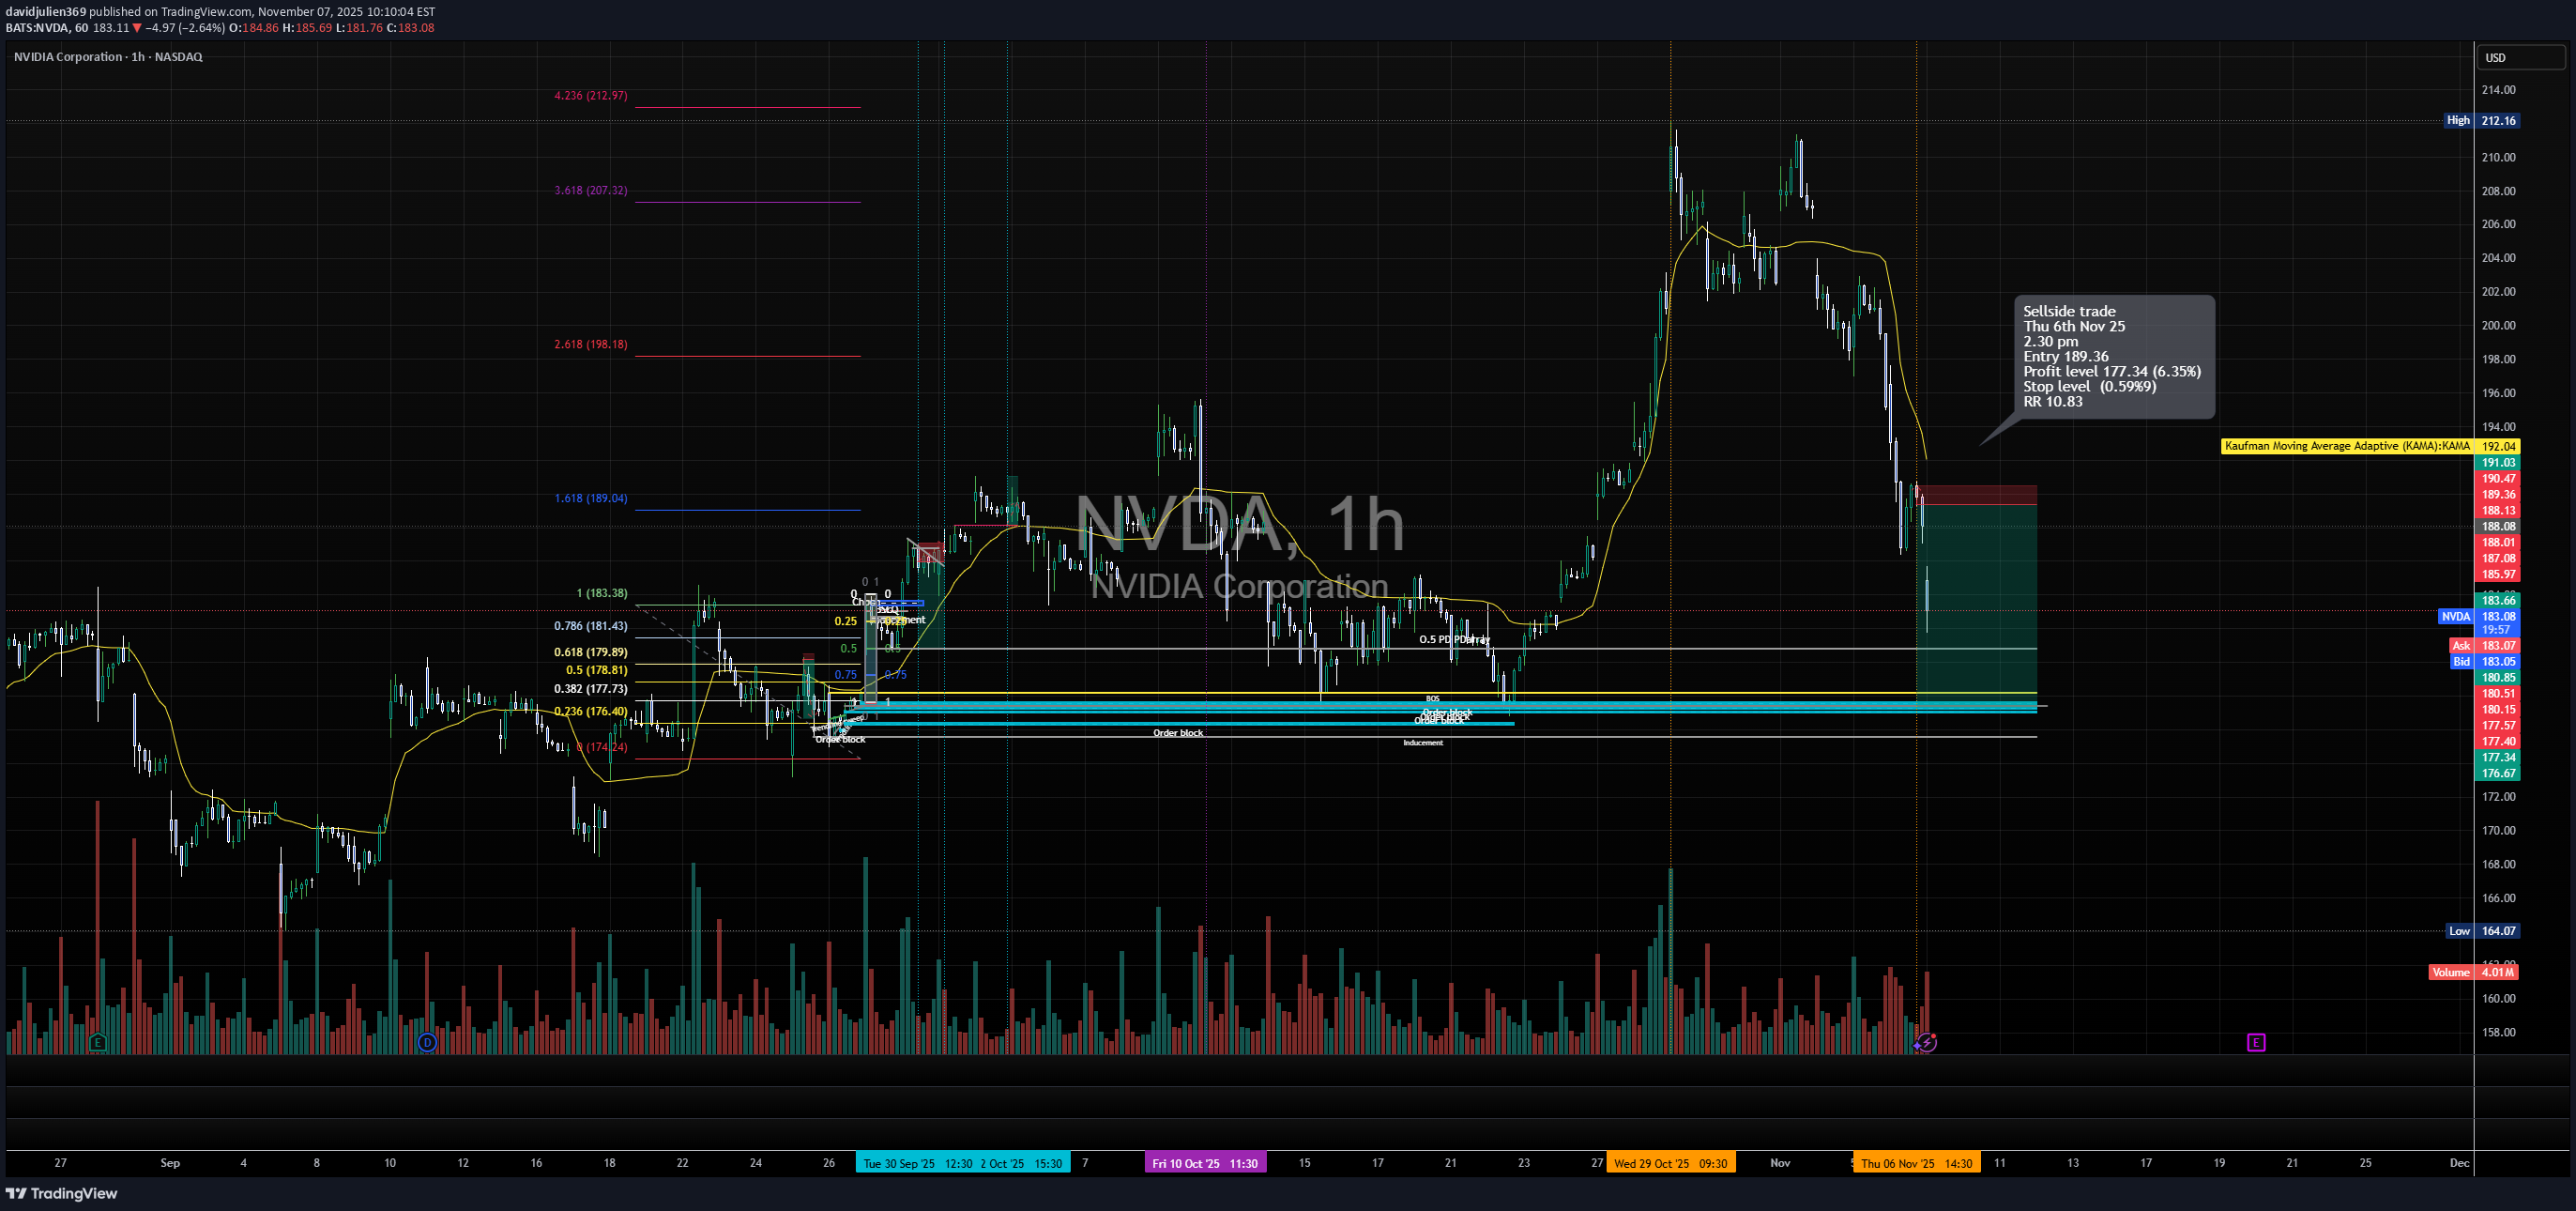
📘 Trade Summary Pair: NVDA (NASDAQ) Direction: Sell-side Trade Date: Thu 6 Nov 25 Time: 2:30 pm Entry: 189.36 Profit Level: 177.34 (+6.35%) Stop Level: 189.99 (–0.59%) Risk-Reward (RR): 10.83 🧩 Technical Context Price Structure: Market rejected near the previous swing high (~$197–$200 region) after failing to sustain above the 1.618 extension level. Fibonacci Context: Retracement zones from 0.382 – 0.786 aligned with prior accumulation zones, showing resistance at 0.618 (≈ 179.89) and 0.786 (≈ 181.43). Order Block Alignment: Two visible order blocks (highlighted in blue) show prior demand zones — price is expected to retrace into these for potential take-profit liquidity. Volume Spike: Noticeable volume at the rejection candle near $190–$191 indicates institutional sell orders stepping in. EMA Context: Price fell below the Kaufman Adaptive Moving Average (KAMA), confirming a short-term shift to bearish momentum. 🧠 Trade Narrative This short setup capitalises on: A failed breakout at the prior liquidity high (~$197), Break of structure (BOS) confirming downside shift, and Entry at the retest of a supply zone near $189. Targeting liquidity sweep of prior accumulation zone around $177, where confluence with the lower order block exists.Stop level moved (3.34%)
davidjulien369
Short trade
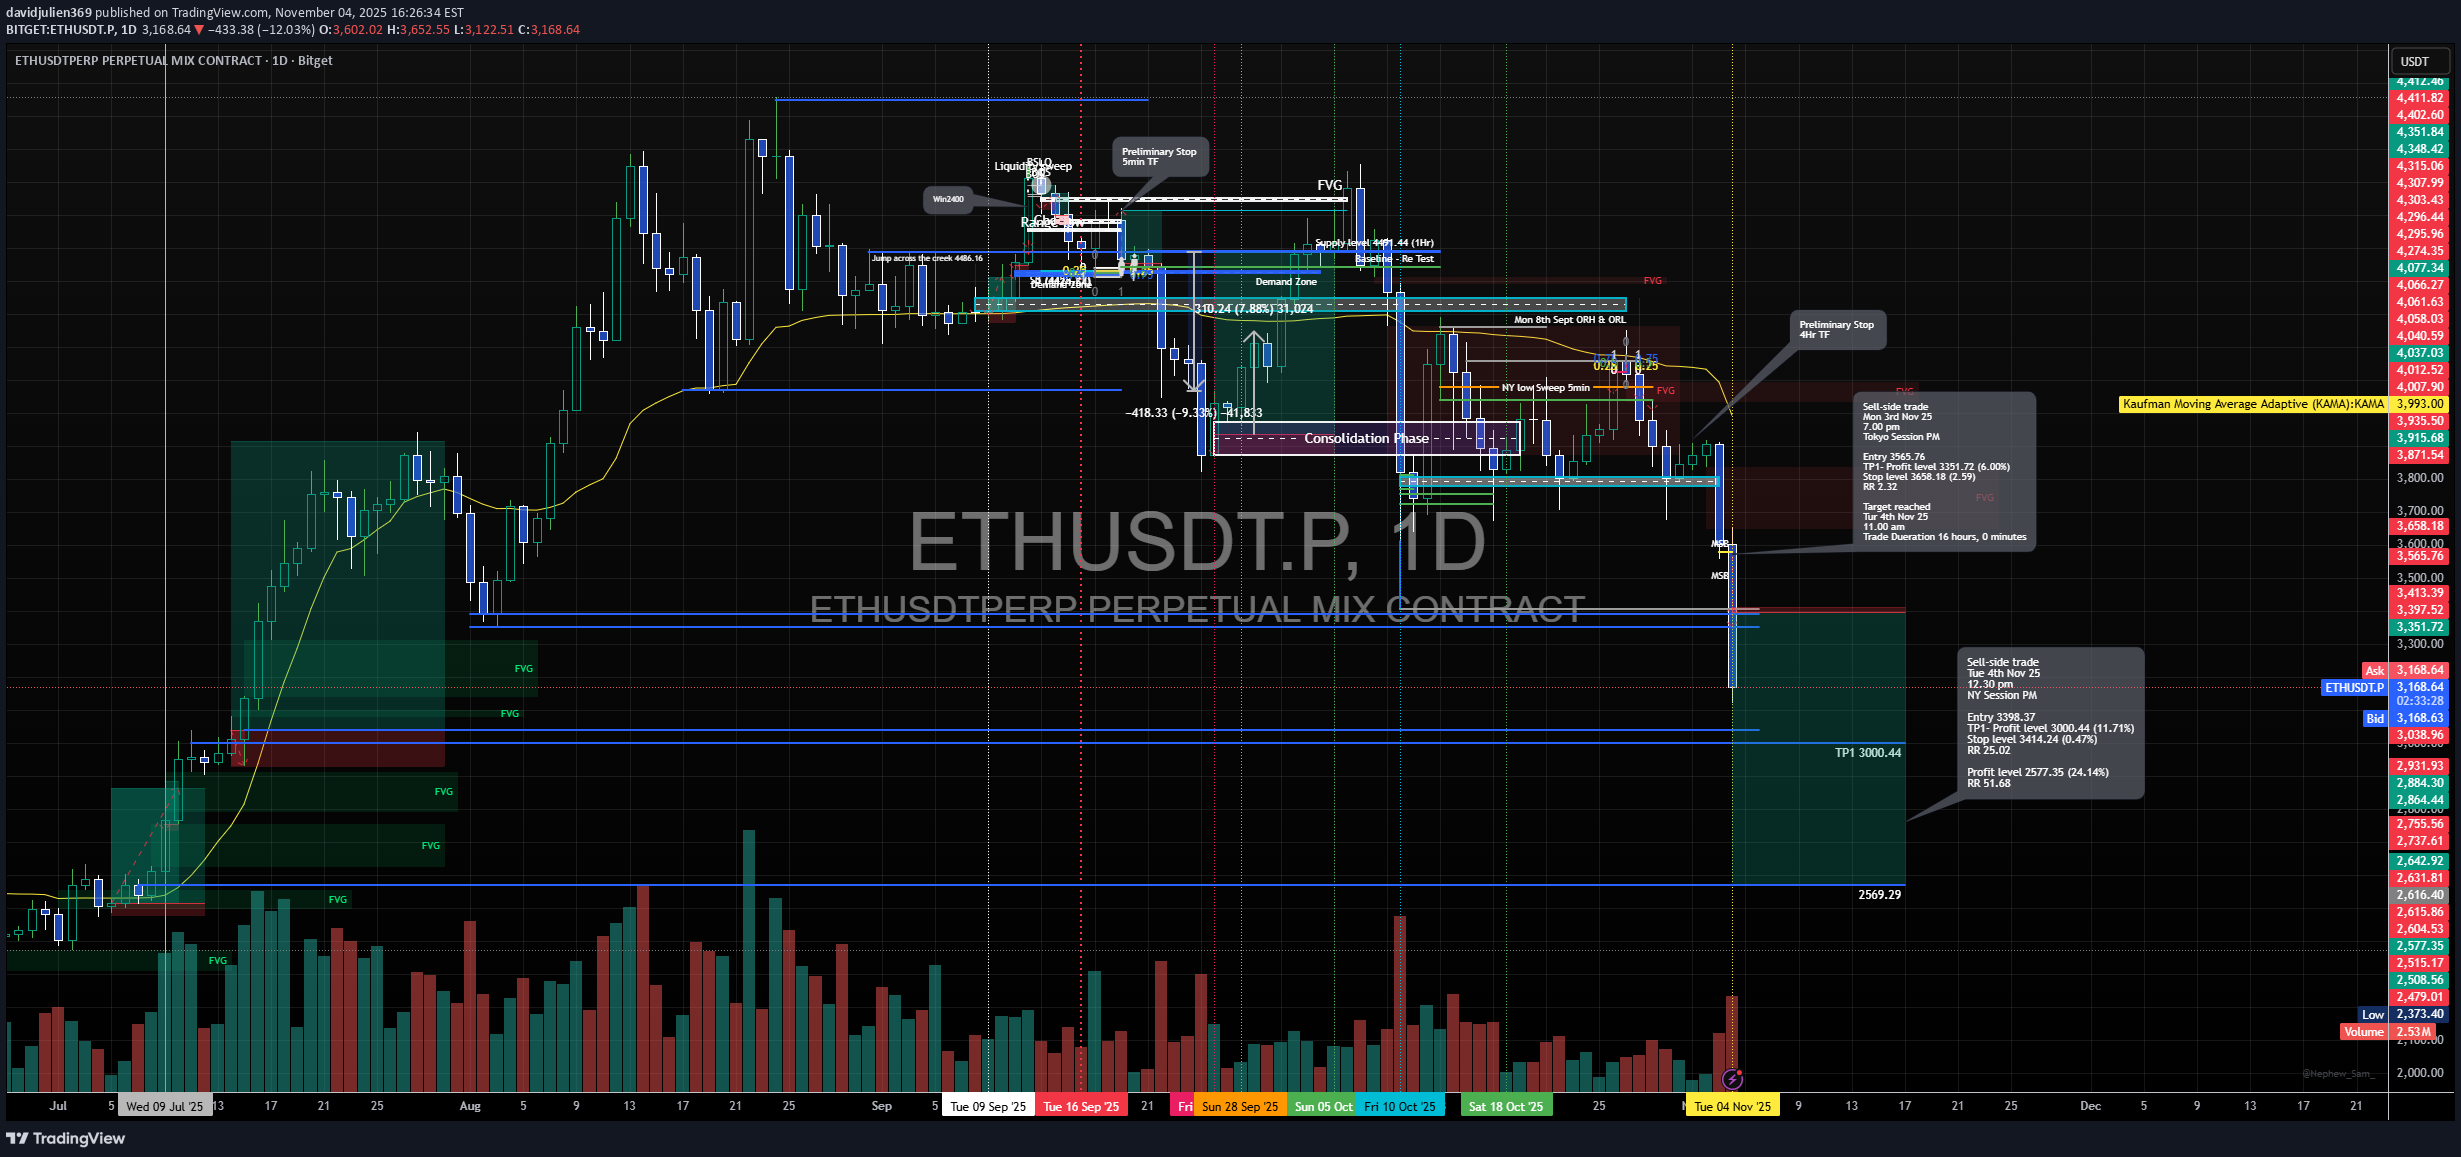
Day TF overview 📘 Trade Journal Entry Pair: ETHUSDT.P Direction: Sell-Side Trade Date: Tue 4 Nov 25 Time: 12:40 pm Session: NY Session PM Timeframe: 1 Day 🔹 Trade Details Metric Value Entry 3,983.39 Profit Level (TP) 3,000.44 (+11.71 %) Stop Level (SL) 4,141.42 (–4.7 %) Risk–Reward (RR) 1:8.68 Projected Target (Extended) 2,577.25 (–34.14 %) 🔸 Technical Context Market Structure: ETHUSDT has completed a Preliminary Supply → Buying Climax → UTAD sequence indicative of Wyckoff Distribution Phase C–D. Price has broken below the Change of Character (CHOCH) level at 3,900, confirming a bearish bias. The Breaker Block formed near 4,050 was retested and rejected — validating institutional sell-side control. 15min ~ TF overview Fair Value Gaps (FVGs): Multiple downside FVGs remain unmitigated between 3,800 → 3,000, offering magnet zones for draw-on-liquidity targets. Daily inefficiencies suggest further markdown toward the 3,000 handle. Confluence Factors: Adaptive KAMA turning downward (bearish momentum confirmation). High-volume rejection wicks at the 4,100–4,150 zone (supply confirmation). A daily displacement candle formed after the retest (institutional order flow shift). 🔹 Narrative & Bias ETH is transitioning into a markdown leg after completing a multi-month accumulation rally. The rejection at 4,100 aligns with the broader crypto sector rotation into BTC dominance and short-term USD strength. Phase Alignment: Wyckoff Distribution → Phase D to Phase E progression. Characterised by lower highs and successive liquidity sweeps. Macro Sentiment: BTC outperforming ETH across cross-pairs (ETHBTC ratio declining). The market is reacting to tightening liquidity and lower risk appetite post-Fed communications. Projection: Primary target: 3,000 zone (daily FVG mitigation + PD array). Extended target: 2,577 (institutional discount zone aligning with prior accumulation base). Continuation bias is valid while below 4,050 resistance and until FVGs below 3,200 are filled.
davidjulien369
Long trade
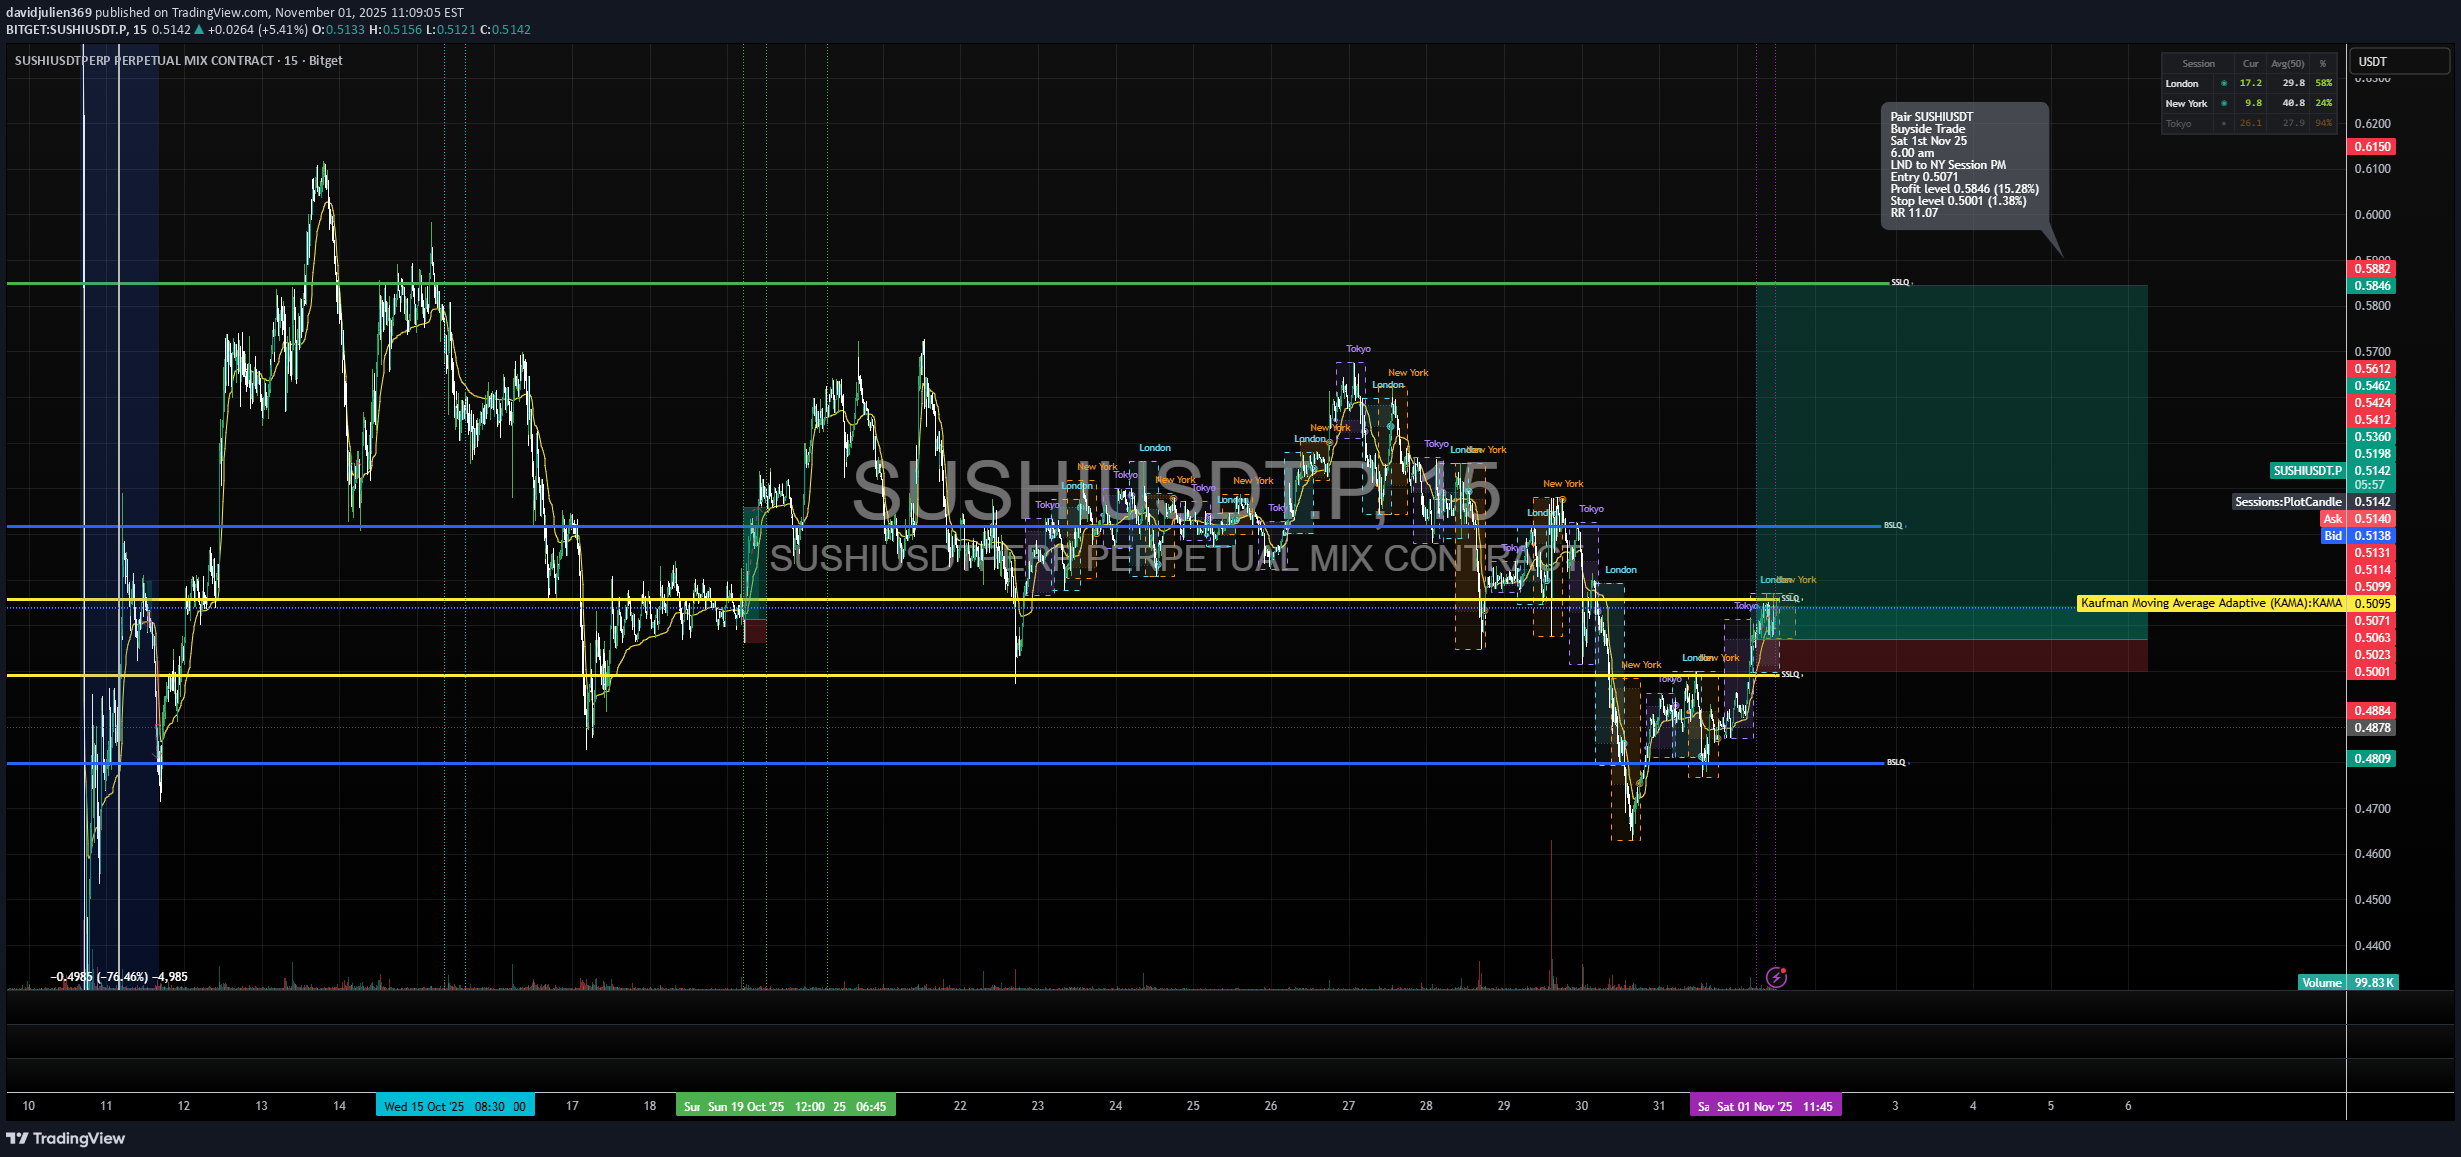
📘 Trade Journal Entry Pair: SUSHIUSDT.P Direction: Buy-Side Trade Date: Sat 1 Nov 25 Time: 6:30 am Session: LND to NY Session PM Timeframe: 15 Min 🔹 Trade Details Metric Value Entry 0.5094 Profit Level (TP) 0.5846 (+15.28 %) Stop Level (SL) 0.5041 (–1.38 %) Risk–Reward (RR) 11.07 R 🔸 Technical Context Structure: Price completed a clear re-accumulation phase after a multi-session decline. The CHOCH → BOS sequence on the 15 m timeframe confirmed bullish intent. Liquidity sweep beneath 0.50 zone (prior Asian lows) provided the displacement and smart-money entry. Key Zones: Demand Zone: 0.497 – 0.501 (previous breaker block + FVG mitigation). Target Zone: 0.580 – 0.585 (previous London/NY liquidity high cluster). Adaptive MA (KAMA): Now curling upward, acting as dynamic support. Volume Profile: Volume expansion noted during London open; follow-through in NY confirms participation from larger players after mid-week compression. 🔹 Narrative & Bias SUSHI formed a clean spring + retest pattern within the accumulation base, suggesting strong buy-side intent. The entry coincided with a liquidity sweep and rejection from demand confluence, triggering a structural breakout above the 0.51 handle. Confluences: 15 m CHOCH + BOS confirmation. 4 h FVG alignment and daily order-block support. Volume divergence → bullish reversal confirmation. KAMA support + London–NY session continuation. Projection: Expect sustained continuation toward 0.58–0.59 zone, potentially extending into 0.61–0.62 if volume persists through NY close. Partial profits ideal near 1.618 extension (~0.575) before evaluating re-entry opportunities.
davidjulien369
Long trade
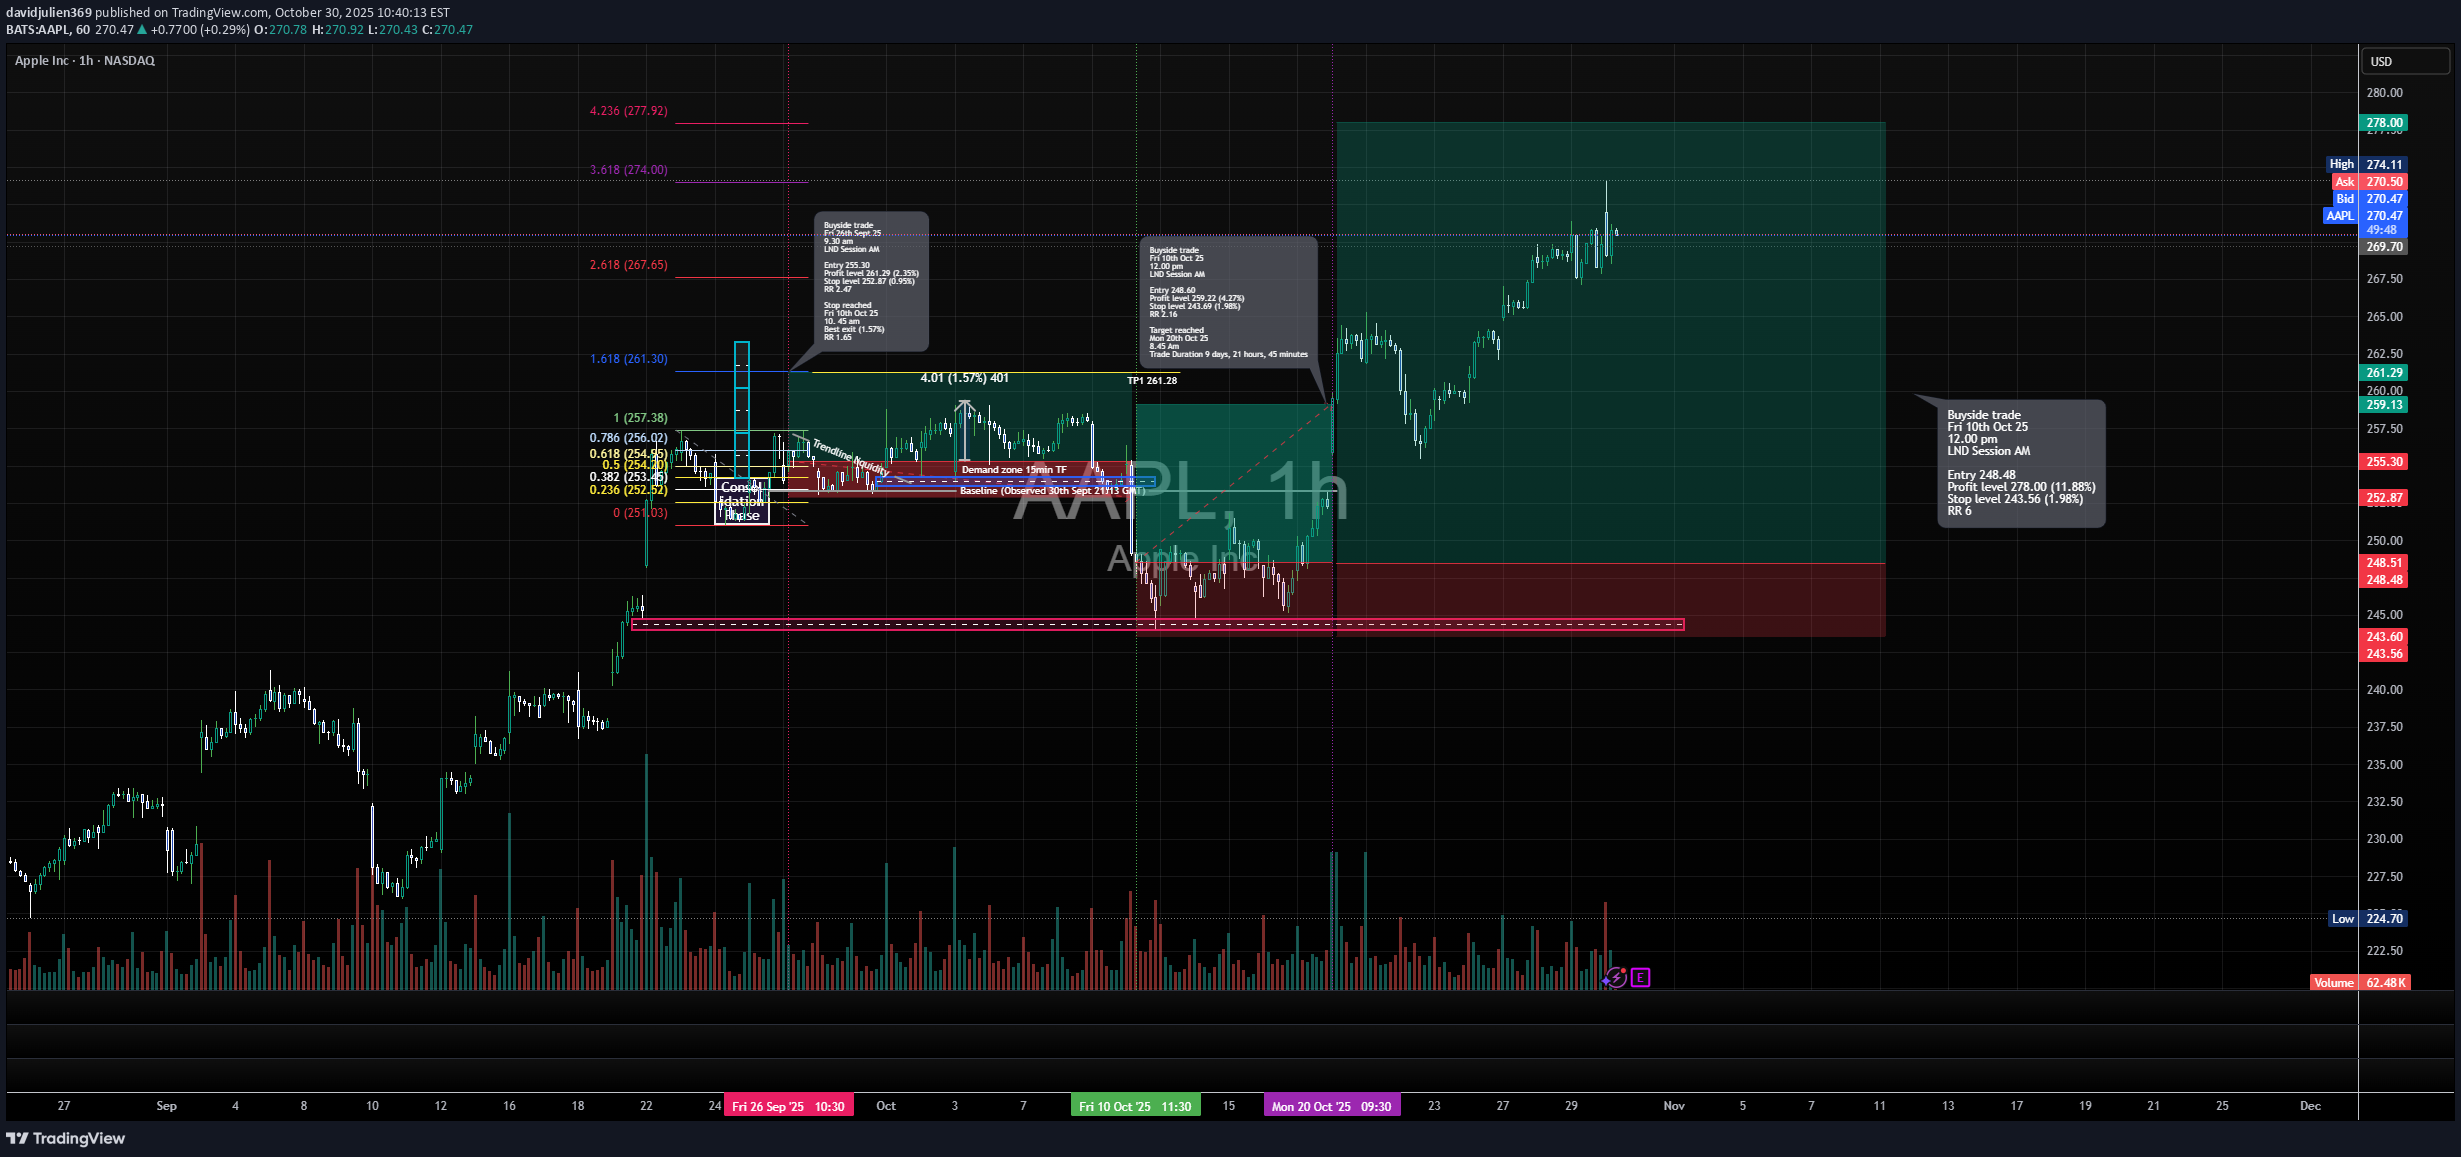
📘 Trade Journal Entry Symbol: AAPL (Apple Inc.) Direction: Buy-Side Trade Date: Fri 10 Oct 25 Time: 11:00 am Session: LND to NY Session AM Timeframe: 1 Hour 🔹 Trade Details Metric Value Entry 248.43 Profit Level (TP) 278.00 (+11.88%) Stop Level (SL) 243.56 (–1.98%) Risk–Reward (RR) 6.0 R 🔸 Technical Context Structure: Price broke out from an extended accumulation zone with confirmation from a BOS (Break of Structure) and Demand Zone Retest on the 15-minute and 1-hour timeframes. The move aligns with a strong fair value gap fill and retest of the order block around 244–245, which acted as a springboard for the next impulsive leg. Fibonacci Expansion: 1.618 projection → 261.30 (short-term target) 2.618 projection → 267.60 (intermediate) 3.618 projection → 274.00 (high-probability swing) 4.236 projection → 277.92 (extended TP) Volume Confirmation: Volume spikes visible at the breakout candle reinforce institutional participation, marking a clear transition from consolidation to markup phase. 🔹 Narrative & Bias Apple continues to exhibit buyside momentum after consolidating above the September accumulation range. The breaker block re-entry at 245 aligned with fib 0.618 retracement and strong volume demand, confirming bullish continuation. Current structure mirrors prior accumulation-distribution cycles seen before major upside runs. Macro Context: Tech sector rotation in line with AI & earnings optimism. Broader equity market stability encouraging risk-on positioning in mega-cap tech names. Projection: Price expected to extend toward 267–278 levels before the next major consolidation phase, with potential for partial take-profits near the 1.618 extension.Stop level moved (8.75%)
davidjulien369
Long trade
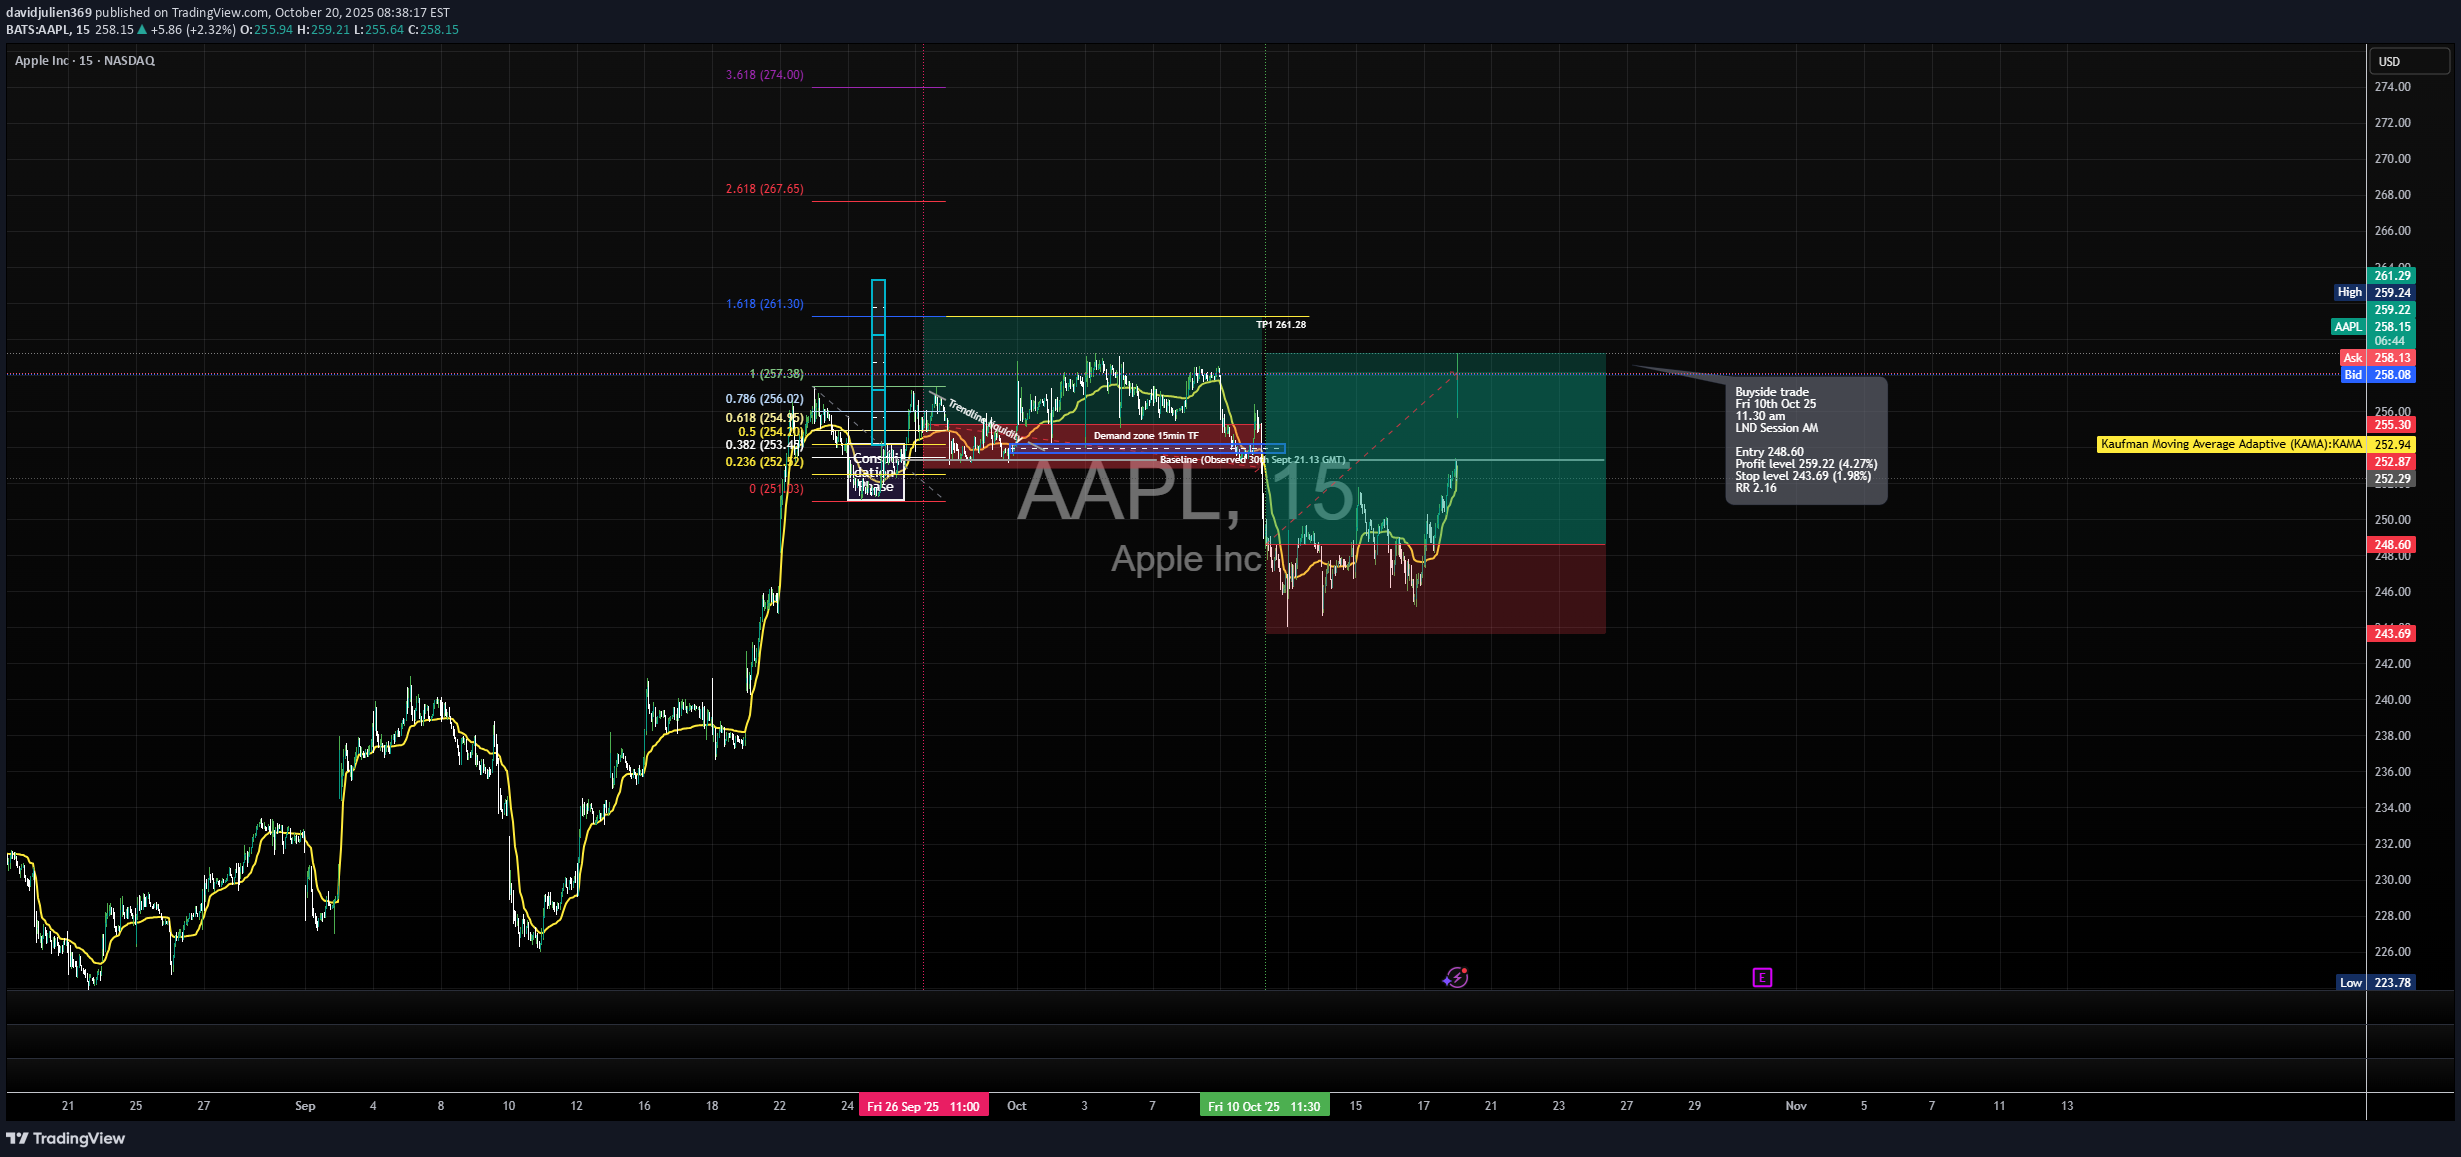
📘 Trade Journal Entry Pair: AAPL (Apple Inc) Direction: Buyside Trade Date: Fri 10th Oct 2025 Time: 11:30 AM Session: London Session AM Timeframe: 15 minutes 🔹 Trade Details Entry: $258.49 Profit Level: $269.22 (+4.27%) Stop Level: $243.69 (–1.96%) Risk-Reward Ratio (RR): 2.16 🔹 Technical Context The demand zone on the 15-minute timeframe (near $252–$255) held strongly following an earlier breaker block and order block reaction. Price retraced to the 0.618–0.786 Fibonacci zone before resuming upward momentum. Kaufman Adaptive Moving Average (KAMA) is trending upward, confirming directional bias alignment. RSI recovered from mid-range, showing bullish divergence and improved momentum. The 1.618 Fib extension aligns closely with the target zone (~$261–$262), confluencing with prior structural resistance. 🔹 Narrative After a period of range compression within the 255–258 zone, Apple broke from its re-accumulation structure following a liquidity sweep below the 15-minute demand zone. Institutional accumulation was evident, as reflected by high-volume candle expansion and a clear reclaim of structure at 257. 🔹 Market Sentiment Context Broader NASDAQ composite strength aligns with post-earnings optimism and risk-on appetite. USD weakness and moderating Treasury yields have improved tech-sector conditions. The upcoming Q4 earnings cycle and expectations of a potential Fed rate cut sustain short-term bullish sentiment across mega-cap equities.
davidjulien369
Long trade
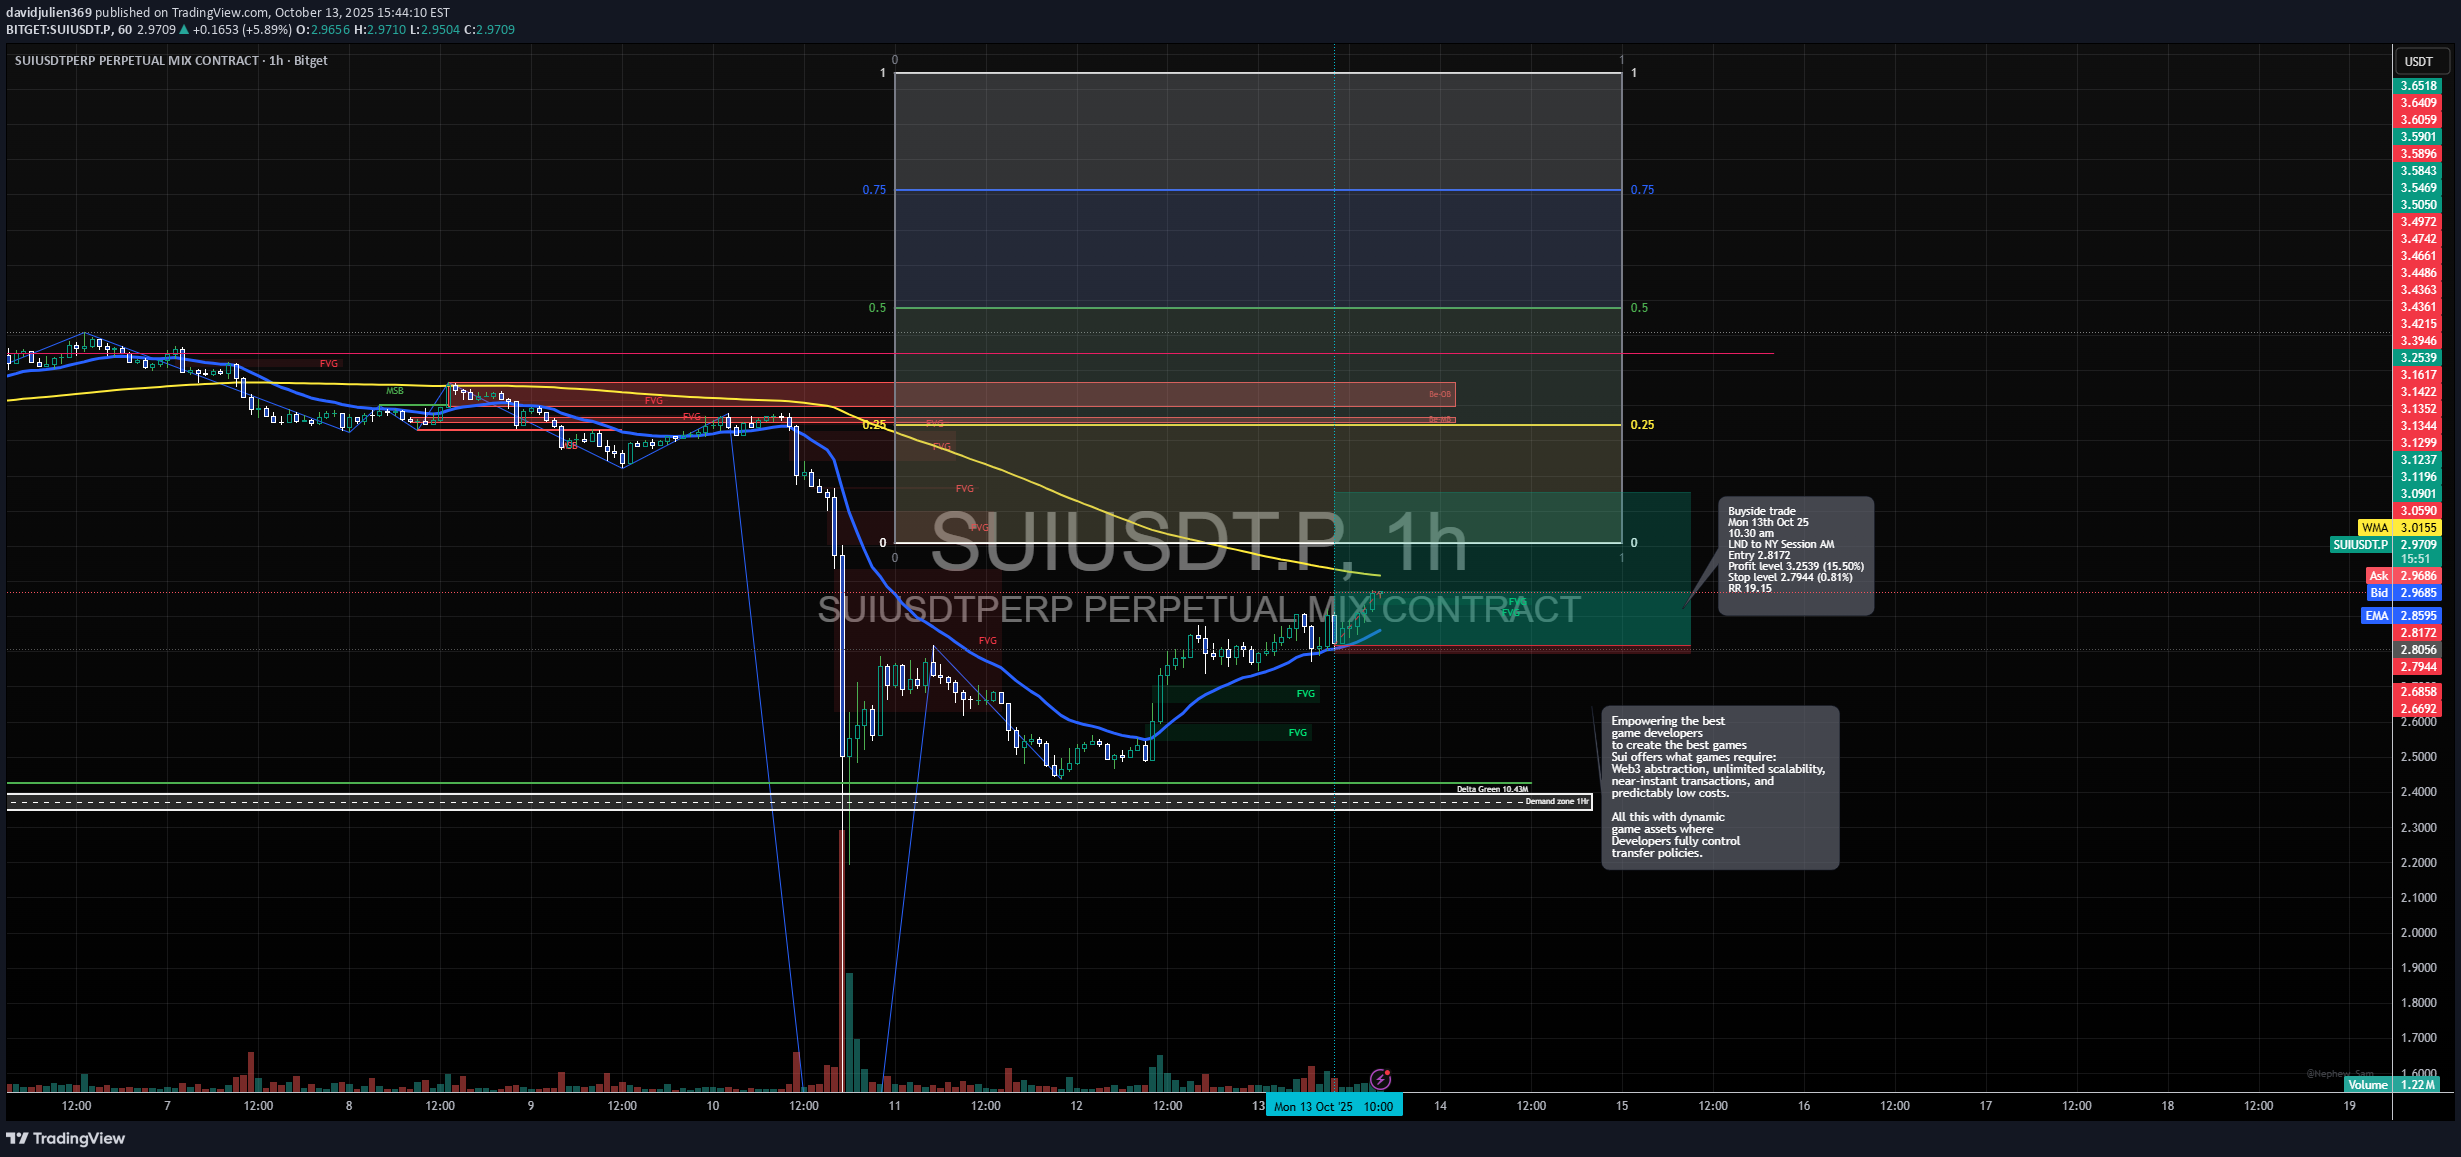
1Hr Tf overview 📘 Trade Journal Entry Pair: SUIUSDT.P Date: Mon 13th Oct 25 Time: 10:30 am Session: London → New York Session AM Direction: Buyside Trade Timeframe: 4-Hour 🔹 Trade Details Entry: 2.8172 Profit Level: 3.2539 (+15.50%) Stop Level: 2.7944 (–0.81%) Risk-Reward (RR): 19.15 🔸 Technical Context Model Type: Accumulation → Consolidation → Breaker Block → FVG Continuity Narrative: Price consolidated within a compression phase at the base of the prior liquidity sweep. The reaccumulation formed after a deep mitigation into a 4H FVG, aligning with the 50 EMA reclaim and VWAP equilibrium retest. 4Hr CHOCH and BOS confirm directional shift from previous markdown. FVG cluster at 2.80–2.85 served as the low-risk entry zone. Volume expansion and liquidity absorption are evident around 2.81. The target region is mapped to the prior imbalance and breaker block at 3.25 (HTF premium zone). Market structure gap fills coincide with 0.75 Fibonacci projection — confirming confluence for TP. 🧠 Sentiment Context Market sentiment remains risk-on, as broader altcoin rotation regains traction after weeks of compression. The Fear & Greed Index showing recovery above 45 suggests returning investor confidence. SUI fundamentals (emphasis on scalable gaming-focused blockchain) further align with speculative inflows into high-throughput L1 ecosystems. ⏱️ Trade Management Notes Entry confirmation via a break of micro-swing high and volume-backed displacement. Partial profits recommended at 3.10 (mid-range liquidity). Continue monitoring reaction around 3.25 — a likely short-term distribution point before next accumulation.
davidjulien369
Long trade

📘 Trade Journal Entry Pair: TAO/USDT.P Date: Mon 29th Sept 25 Time: 4.00 pm Session: LND to NY Session AM Direction: Buyside Trade Timeframe: 4-Hour 🔹 Trade Details Entry: 318.22 Profit Target: 356.29 (+28.04%) Stop Loss: 291.91 (–1.16%) Risk-Reward Ratio (RR): 12.97 🔹 Technical Context Model Type: Accumulation → Breaker Block → FVG Continuation Model Setup Sequence: Accumulation Phase following extended markdown with higher-timeframe liquidity grab below 300 zone. Choch confirmation on 4H structure — price reclaimed both 50EMA & 200WMA. Multiple FVGs formed and held as re-entry zones, supporting continuation toward mid-range liquidity. Volume Expansion evident at 320–325 region during breakout candle, confirming institutional demand. BOS alignment with intraday structure (1H & 30M) providing confluence for entry precision. 🔹 Narrative Context The breakout above 50EMA and successive fair value gaps validated a change in market intent, establishing a clear buyside bias. Momentum built through late London and carried into early NY, with 325–330 acting as launchpad for continuation. The trade’s RR reflects early positioning within a macro rotation phase, consistent with liquidity targeting of the 355–360 range.
davidjulien369
Long trade

1Hr TF overview Trade Journal Entry – ZORAUSDT.P (Zora Protocol) Direction: Buyside Date: Tuesday, 30th September 2025 Time: 4:00 PM Session: NY → London PM Timeframe: 1-hour Trade Parameters Entry: 0.04869 Profit Level: 0.09297 (+114.63%) Stop Level: 0.04295 (−5.53%) Risk–Reward Ratio (RR): 18.07 🔹Technical Breakdown Market formed a downward channel structure before a decisive liquidity sweep beneath prior NY & London lows. 🔹Volume delta confirmed capitulation with aggressive buy absorption at the discount zone (0.045–0.047). 🔹Breaker block and FVG retracement (50–61.8%) confluence validated the buy entry. 🔹EMA alignment (50 > 200) indicated shift in short-term structure to bullish continuation. 🔹Volume spike at breakout candle (1H) confirmed institutional re-entry and short squeeze. 🔹Target achieved above prior range high around 0.090–0.093 zone, clearing resting liquidity. 15min TF overview Fundamental Context (from Coingecko / Coinglass / CoinStats) Price: $0.0856 (+52.8% 24h) Market Cap: ≈ $384 M Fully Diluted Valuation: ≈ $857 M 24h Trading Volume: ≈ $27 M Circulating Supply: 4.47 B ZORA (Max 10 B) Top Exchanges: Binance, Bybit, Bitget Funding Flows: Net long bias ≈ +119% inflow (CoinGlass data). Recent Catalyst: ZORA token listed on Robinhood and Binance, driving +50% daily surge. Project Narrative Zora was launched in 2020 as an Ethereum-based NFT auction protocol, evolving into a Web3 social platform where creators can mint, earn, and trade digital assets directly on-chain. The ZORA token (ERC-20) powers network incentives, creator rewards, and protocol governance. Its strong community engagement and integration with Base Network (CoinStats source) underpin current momentum. Sentiment & Momentum Social engagement: Rising as ZORA trends on X (Twitter) and major NFT circles. Market positioning: Post-listing accumulation phase transitioning to early expansion cycle. Heatmap: Binance dominates >70% of volume — indicating institutional liquidity pools. Bias: Bullish as long as 0.045–0.050 zone holds (re-accumulation area). | Horizon | Projection | Notes | --------------------- | ----------- | ------------------------------------------------------------------- | **1-Week** | 0.090–0.100 | Continuation toward upper liquidity pool | **1-Month** | 0.120 | Expansion if NFT/creator narrative sustains | **4-Month (Q1 2026)** | 0.145–0.160 | Potential rotation target if trend persists & macro -------------- crypto sentiment holds | Summary Insight This ZORAUSDT setup combined technical exhaustion, fundamental catalysts, and strong liquidity inflows. The trade represents an ideal confluence between smart money structure (breaker/FVG) and macro event catalyst (exchange listing + social traction).Observation Thu 9th Oct 25 3.00 pm Stop level moved (72.01%)
Disclaimer
Any content and materials included in Finbeet's website and official communication channels are a compilation of personal opinions and analyses and are not binding. They do not constitute any recommendation for buying, selling, entering or exiting the stock market and cryptocurrency market. Also, all news and analyses included in the website and channels are merely republished information from official and unofficial domestic and foreign sources, and it is obvious that users of the said content are responsible for following up and ensuring the authenticity and accuracy of the materials. Therefore, while disclaiming responsibility, it is declared that the responsibility for any decision-making, action, and potential profit and loss in the capital market and cryptocurrency market lies with the trader.