
BTC
Bitcoin
| Trader | Signal Type | Profit Price/Stop Loss Price | Publish Time | View Message |
|---|---|---|---|---|
 KennyYenKenRank: 469 | BUY | Profit Price: Not specified Stop Loss Price: Not specified | 1 hour ago | |
 IndicesforlifeRank: 314 | SELL | Profit Price: Not specified Stop Loss Price: Not specified | 4 hour ago | |
 Nova-ScalperRank: 210 | SELL | Profit Price: Not specified Stop Loss Price: Not specified | 6 hour ago | |
 mandrake1Rank: 275 | SELL | Profit Price: Not specified Stop Loss Price: Not specified | 8 hour ago | |
 JuliiaRank: 123 | BUY | Profit Price: Not specified Stop Loss Price: Not specified | 10 hour ago |
Price Chart of Bitcoin
Profit 3 Months :
Signals of Bitcoin
Filter
Sort messages by
Message Type
Trader Type
Time Frame

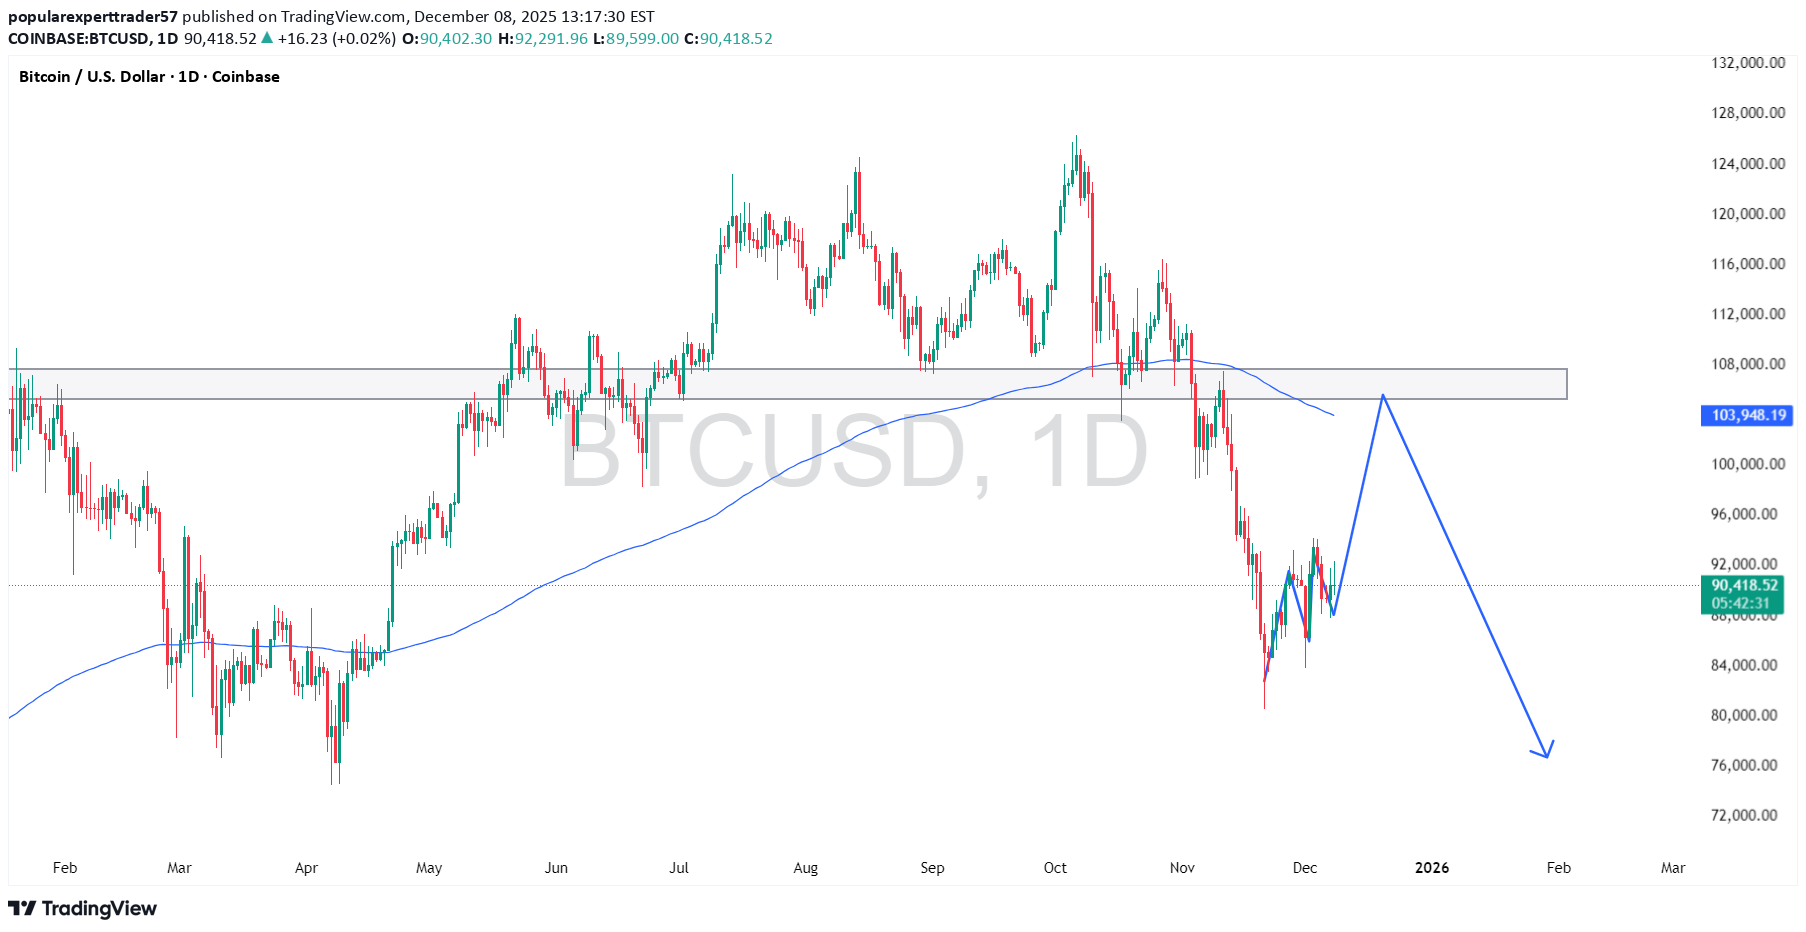
BTCUSD Daily – Major Topping Structure Confirmed | Bearish BiasBitcoin has printed a textbook distribution phase after the parabolic run to ~$109K: Double-top + lower high around the $108–109K zone Clear break & daily close below the multi-month bullish trendline (former support since March 2025) Strong bearish momentum candle with increased volume on the breakdown Price now retesting the broken trendline from below → perfect lower-timeframe rejection expected Bigger-picture target sits at $90–92K (previous range highs) and $84–80K if bears stay in control.Short / Sell Signal Direction: Short Bitcoin Entry: 103,500 – 104,500 (retest of broken trendline) Stop Loss: 107,200 (above the lower high) Take Profit 1: 96,000 Take Profit 2: 90,000 – 92,000 Take Profit 3: 84,000 – 80,000 R:R: 1:5+ easily achievable #BTC #Bitcoin #BTCUSD #ShortBitcoin #Bearish #DailyBreakdown #Crypto #TechnicalAnalysis Not financial advice – cryptocurrency trading is extremely risky. Always manage your risk and do your own research!

SquishTrade
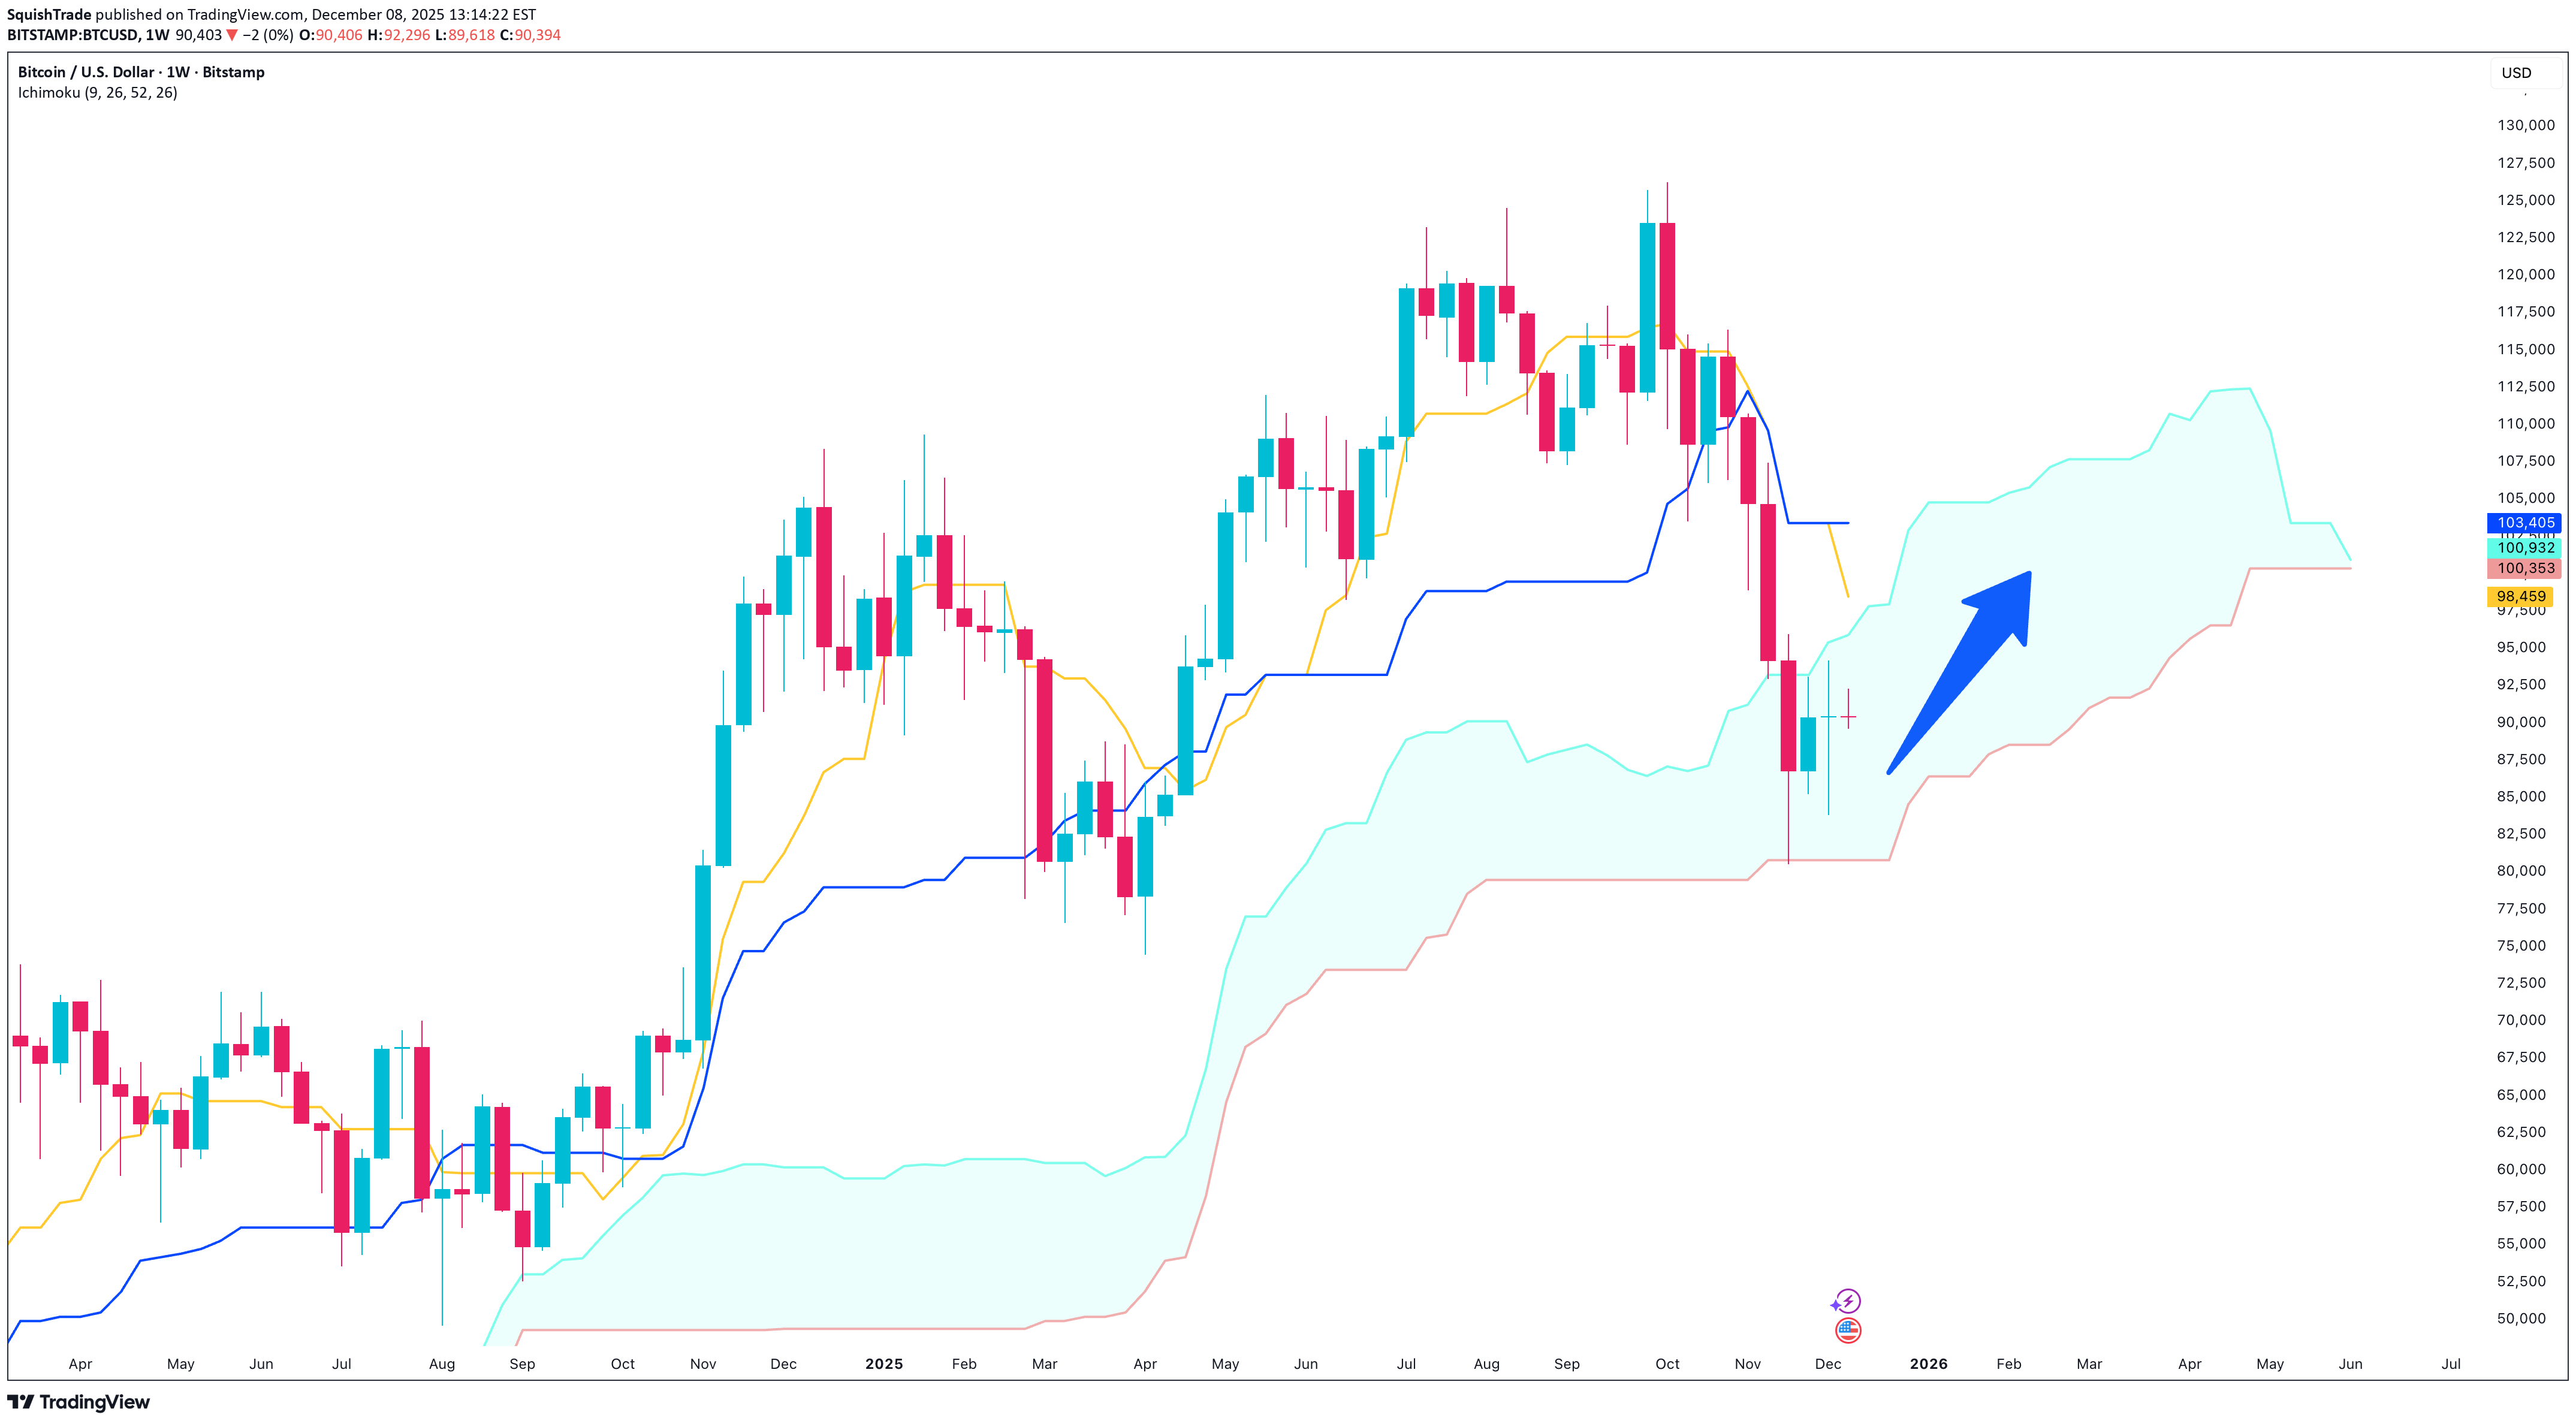
BTCUSD has been in correction mode for the past two months since its new ATH on October 6, 2025. It fell through various technical supports, including shorter term simple and exponential moving averages. But it appears to be finding support right where it should when zooming out on the weekly timeframe. On the Ichimoku charting system (an equilibrium-based system developed in Japan), cloud support is particularly important especially on higher timeframes like weekly and monthly charts. Further, an green-colored cloud, upward sloping and not narrow indicates bullish trend and stronger support. Of course, the Kijun line is overhead on the weekly. That must be overcome in the next few weeks for further upside. The monthly chart with Bollinger Bands applied at standard settings reveals that BTC has simply retraced to the mean during this volatile period of consolidation and correction. Here is a snapshot: Always do your own research and manage your risk appropriately for your position size! And enjoy your holiday season. Merry Christmas and Happy New Year to all!

SaifurRahman
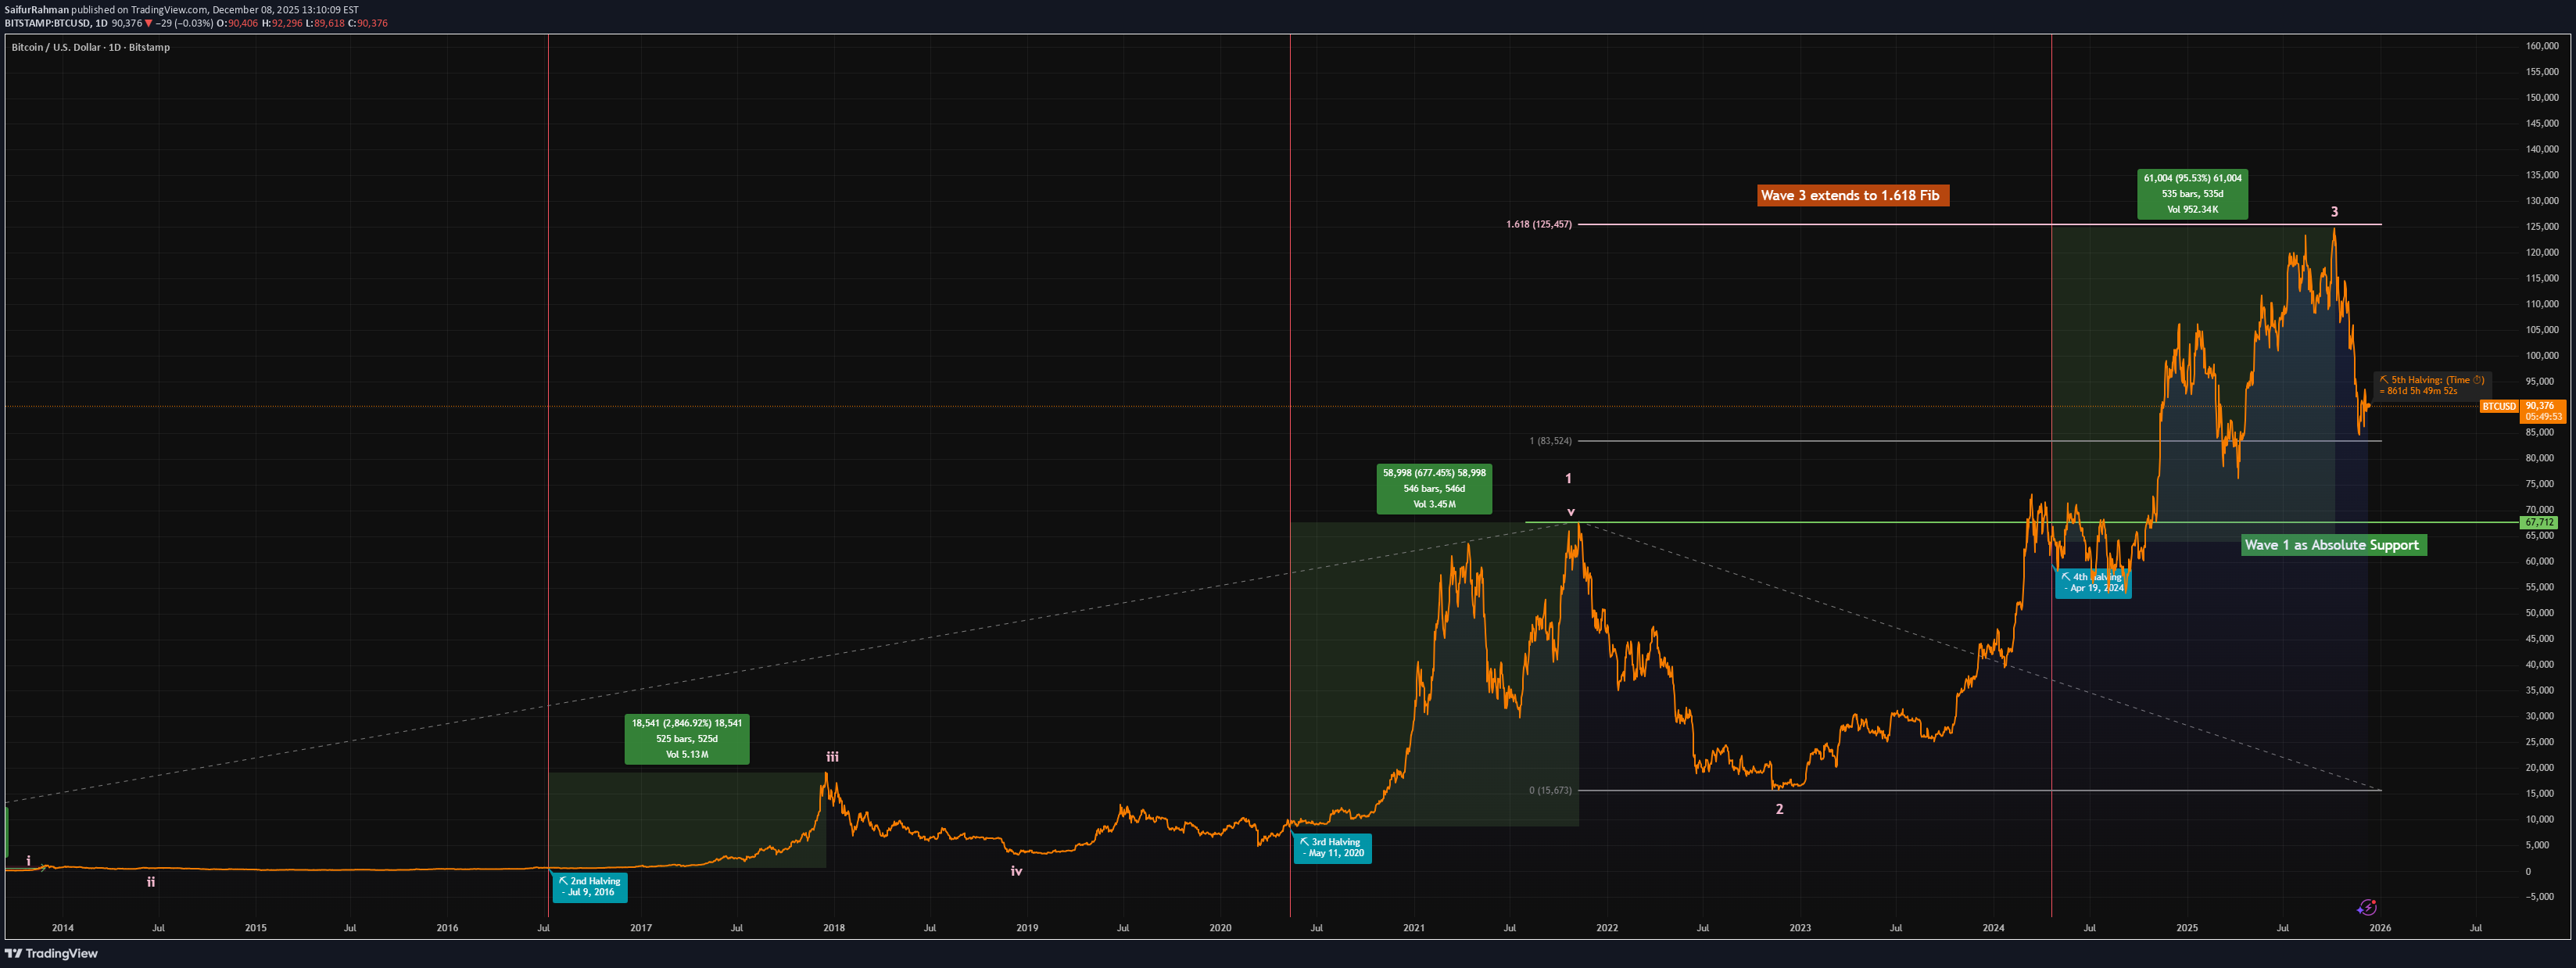
Having Completed wave 3 at 1.618 Fib extension of wave 1, I anticipate that bitcoin will remain above wave 1 top of 67k and after some consolidation will go up to complete wave 5. Wave 5 top is expected to be According to wave equality wave 1 = wave 5, top expected at 193k ( possibly between 195-200k region) Interesting fact to note that after each halving bitcoin topped in that bull cycle after 525-545 days (excpet that 1st halving which took 366 days). Also gain from the date of halving till the top decreased every time. After reaching 200k, I expect bitcoin to go through a long term bearish cycle.
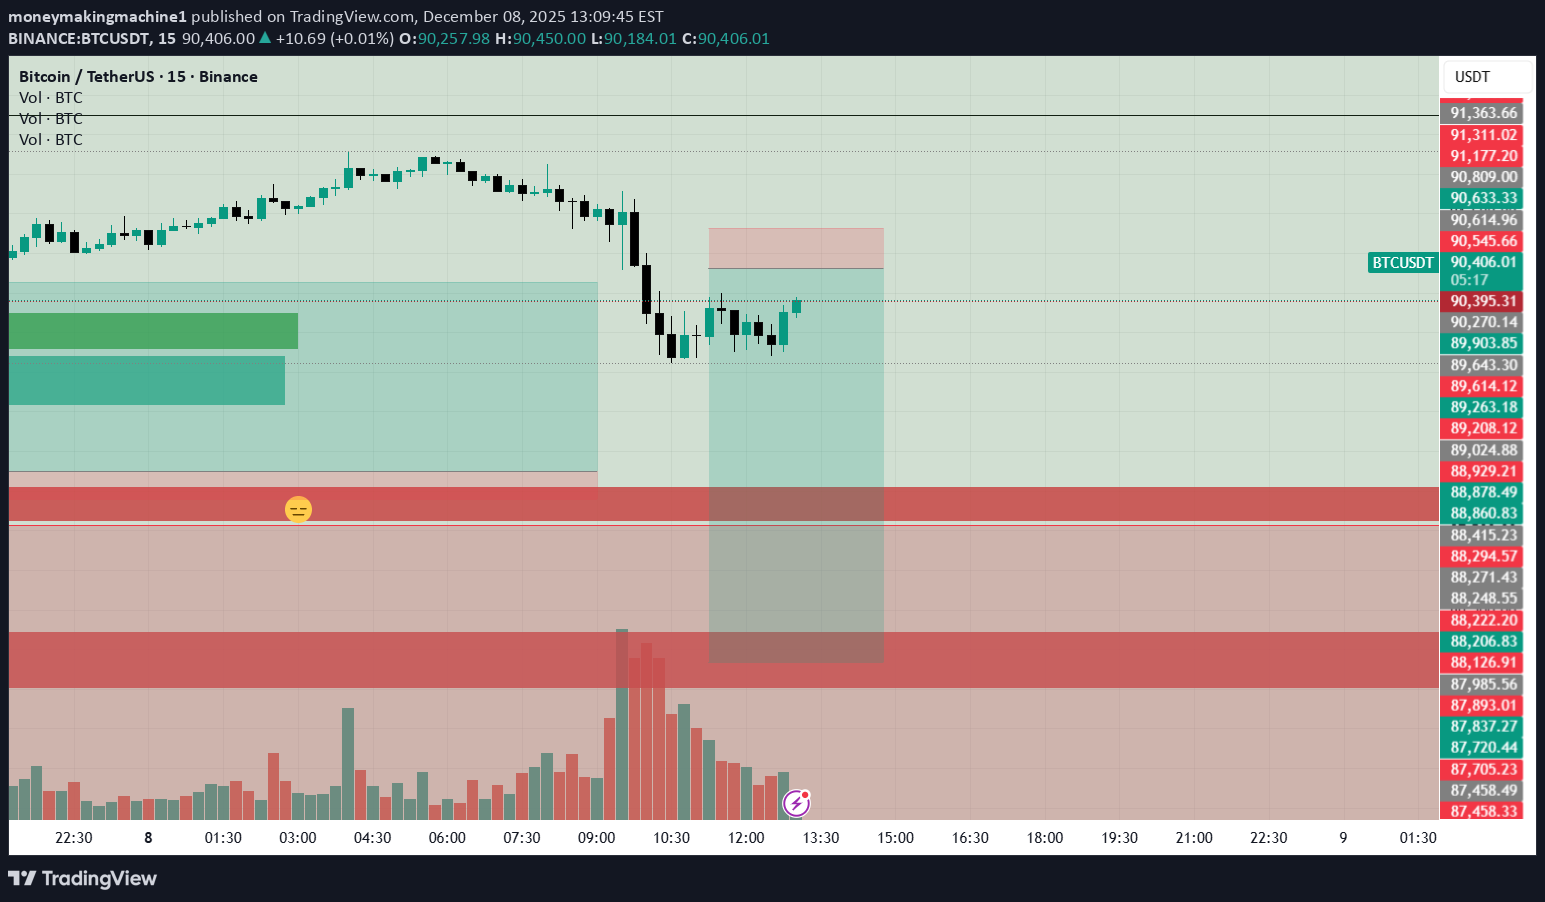
I'm looking to short in the FVG right above 90K to the 88K or even lower.
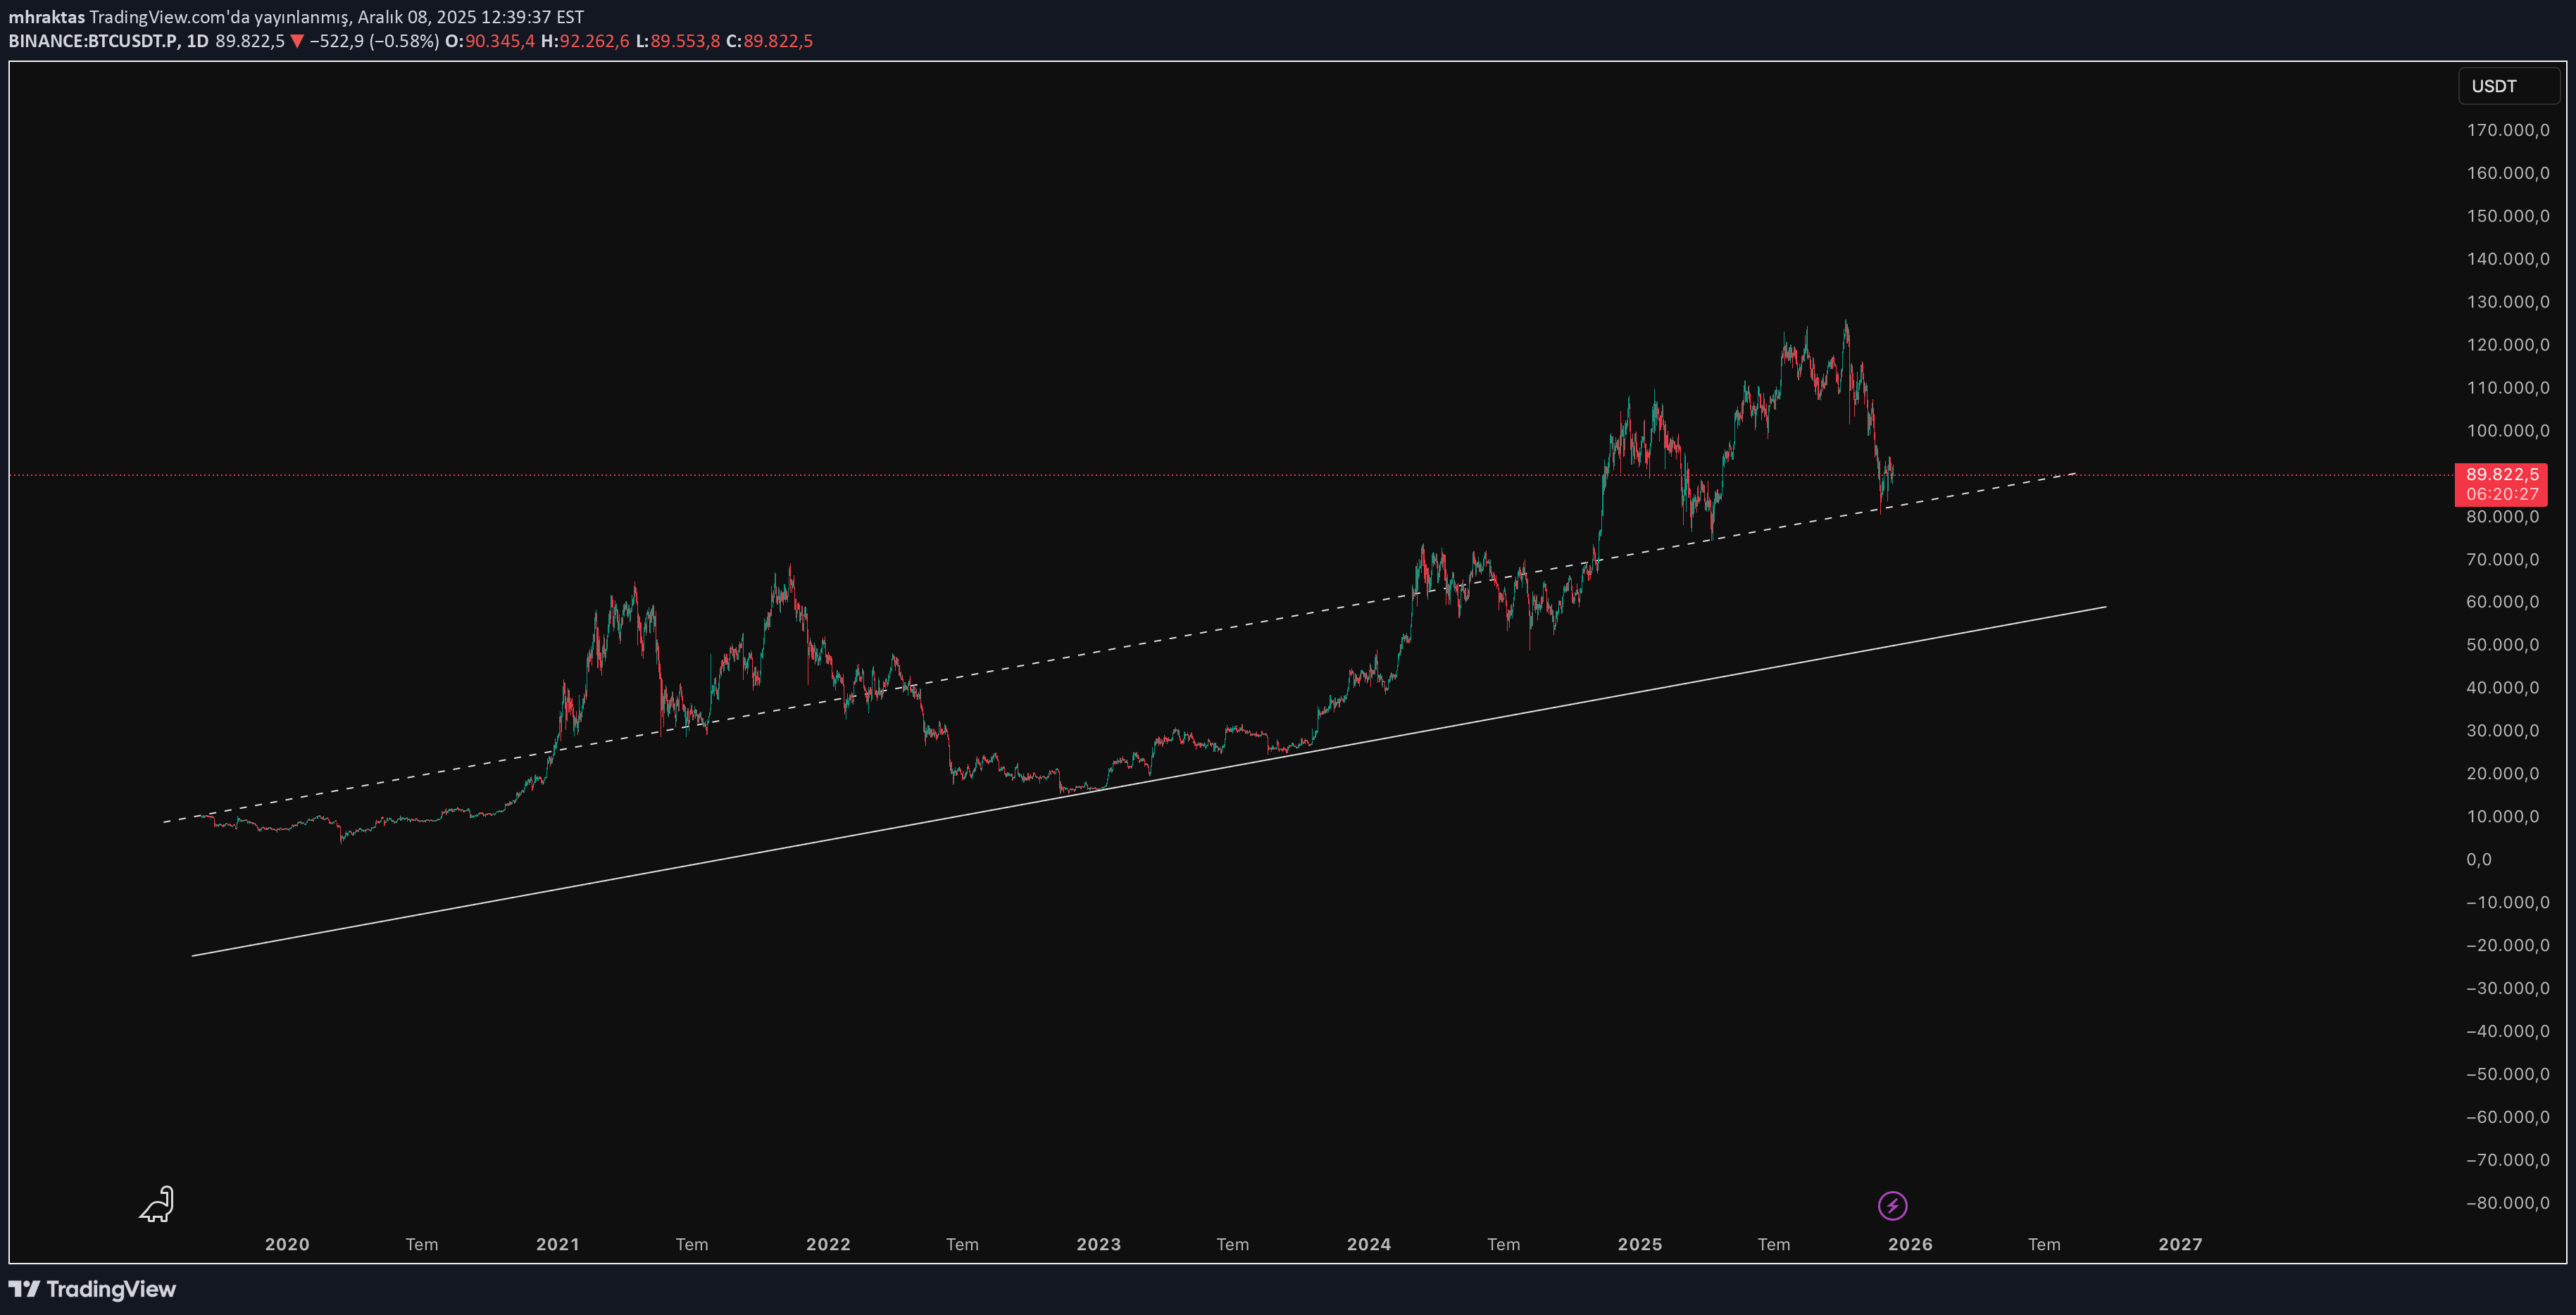
BTC düşüş trendi, macro ve micro yapı içindeki yükseliş ana hatlarınının grafiklerinin alt yapısını görüşlerim kısmında paylaştım, özel yazılım kullandığım için buradan paylaşıma izin verilmiyor....
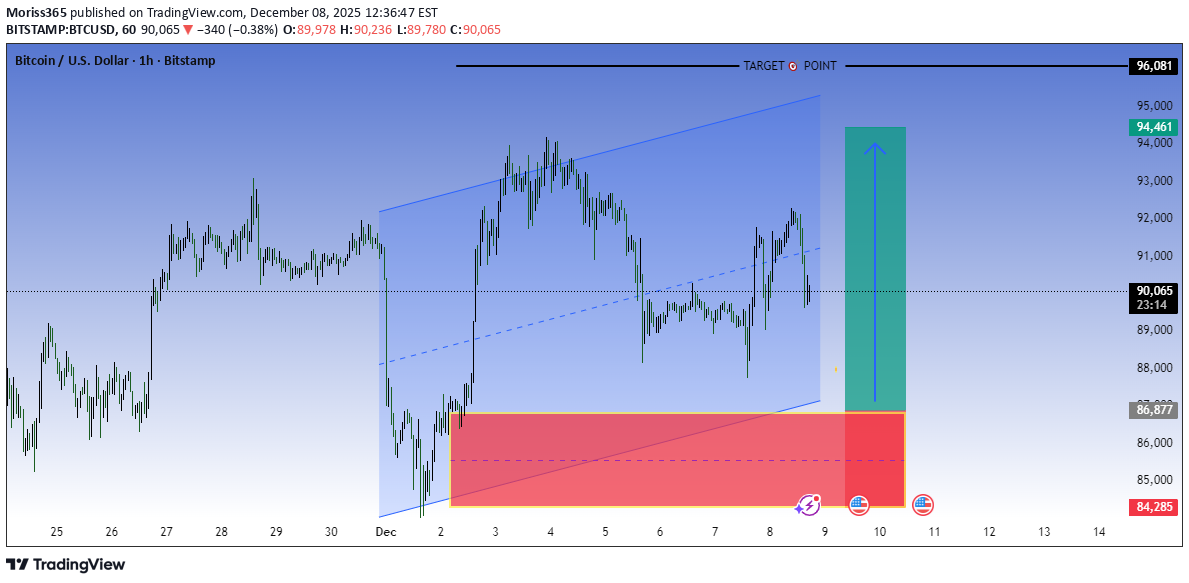
1. Market Structure (1H BTCUSD) Overall structure: Still range-bound / corrective, not a clean trend. Price is trading inside a rising channel but momentum has weakened. We recently rejected from the upper mid-range, not from the absolute highs — that matters. Interpretation: This is consolidation after a strong move, not distribution yet — but buyers are no longer aggressive. --- 2. Key Zones (Very Important) 🔴 Demand / Support Zone (Red Box) Roughly 85,000 – 86,800 Multiple reactions here → high-quality demand Liquidity + prior structure low + channel support If price enters this zone and holds: → High-probability bounce / long setup If this zone breaks cleanly (1H close below): → Structure fails → expect accelerated sell-off --- ⚫ Resistanc… “BTCUSD 1H — Range Support Buy Targeting Range High Liquidity”

melikatrader94
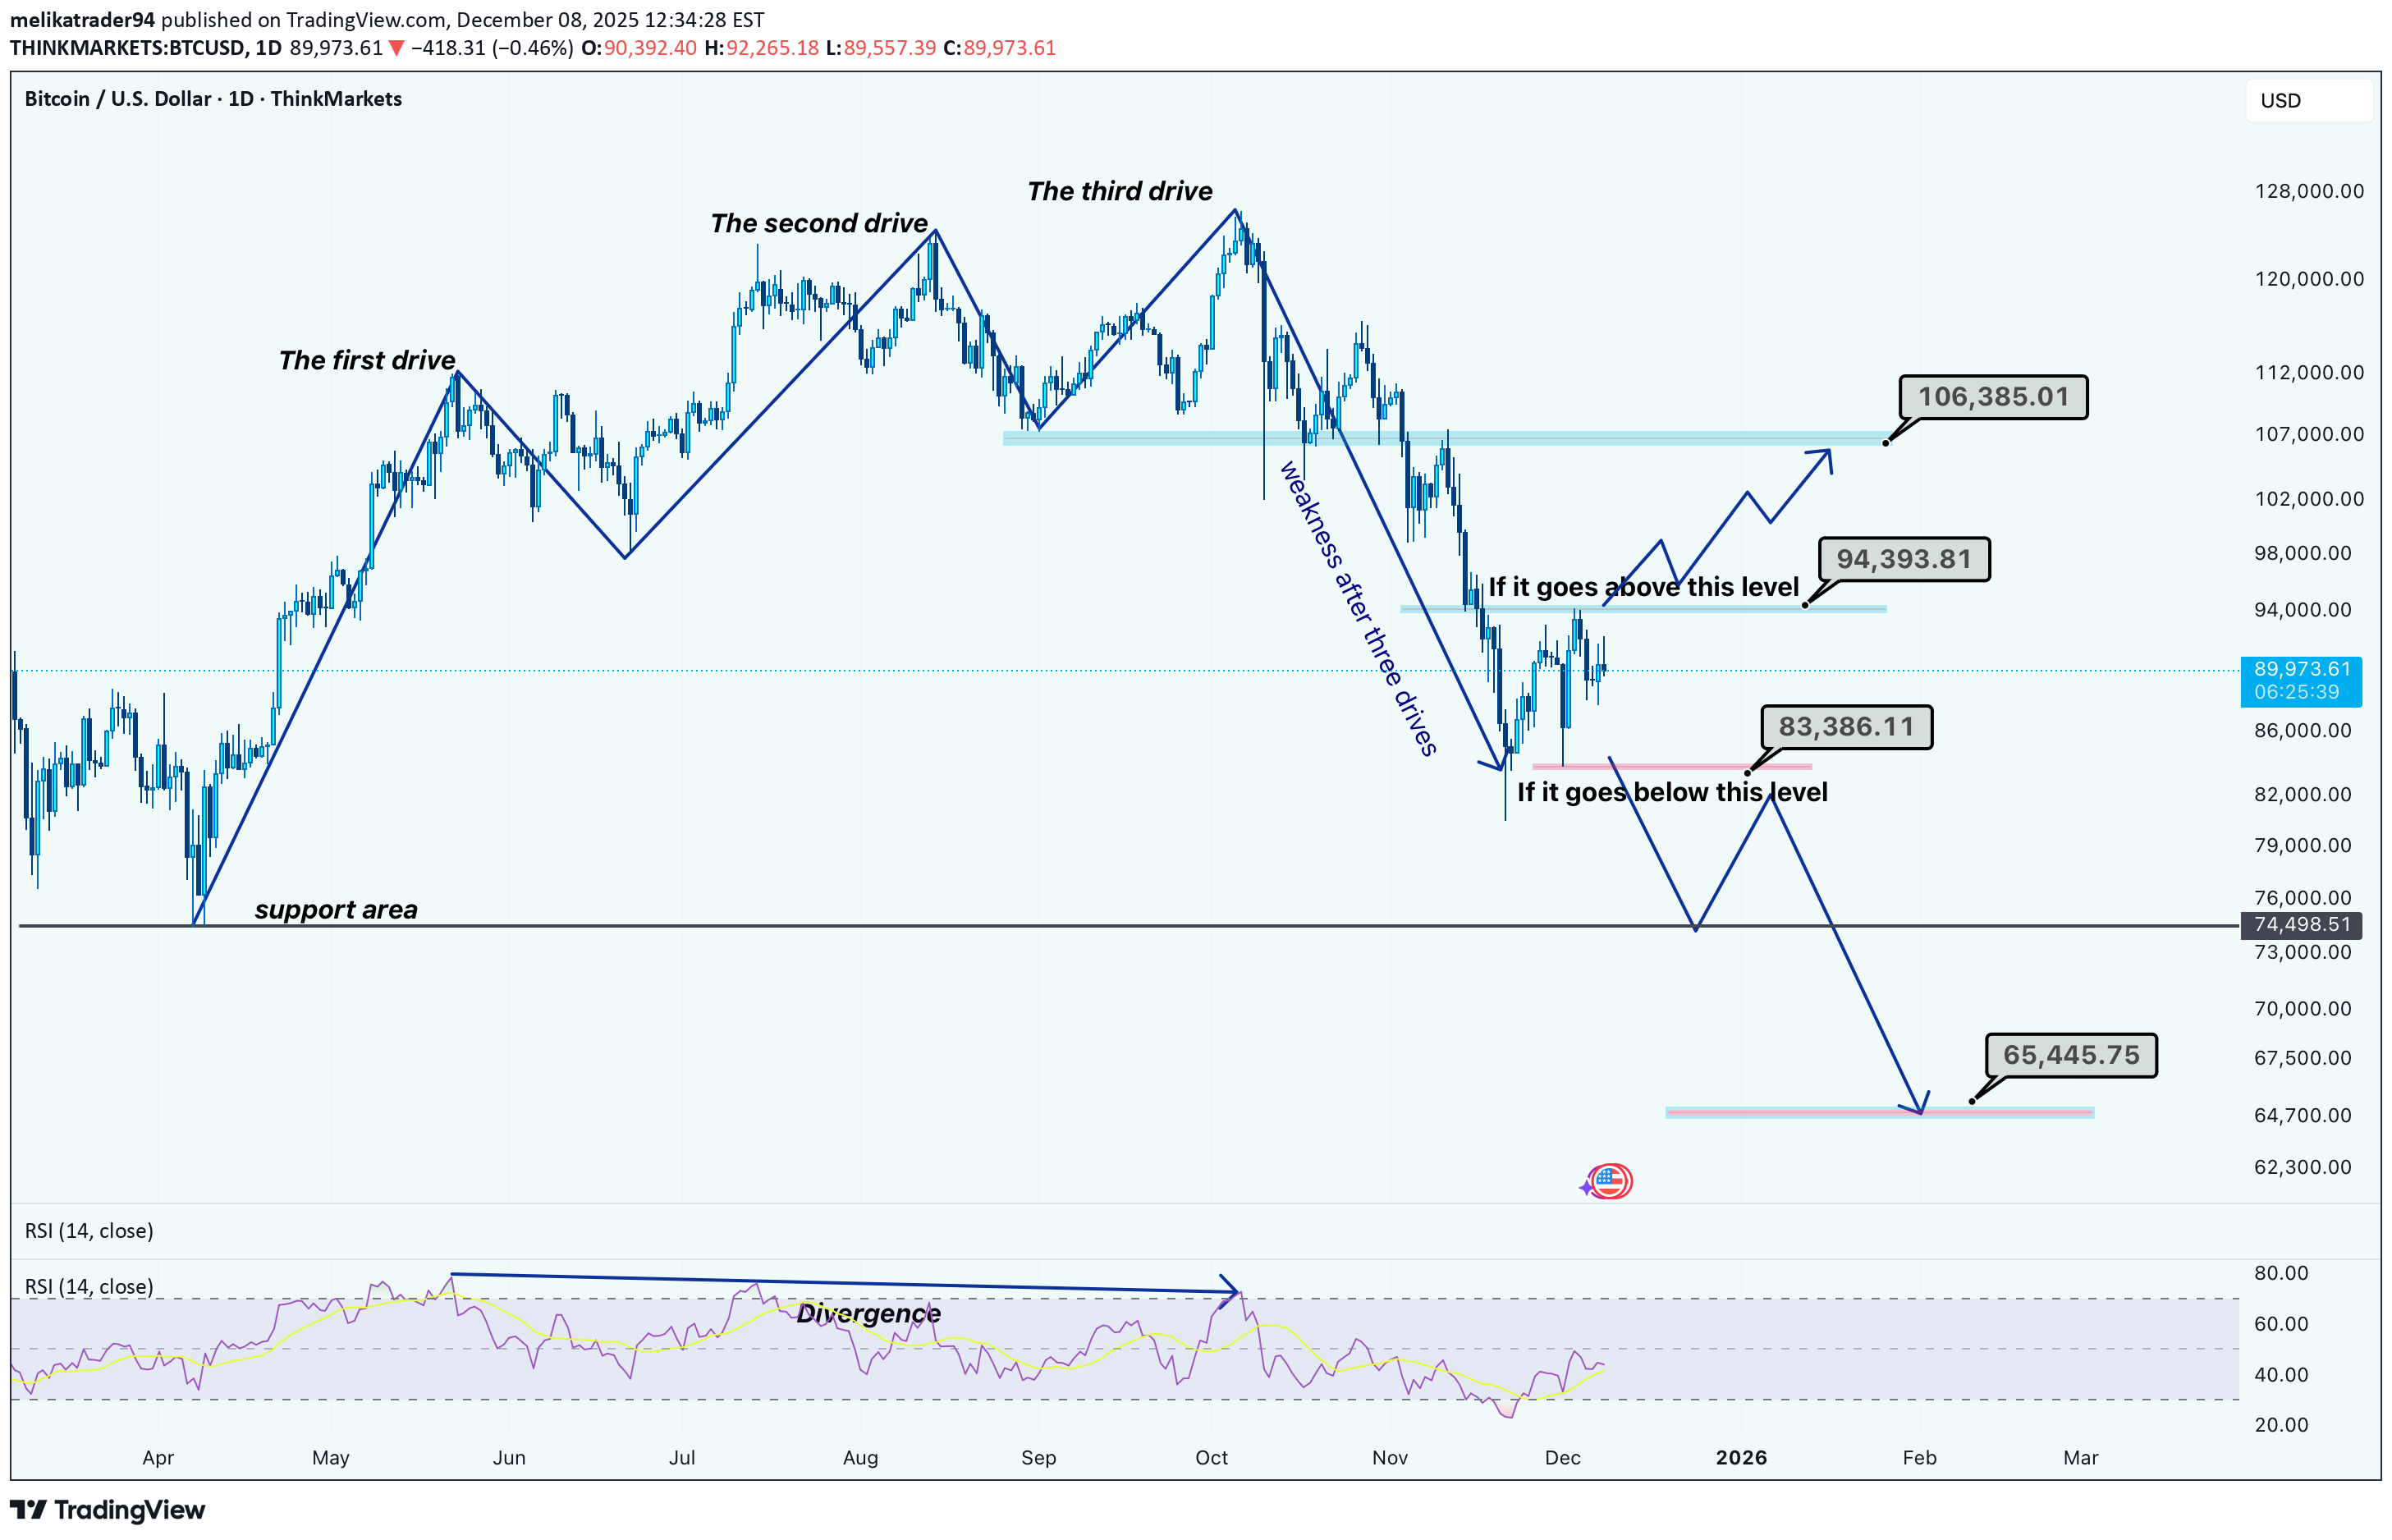
Hi guys! The current BTC structure displays a textbook Three Drives Pattern, followed by visible momentum weakness. After the first, second, and third drives completed, price failed to create higher highs, confirming exhaustion. This aligns with the RSI divergence, which began forming during the second and third drives. Price has now pulled back into a key decision zone. Two scenarios stand out: Bullish Scenario If BTC breaks and sustains above 94,393 USD, it would signal renewed strength. This could trigger a continuation toward the upper supply zone around 105,000–110,000 USD, where previous rejection occurred. Bearish Scenario Failure to break higher and instead falling below 82,000–83,000 USD opens the path toward deeper retracement. A breakdown confirms the distribution phase after the three drives, exposing the broader support area near 74,500 USD and potentially down to 65,445 USD, which aligns with historical demand. Disclaimer: As part of ThinkMarkets’ Influencer Program, I am sponsored to share and publish their charts in my analysis.

John_Isige
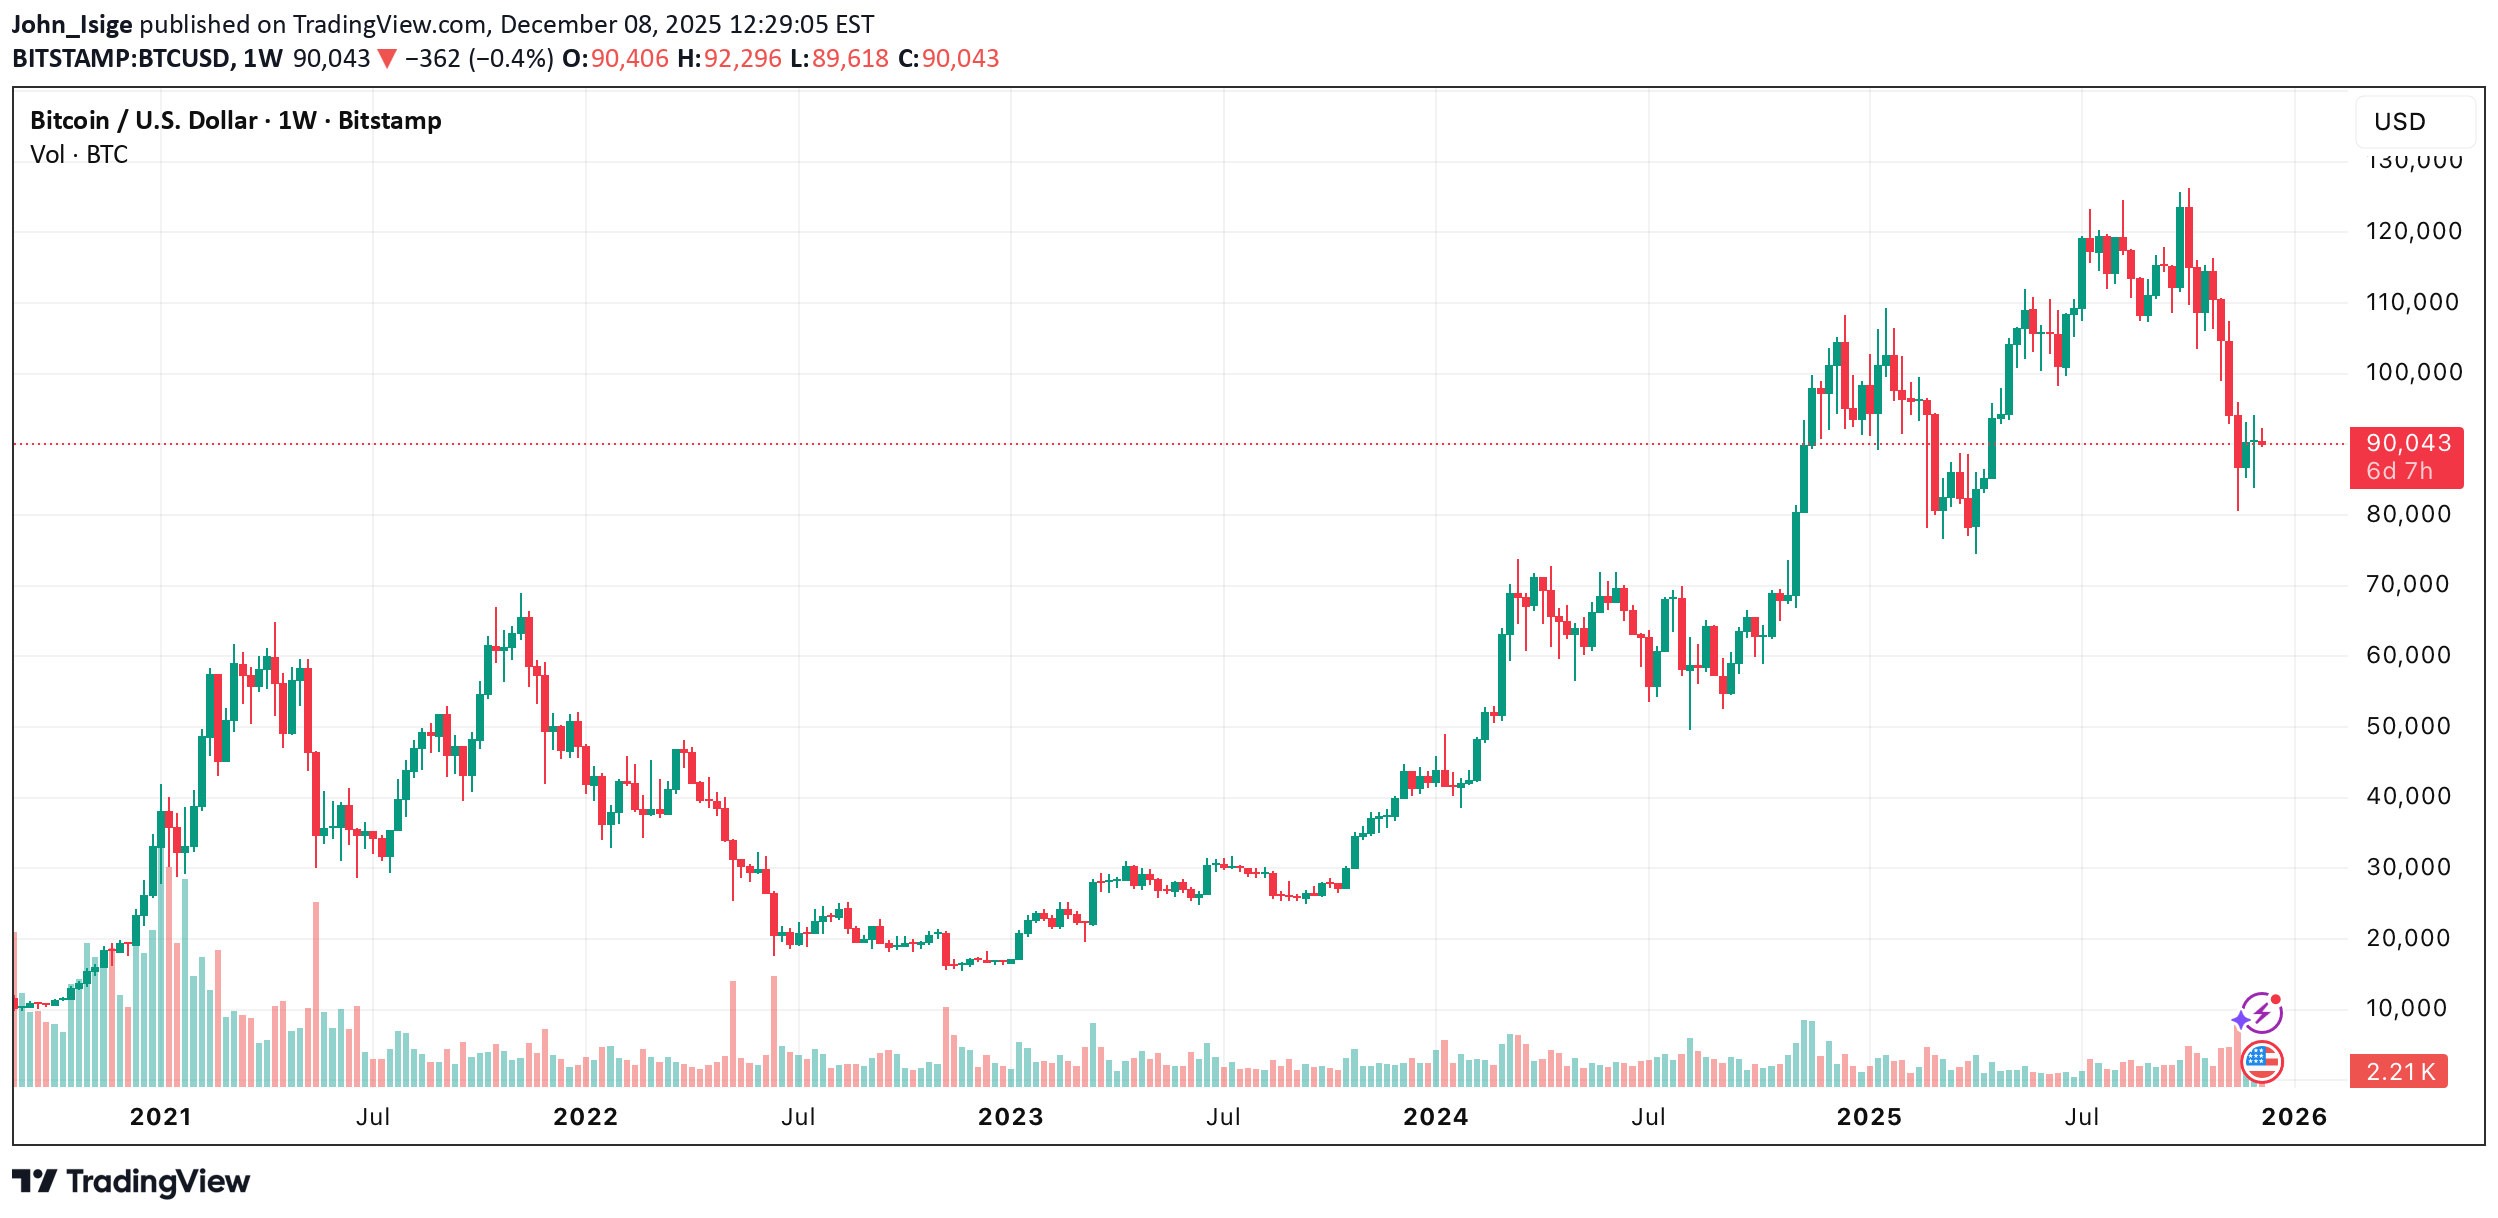
BTC/USD spent last week inside the 93,750–87,500 range, failing to break higher despite growing expectations of a Fed rate cut on December 10. CME FedWatch shows ~90% odds of a 25 bp cut, but Powell’s earlier remarks about a potential pause keep uncertainty elevated. Despite a minor rebound, upside remains capped. Investors reacted negatively to the U.S. National Security Strategy, which ignored crypto entirely while highlighting AI and quantum tech as critical national priorities. ETF flows also signal persistent risk aversion: Bitcoin ETFs recorded $87.7M in net outflows, while the Fear & Greed Index remains in Extreme Fear (20). Given this backdrop, a sustained bullish recovery looks unlikely even if the Fed delivers a dovish decision. ⸻ Market Structure BTC trades inside a long-term downtrend, with a short-term rebound failing at the upper boundary of the range. A clean break above 93,750 (Murray [3/8], 61.8% Fib, upper BB) would open a move toward 100,000 and 106,250, but sellers continue to dominate. A breakdown below 87,500 (Murray [2/8]) would trigger continuation toward the cycle lows at 75,000 and 68,750. Technical indicators maintain a bearish bias: • Bollinger Bands → flat • Stochastic → turning down • MACD → stable in negative territory Momentum remains weak. ⸻ Key Levels Resistance: 93,750 • 100,000 • 106,250 Support: 87,500 • 75,000 • 68,750 ⸻ BTC/USD — Trading Scenarios (Weekly) Primary Scenario — SELL STOP Entry: 87,450 Take Profit: 75,000 • 68,750 Stop Loss: 92,300 Bias: Bearish continuation below key support ⸻ Alternative Scenario — SELL LIMIT Entry: 100,000 Take Profit: 75,000 • 68,750 Stop Loss: 104,000 Bias: Fade the rally into resistance

cryptownian
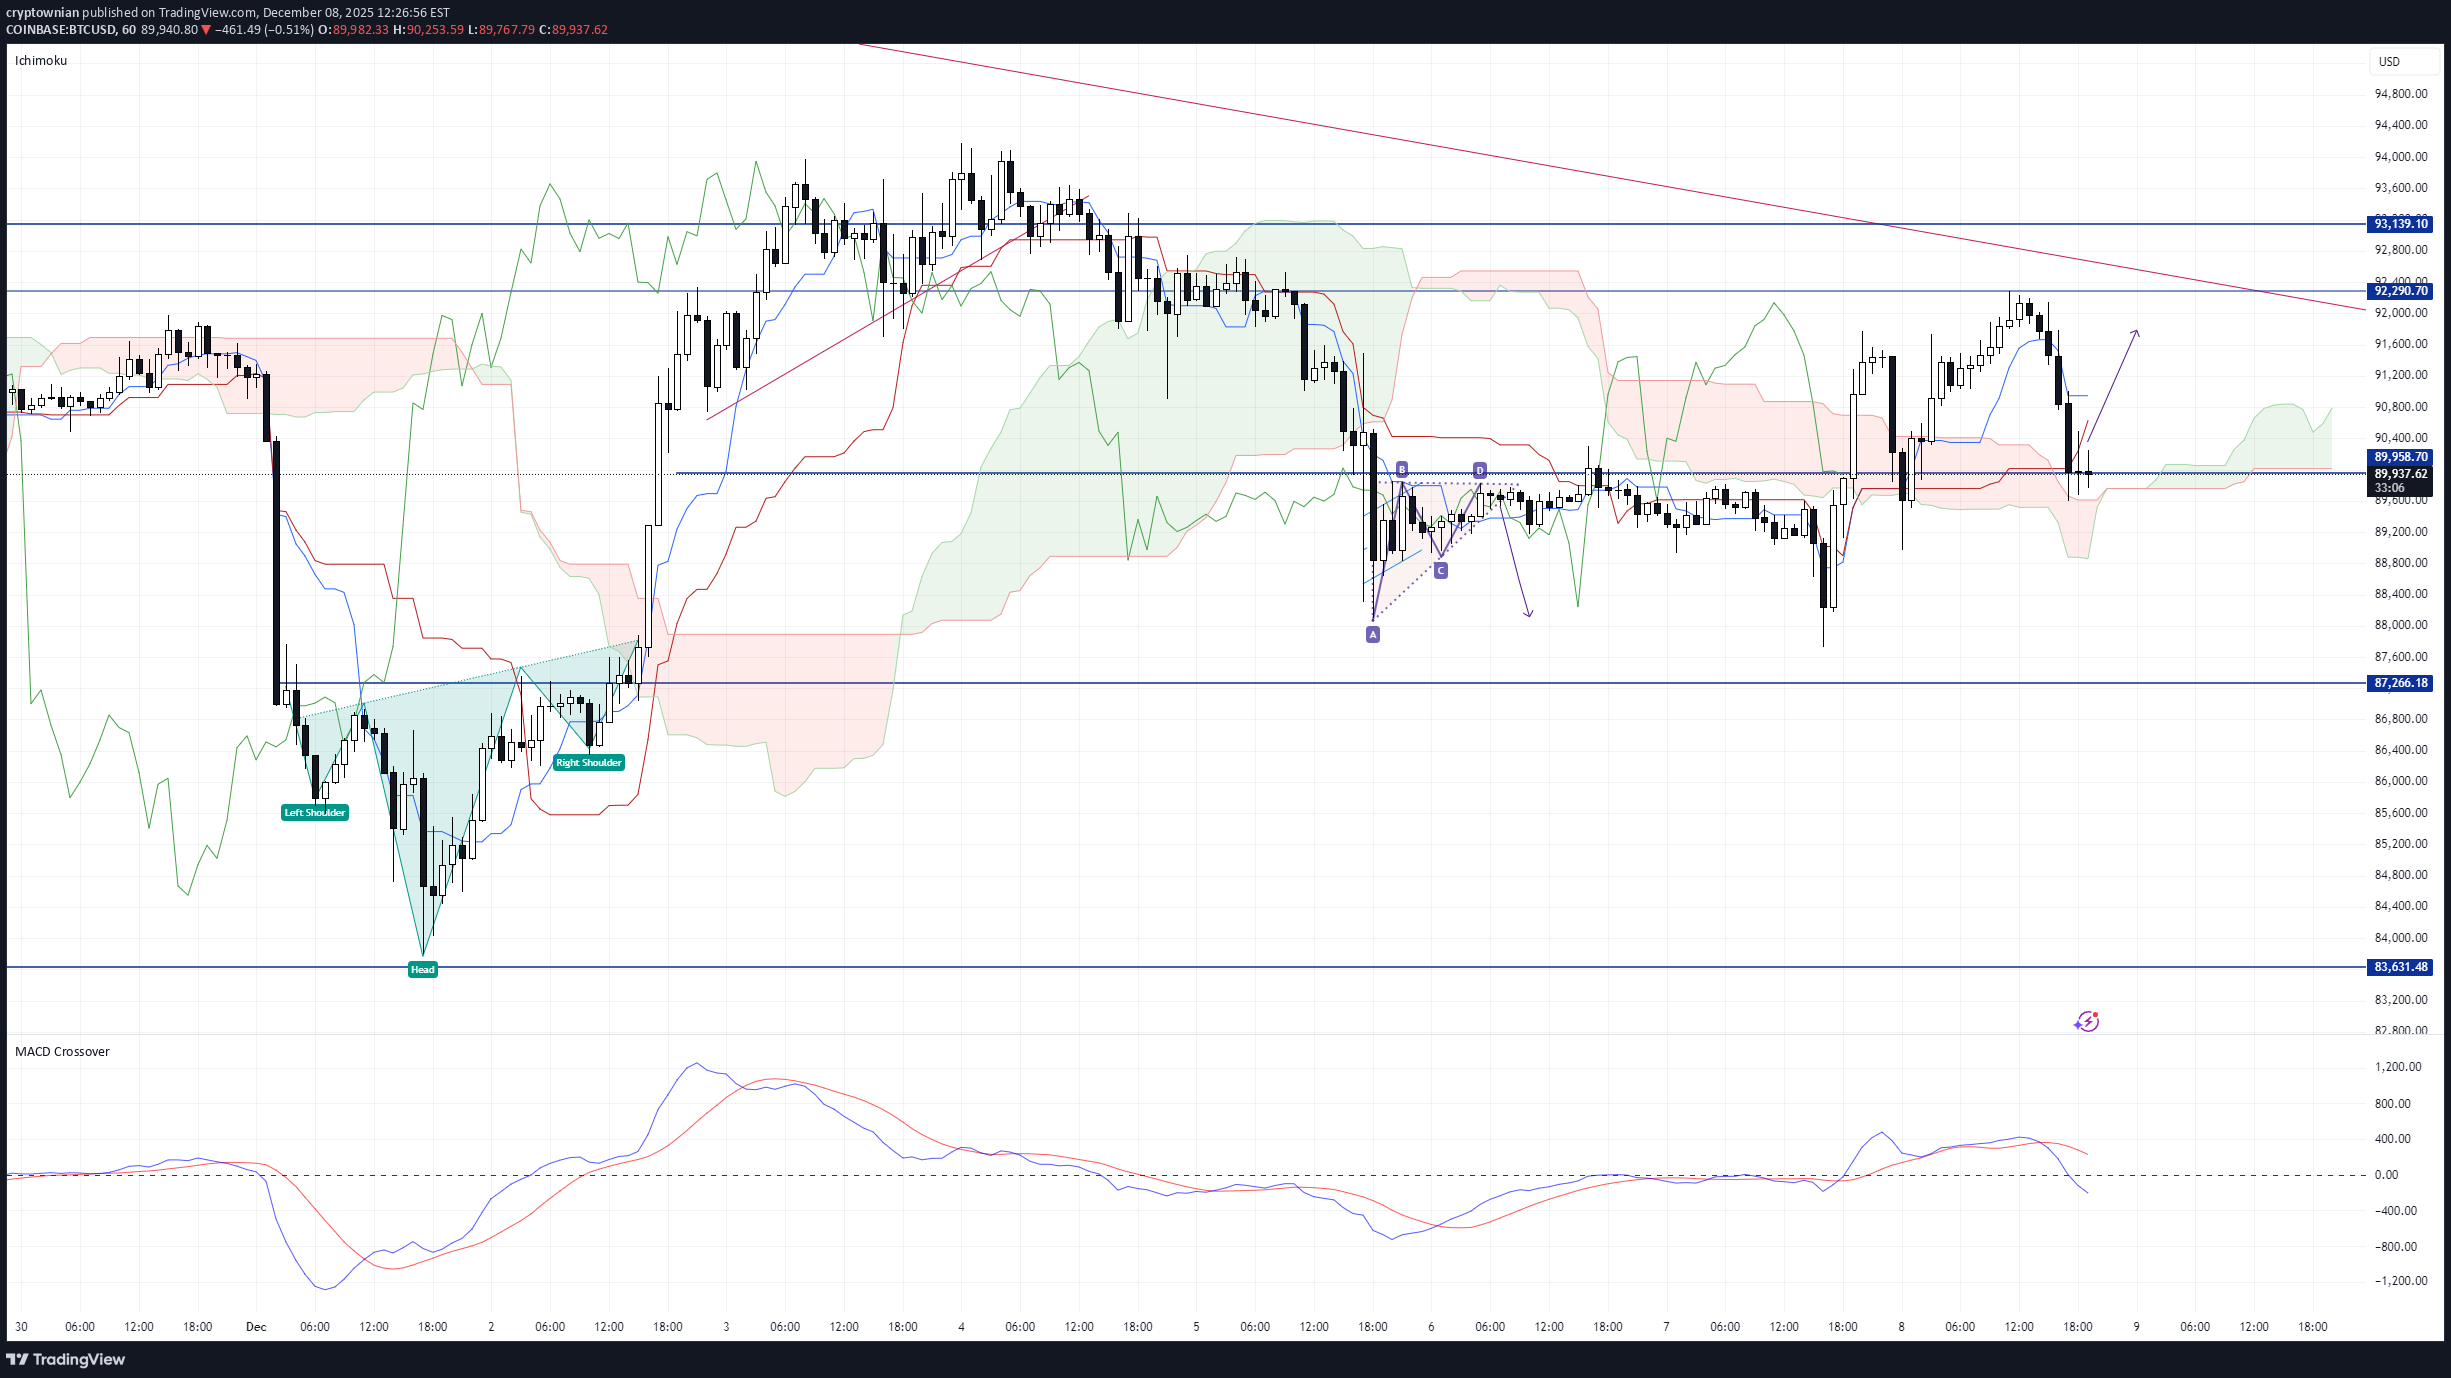
lets have a look at standard candle patterns and see what is possible at this current stage 1 btc usd ha made a double bottom and is testing the inner high of the W shape we see a double touch on the 30 min we see a bullish ingulfing pattern we see rejectoin at tis level it does not seem strong at this point but i think the importance of the level will reveal it self . the confirmation to me is a srtong candle above 90k on the 30 min time line the ris is sitting low the adx is showing a sign of dropping on the 1h the macd is still bearish along with the rsi so lets see where the buy is coming from at this point there is no clear buy so wating is the best option lets see where we are at 9pm south african time
KennyYenKen
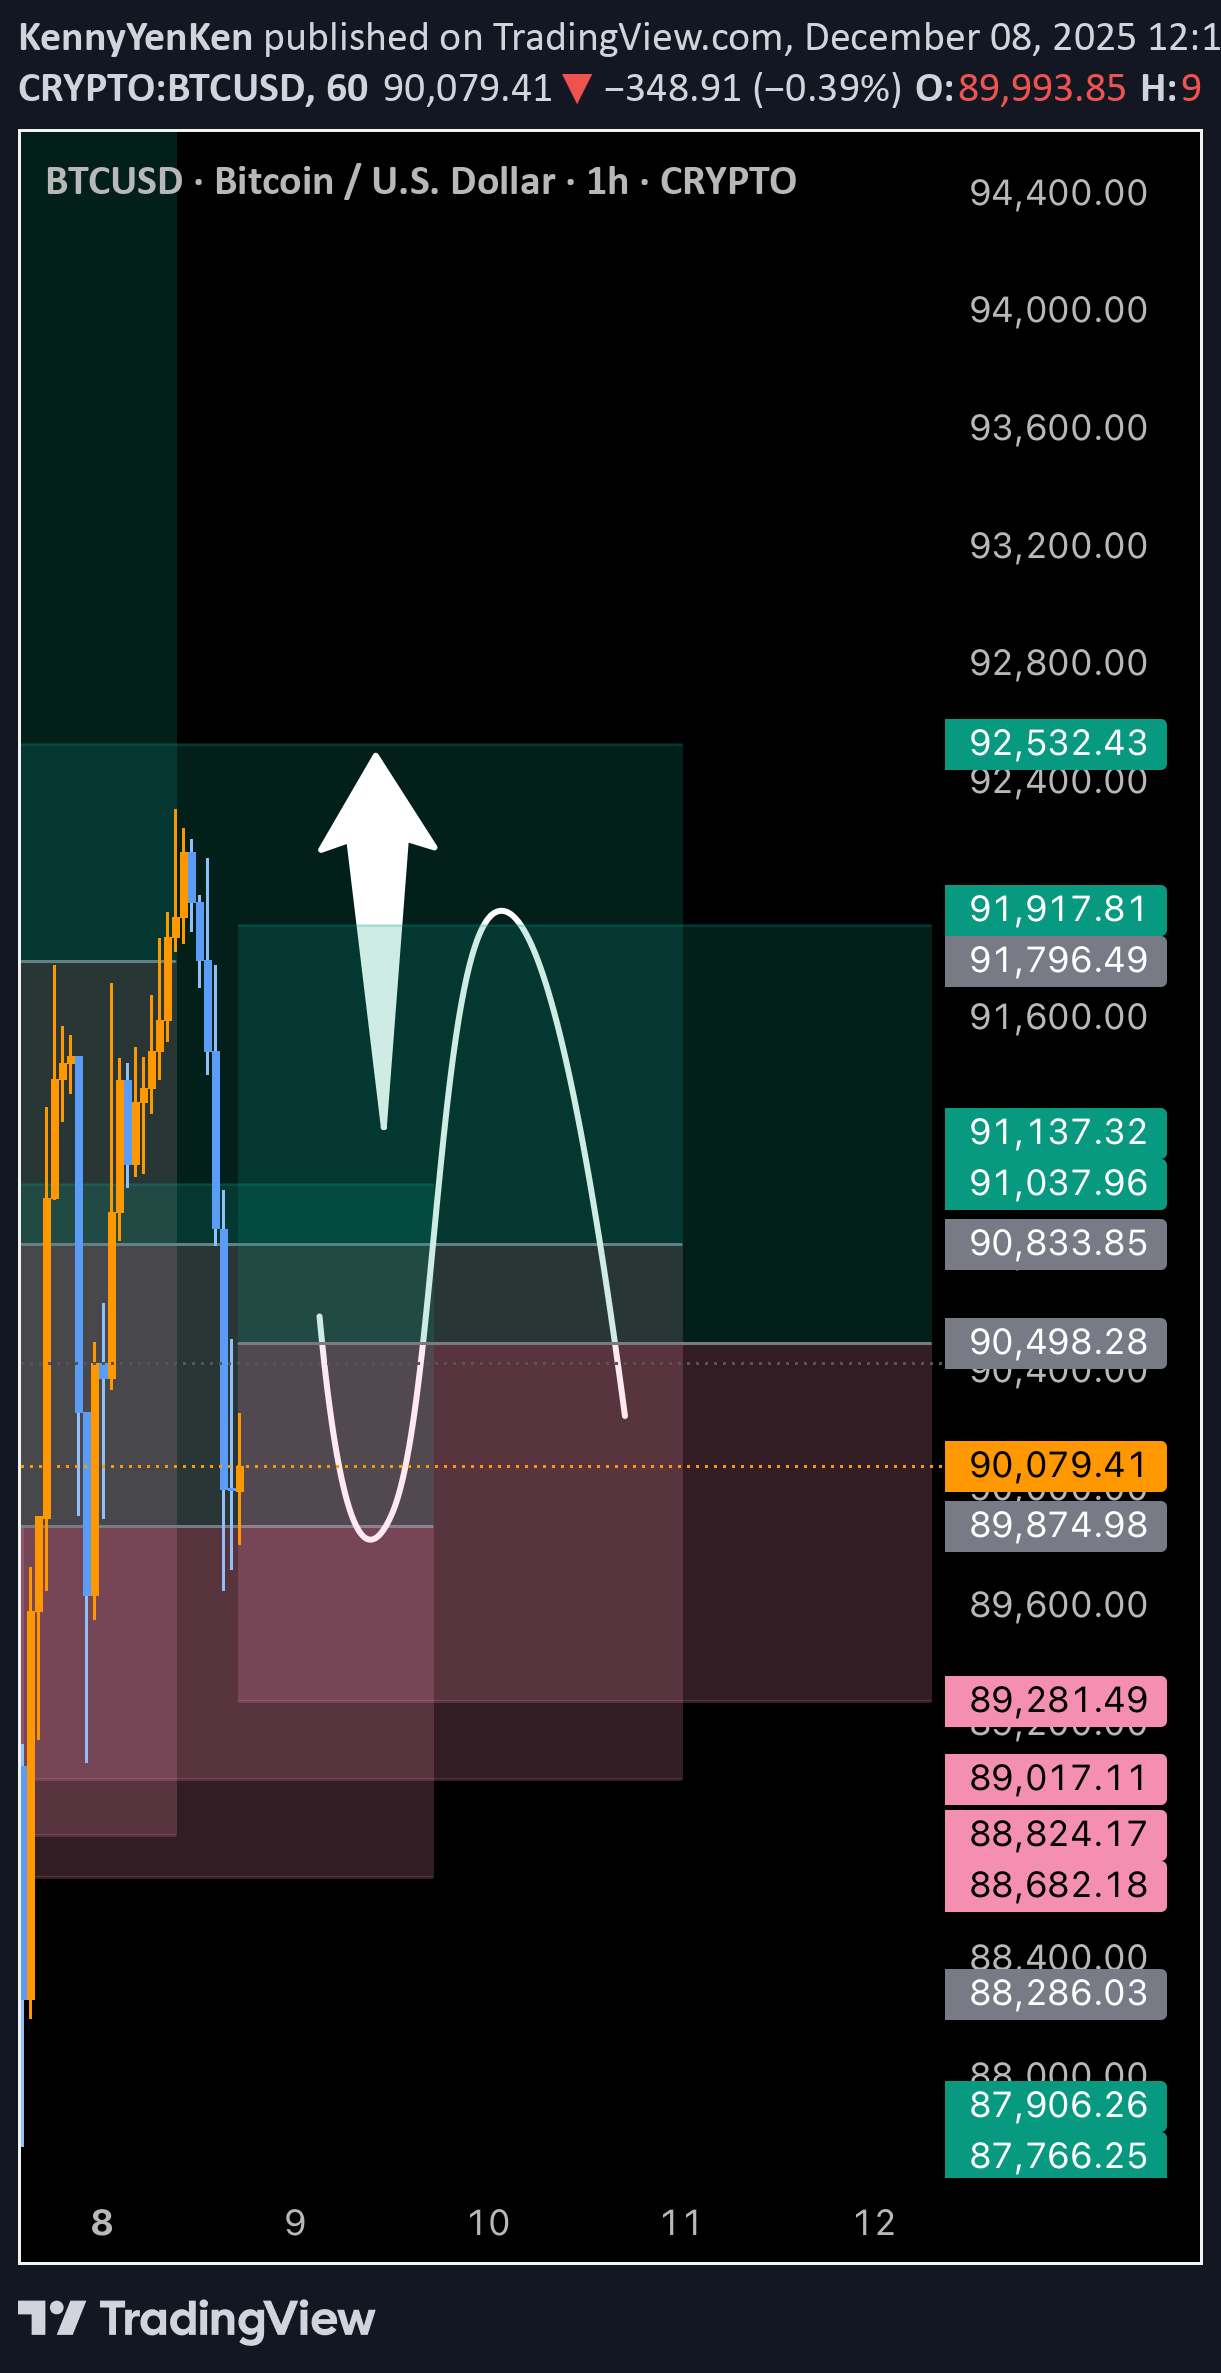
Btcusd buy signal , remember to close ( 50/50 ) when in a trade or quick scalping position to avoid hitting stops loss with no rewards , always trial stop as well
Disclaimer
Any content and materials included in Finbeet's website and official communication channels are a compilation of personal opinions and analyses and are not binding. They do not constitute any recommendation for buying, selling, entering or exiting the stock market and cryptocurrency market. Also, all news and analyses included in the website and channels are merely republished information from official and unofficial domestic and foreign sources, and it is obvious that users of the said content are responsible for following up and ensuring the authenticity and accuracy of the materials. Therefore, while disclaiming responsibility, it is declared that the responsibility for any decision-making, action, and potential profit and loss in the capital market and cryptocurrency market lies with the trader.