
DATA
Streamr
| Trader | Signal Type | Profit Price/Stop Loss Price | Publish Time | View Message |
|---|---|---|---|---|
No results found. | ||||
Price Chart of Streamr
Profit 3 Months :
Signals of Streamr
Filter
Sort messages by
Message Type
Trader Type
Time Frame

Crypto_alphabit

DATAUSDT #DATA / USDT Entry range (0.015- 0.017) SL 1D close below 0.01477 T1 0.020 T2 0.022 T3 0.025 T4. 0.040 _______________________________________________________ Golden Advices. ******************** * collect the coin slowly in the entry range. * Please calculate your losses before the entry. * Do not enter any trade you find it not suitable for you. * No FOMO - No Rush , it is a long journey.The price may come and retest (.013 - .014)price range

Alpha-GoldFX
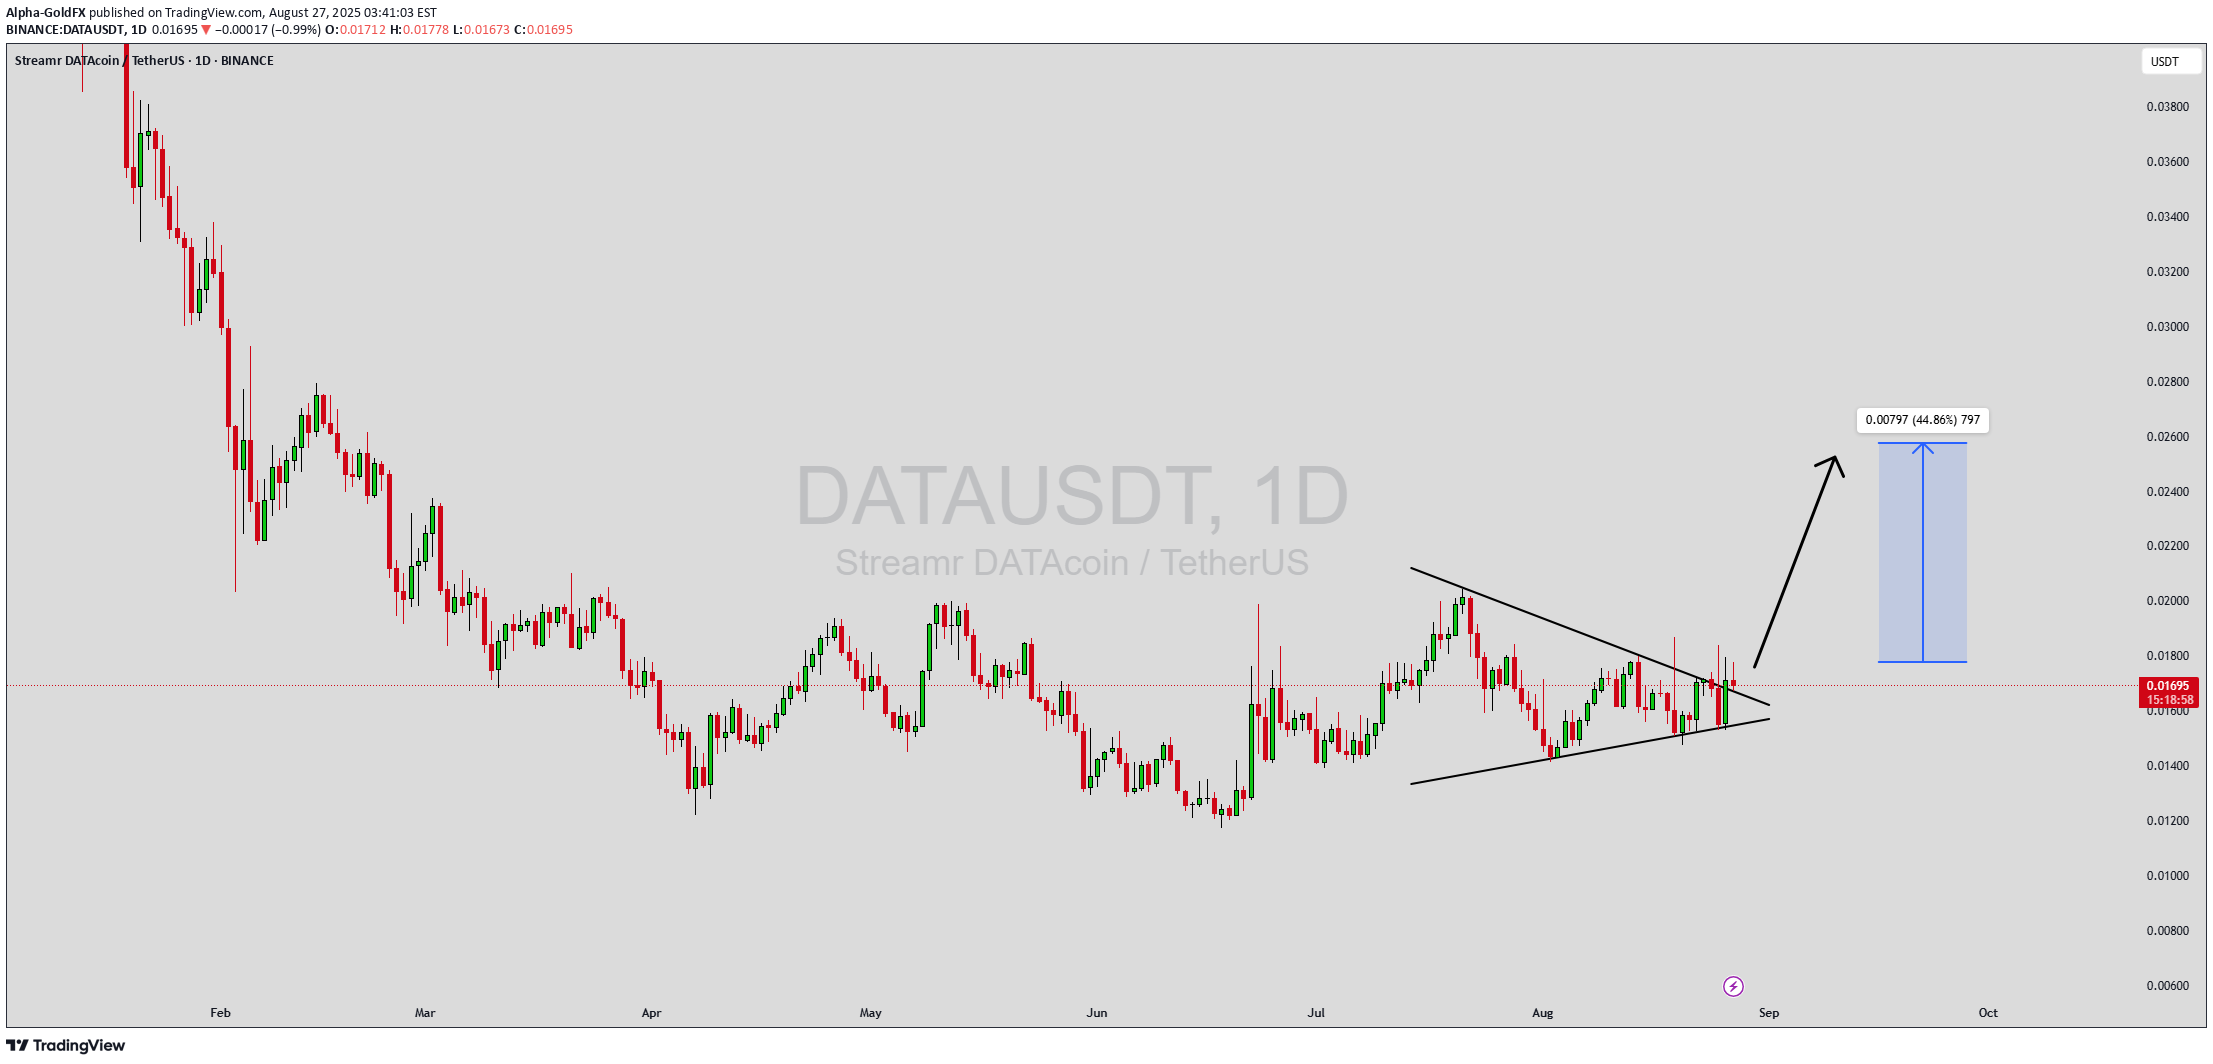
DATAUSDT is currently trading within a descending triangle pattern, a structure that often signals a decisive breakout move once the price reaches the apex. While descending triangles are sometimes considered bearish, in this case, the strong buying interest and healthy volume profile suggest the possibility of a bullish breakout. The repeated testing of the horizontal support level is showing that buyers are defending key zones, preparing for a potential upward reversal. The volume is aligning with the structure, showing increased market activity as price consolidates. A breakout above resistance could quickly accelerate momentum, paving the way for a potential 30% to 40% gain in the short to medium term. This makes DATAUSDT an attractive pair for traders watching for continuation patterns and accumulation signals. Investors are steadily taking interest in this project, as market sentiment strengthens around the possibility of growth in both adoption and price action. If the breakout is confirmed, DATAUSDT could capture significant attention, leading to further inflows of capital and price appreciation. Traders should keep a close eye on resistance levels, as a successful breakout may trigger a strong wave of bullish momentum. ✅ Show your support by hitting the like button and ✅ Leaving a comment below! (What is You opinion about this Coin) Your feedback and engagement keep me inspired to share more insightful market analysis with you!

Bithereum_io
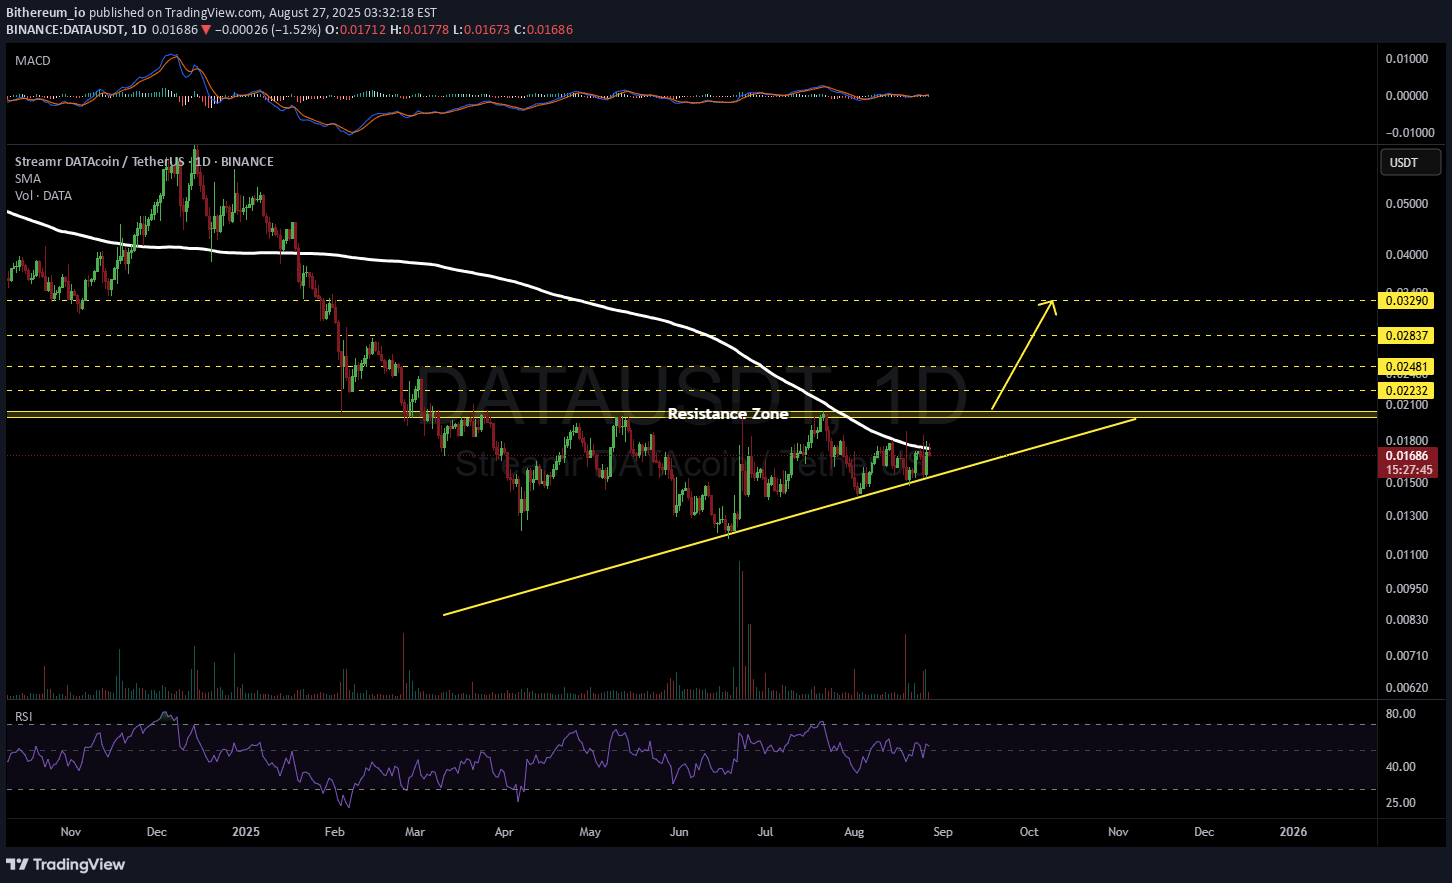
#DATA is forming an ascending triangle on the daily chart, with price holding above the ascending support line. Currently, the coin is consolidating below the major resistance zone. A breakout above this area could trigger a bullish move toward: 🎯 $0.0223 🎯 $0.0248 🎯 $0.0283 🎯 $0.0329 On the other hand, failure to hold the ascending trendline could invalidate this setup. ⚠️ As always, use a tight stop-loss and apply proper risk management.

TopChartPatterns
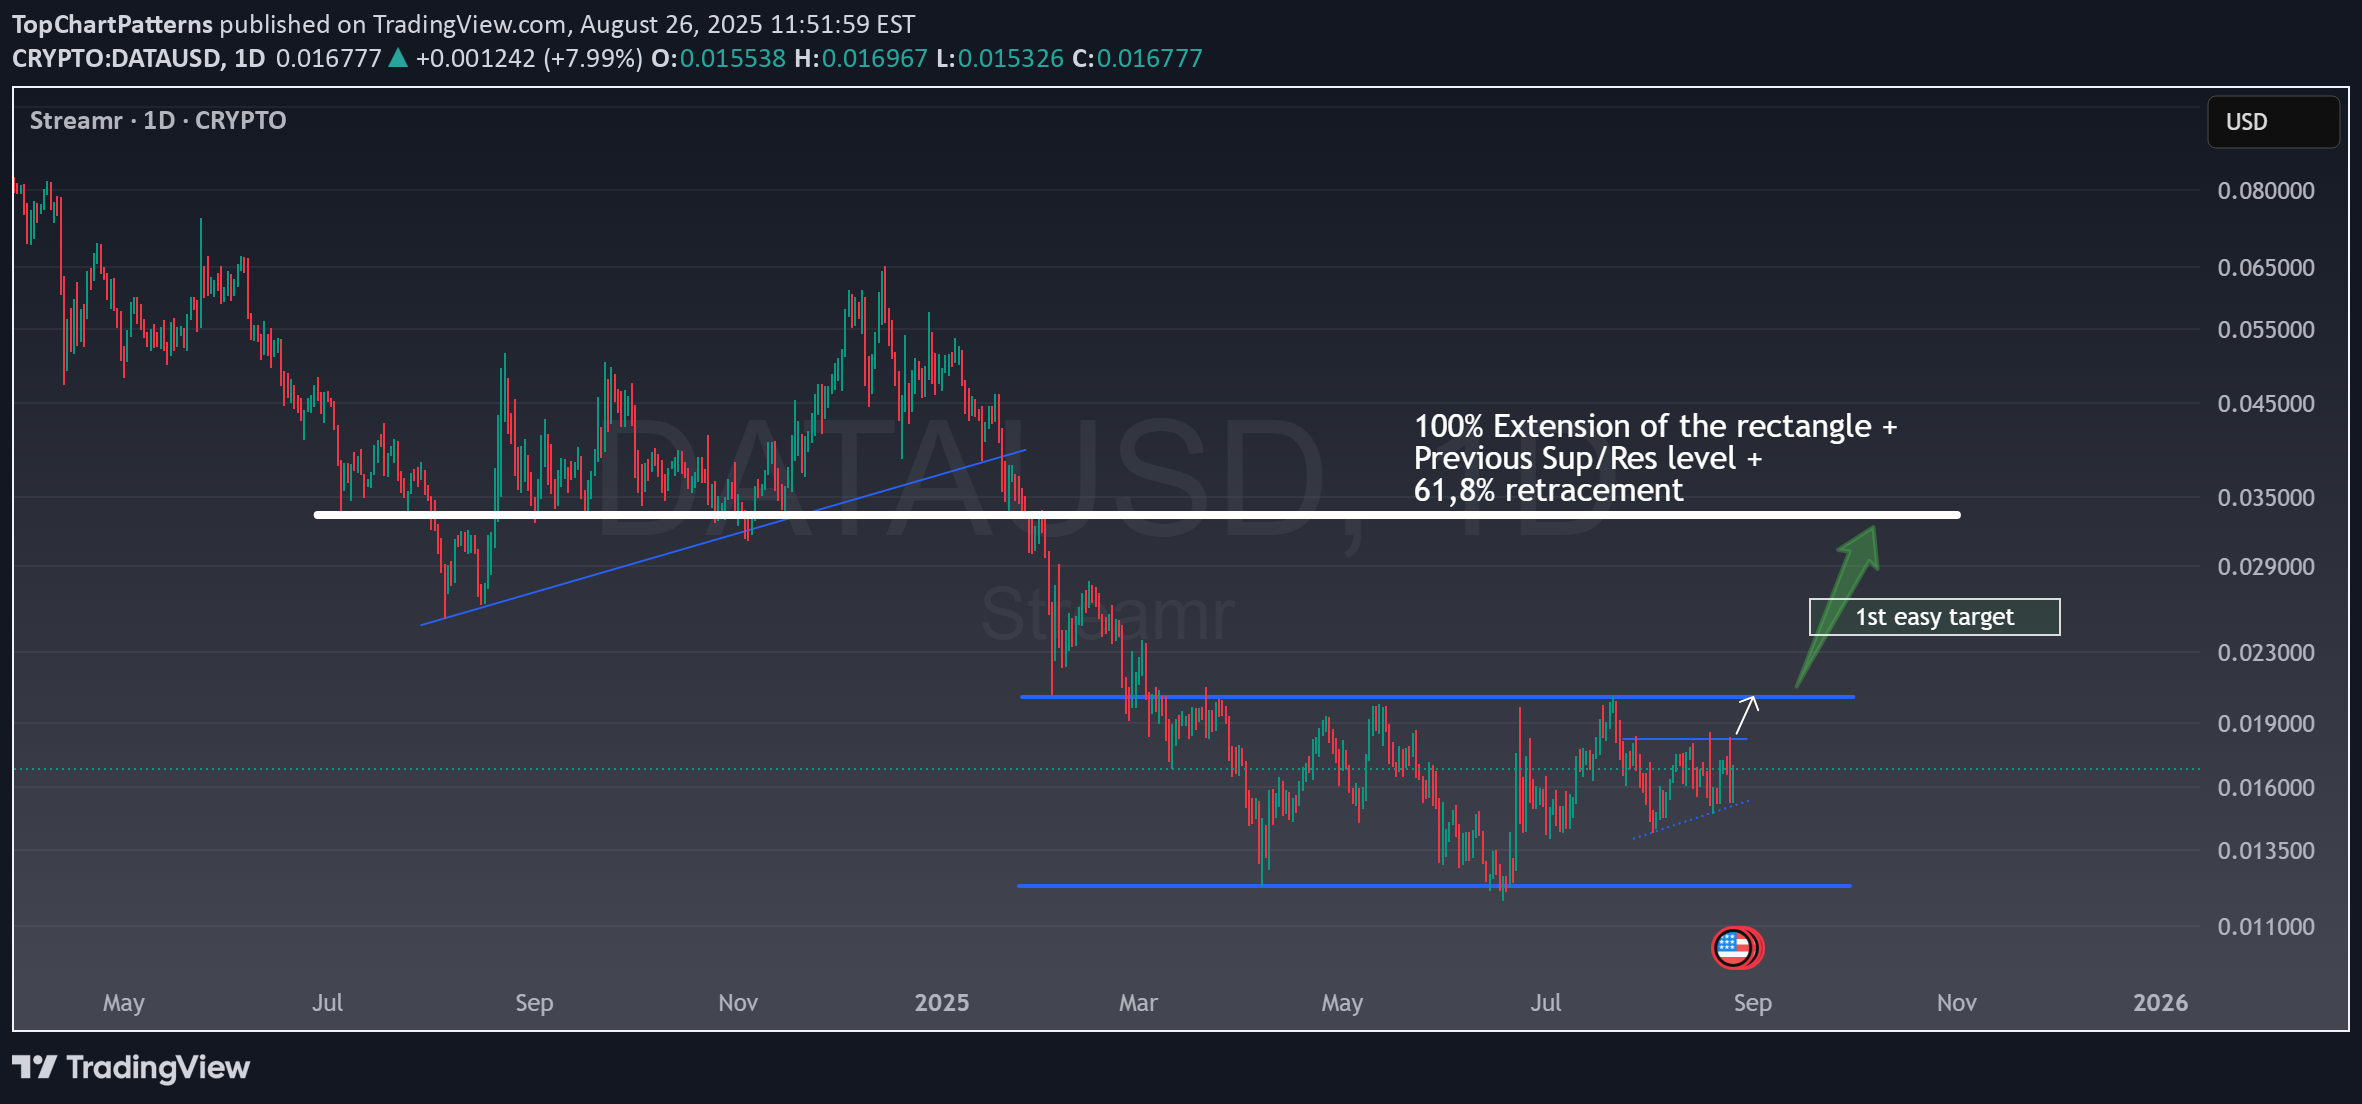
Rectangle Breakout on the Radar I’ve been watching DATA for a while and what really caught my eye is this rectangle pattern that’s been forming on the daily chart. Rectangles are one of my favorite setups, they look boring while price is stuck between support and resistance, but once they break, they can move fast and clean. Some past examples: Continuation rectangle in daily BTC: Trend change rectangle: Right now, DATA is pressing against the upper boundary, and if we get a proper breakout, I’m looking at around 0.023 as a first easy target. The real prize, though, is closer to 0.035 , where we’ve got a strong confluence: 100% extension of the rectangle, a major support/resistance flip, and the 61.8% retracement of the last leg down . This level will be key in case the rectangle breaks upwards. From a trading perspective, I like the numbers here: I’m risking roughly 5% if the breakout fails, but there’s potential for +60% upside if the move extends. That’s the kind of risk/reward I don’t mind taking. As for the project itself, Streamr has been quiet compared to the big names, but I think it’s still one of those tokens with an interesting niche (decentralized data economy). If momentum comes back into mid-cap alts, this could easily surprise to the upside. And as said inprevious post, BTC cycle is almost finished! For me, this is a classic “wait for the breakout, then ride the wave” setup.

MasterAnanda

Easy and mid-term, within 3 months. Good morning my fellow Cryptocurrency trader, I hope you are having a wonderful day. We can look at the same pairs over and over, it makes it easier to trade. Or, we can look at new pairs and new charts. Endless opportunities this market has to offer. The good thing about trading the same pair is that you can get the jump and the drop if your entry, exit and timing are right. We get to buy at support and hold. We get to sell at resistance when prices go up. If resistance is good and strong, since we already sold it is possible to go SHORT. You sold because prices are dropping correct? The game becomes more advanced the more we trade. DATAUSDT (Streamr DATACoin) has been moving within a sideways channel and also within a long-term accumulation zone. Most of the year, since March, DATAUSDT has been trading low within the "opportunity buy zone." The best time to buy before prices go up. Action today is moving above EMA8 and EMA34. We still have a higher low vs early August and mid-June. Market conditions continue to improve. The first target shows 174%, more or less. The way to approach this target depends on your strategy. You can sell a small portion at this level, say 10-20%, or it can be ignored. Some people can decide to close an entire position after a big and nice double-up, others continue to hold. Another way which is very common for passive traders, huge/high profits but only simple and waiting, is to wait for higher targets. Track the market, follow the market and spot when prices are low. Take advantage of the buy zone and hold. In this scenario, we simply wait for ~500%, collect profits and move on. The choice is yours. I am not sharing financial advice. All the information is my experience only, opinions and translation of the charts. As an adult, you are responsible for your own actions and their results. You do the deposits, the clicking, the choices, the amounts, the transactions. You collect the profits, you also keep the loss. It is all yours. If I win, all profits are mine to keep. If I lose, it is my loss. There is no blaming others for our blunders. To win big, win fast, win more and continue to win long-term, we have to take responsibility for our actions. We have to learn from our mistakes. Thank you for reading. Namaste.
Crypto_alphabit

DATAUSDT #DATA/ USDT Entry range (0.01500- 0.01600) SL 4H close below 0.00.01498 T1 0.0180 T1 0.0198 _______________________________________________________ Golden Advices. ******************** * collect the coin slowly in the entry range. * Please calculate your losses before the entry. * Do not enter any trade you find it not suitable for you. * No FOMO - No Rush , it is a long journey.Price came to the entry rangeSorry it was high risk and very low rewards
Alpha-GoldFX
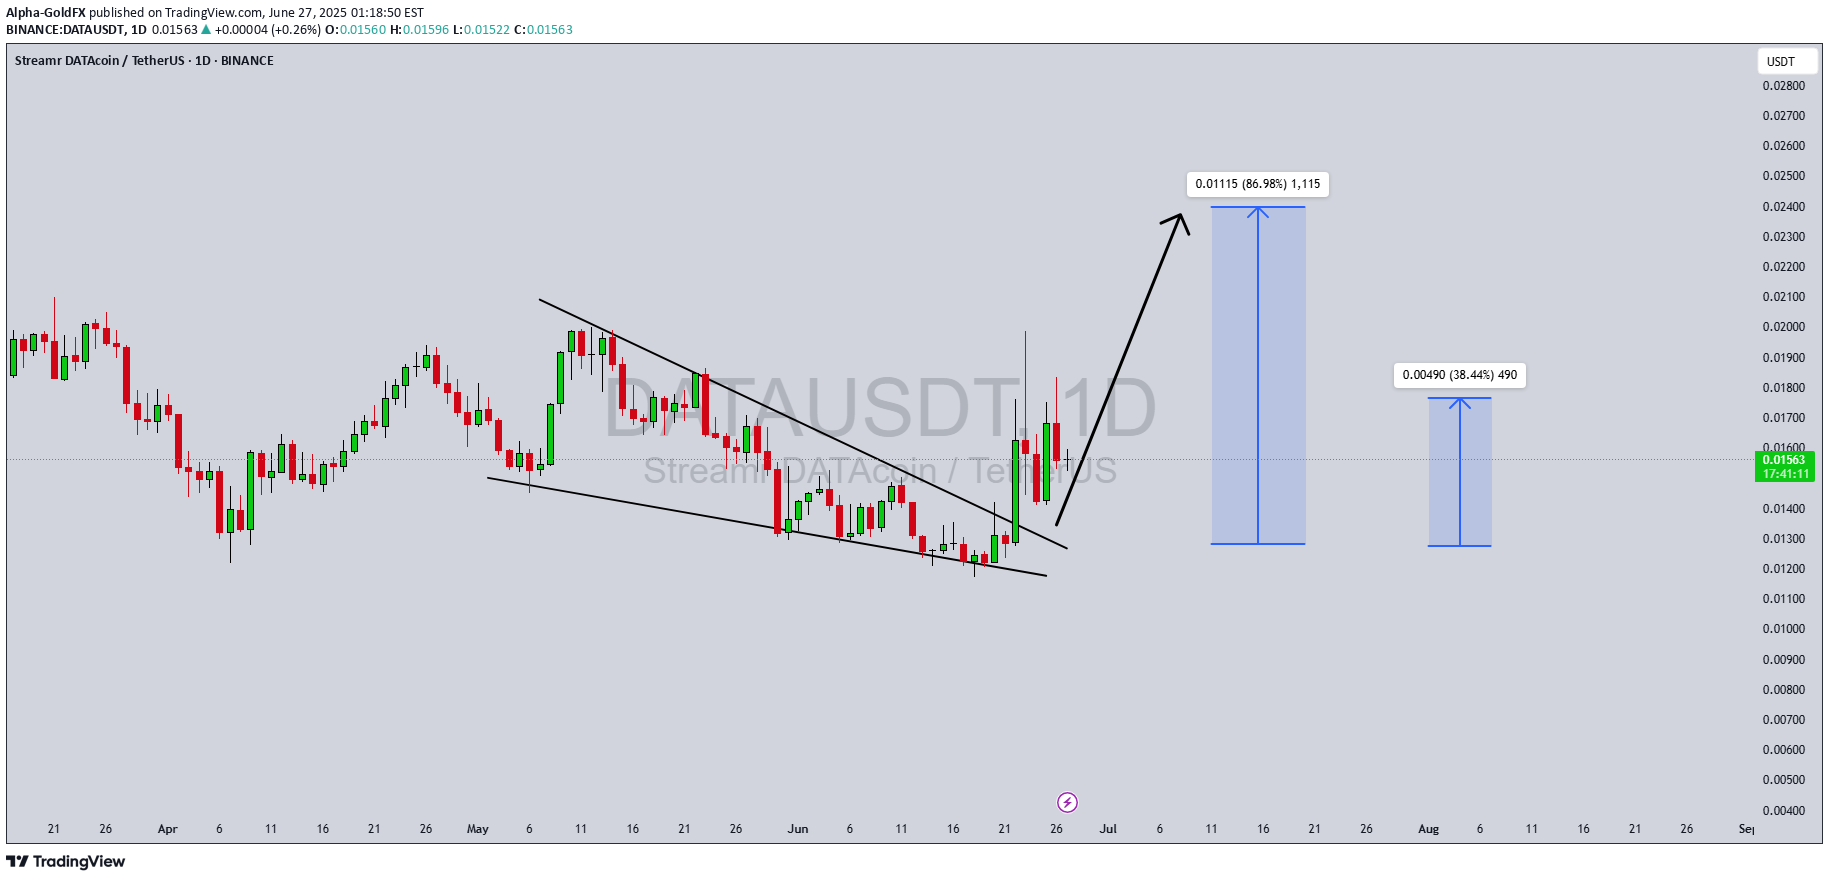
DATAUSDT is showing strong bullish potential after breaking out from a falling wedge pattern—a classic technical indicator often followed by significant upward momentum. The breakout from this compression zone suggests that bullish pressure is returning to the market, and a rally may be in play. With the recent surge in price action, traders are eyeing an expected gain of 80% to 90%, especially as volume supports the breakout confirmation.The Streamr project, which underpins DATA, is gaining traction for its real-time decentralized data-sharing protocol. As interest in Web3 and decentralized data ecosystems grows, investors are beginning to recognize the long-term utility of DATA. The recent pattern breakout reflects increasing investor confidence and accumulation at lower levels, setting the stage for potential explosive moves.The technical structure is clean, with a well-defined wedge breakout, a strong impulsive move, and a retest of previous resistance as support. This setup is ideal for swing traders and mid-term investors looking for high-probability entries. If momentum sustains, price could quickly push toward the upper targets, making this one of the stronger bullish setups currently on the radar.With market sentiment leaning towards recovery and altcoins beginning to attract capital flows, DATAUSDT is well-positioned to benefit from broader bullish trends in the crypto space. Keeping an eye on volume and continuation patterns will be key in managing this trade effectively.✅ Show your support by hitting the like button and✅ Leaving a comment below! (What is You opinion about this Coin)Your feedback and engagement keep me inspired to share more insightful market analysis with you!
MasterAnanda

This is the altcoins market bullish confirmed. The bottom happened 7-April 2025. This week we have a higher low; period.This higher low confirms what I've been saying that we are bullish. Now, Streamr is a classic pair, and thus it has a classic chart and many other projects move in the exact same way. So you can know what many are doing and will be doing by looking at this chart.The bottom came in April and now we have a higher low. This higher low is a retrace from the initial bullish breakout. From this higher low we will get very strong, sustained long-term growth. We are talking about months of bullish action. Can be 3-6 months. Spot traders can continue to accumulate (buy and hold). The current retrace is an opportunity to buy-in, buy more, rebuy and reload at the best possible prices before the 2025 high-bullish momentum bull market.I will keep it simple as this chart is meant to show that the bullish potential, bias and chart structure cannot be broken unless we get lower lows.Even if the 7-April low is challenged, we know this is a stop-loss hunt event because a new low would require the extension of the previous low rather than the same level being tested.Anyway, we are going up and this growth will happen long-term. Think June, July, August, September, October, November... And on and on.Thank you for reading.If you enjoy the content, you can follow for more.Namaste.

Kapitalist01

takip amaçlıyatırım tavsiyesi değidlir.,,,,,,,,,,,,,,,,,,,,,,,,,,,,,,,,,,,,,,,,,,,,,,,,,,,,,,,,,,,,,,,,,,,,

abbas6138

The growing volume in past 24hours alarms the big buyers (yellow bars) are trying to pump the Data to moon soon! First it must recover its power after BTC dump panic...overcome to trendline
Disclaimer
Any content and materials included in Finbeet's website and official communication channels are a compilation of personal opinions and analyses and are not binding. They do not constitute any recommendation for buying, selling, entering or exiting the stock market and cryptocurrency market. Also, all news and analyses included in the website and channels are merely republished information from official and unofficial domestic and foreign sources, and it is obvious that users of the said content are responsible for following up and ensuring the authenticity and accuracy of the materials. Therefore, while disclaiming responsibility, it is declared that the responsibility for any decision-making, action, and potential profit and loss in the capital market and cryptocurrency market lies with the trader.