Technical analysis by vodoo666 about Symbol AAPLX on 10/28/2025

Apple Inc (AAPL) – All-Time High Break and Demand Structure
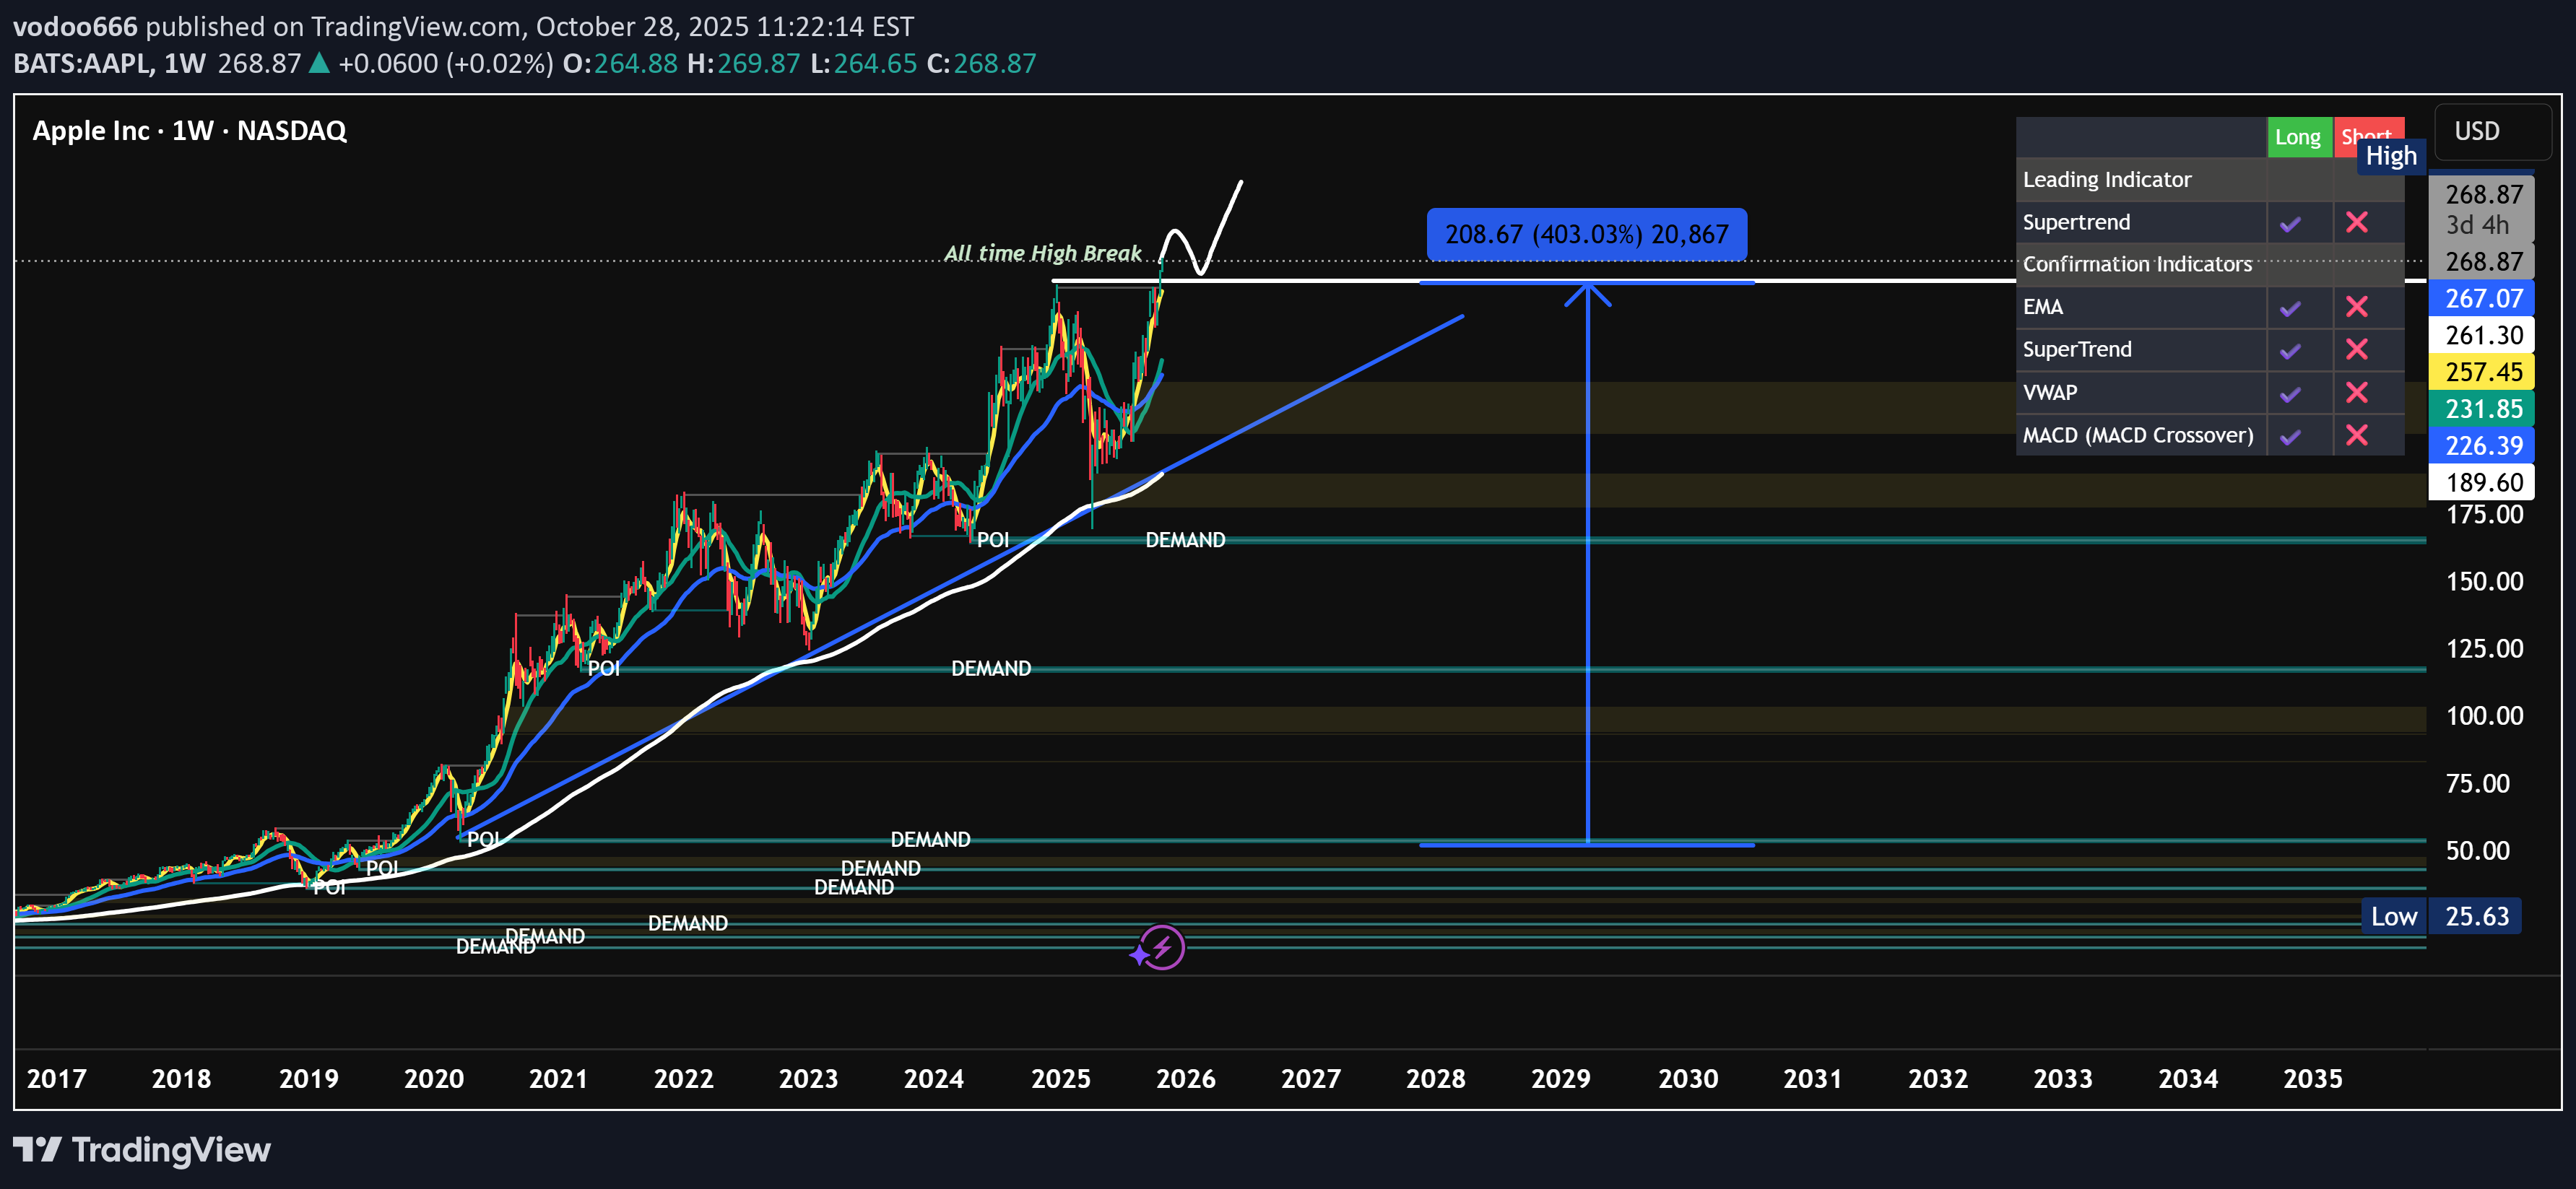
Apple continues to display one of the strongest technical structures among large-cap equities. The price action has respected multi-year demand zones and continues to advance in a controlled parabolic channel, signaling strong institutional order flow and long-term accumulation behavior. 1. Multi-Year Demand Structure Each pullback into a demand zone since 2019 has produced a strong bullish reaction, confirming active institutional defense at key points of interest (POIs). The structure showcases consistent higher highs and higher lows, a textbook uptrend aligned with long-term exponential moving averages and anchored VWAP support. The most recent reaction off the weekly demand near $130 - $135 marks another strong reaccumulation phase. This region acted as a liquidity pocket where large orders were likely absorbed before initiating the next expansion wave. 2. All-Time High Break and Price Discovery Price has now decisively broken above the all-time high, entering a fresh price discovery phase. Such breakouts often attract momentum buyers and algorithmic inflows, but historically, Apple tends to consolidate briefly above new highs before continuing its trend. The current projection suggests a measured move toward $208 - $210, which represents approximately +40% from the breakout level. This target is derived from the vertical measured range of the prior accumulation base and Fibonacci extension alignment. 3. Indicator Confluence Key indicators are showing strong trend confirmation: EMA Cluster: All major EMAs are stacked bullishly and acting as dynamic support. VWAP: Anchored VWAP from the previous high sits below price, confirming that institutional cost basis remains positive. SuperTrend: Flipped bullish on the weekly timeframe, signaling trend continuation. MACD: Crossed bullish above the zero line, aligning with the macro bullish momentum shift. Together, these indicators confirm that price structure is healthy, with momentum and liquidity aligned for continuation rather than exhaustion. 4. Smart Money and Institutional View Apple’s current behavior fits the smart money model of accumulation → manipulation → expansion. The manipulation phase occurred during the deep retracement in 2022–2023, where retail sentiment turned bearish while institutions accumulated within the demand blocks. The ongoing breakout represents the expansion phase where smart money distributes into higher liquidity as price advances. 5. Long-Term Outlook If Apple continues to respect the ascending demand trendline and sustains above the all-time high zone, the next major liquidity cluster lies near $208 – $210. Beyond that, a long-term projection suggests that a full cycle expansion could carry price toward the $260 – $270 region over the next few years, especially if macro conditions remain favorable for large-cap tech. Key Levels Current Price: 147.27 Support / Demand Zones: 135.00 – 140.00 and 120.00 – 125.00 Short-term Target: 208 – 210 Long-term Projection: 260 – 270 Invalidation: Sustained close below 130.00 Summary Apple has officially entered a new phase of price discovery following its all-time high breakout. The multi-year demand structure, strong institutional flow, and technical indicator confluence all point to sustained bullish momentum. The first major target zone remains $208 - $210, while the long-term projection sits near $260+, supported by macro bullish sentiment in the Nasdaq and strong fundamental resilience. A brief retest of the breakout zone could occur, but dips into the 135–140 area would likely be absorbed aggressively by institutional buyers, maintaining the long-term uptrend.