Technical analysis by ClassicallegendFx about Symbol BTC on 10/31/2025

ClassicallegendFx
BTC/USDT – Key Support & Resistance Outlook
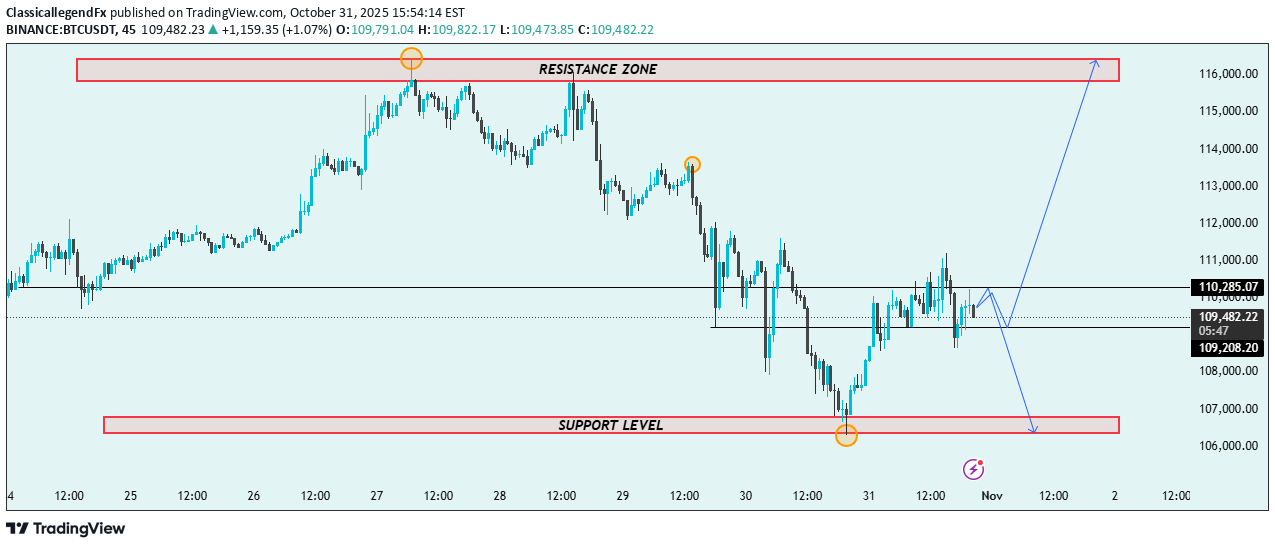
🔹 Chart Overview: The chart highlights two critical price zones: Resistance Zone: Around 115,500 – 116,000 🧱 Support Level: Around 106,000 – 107,000 🛡️ Currently, price action hovers near 110,000, showing mixed signals within this mid-range structure. 📈 Bullish Scenario (Blue Arrow Up): If BTC holds above 109,000 support and breaks 111,000 resistance, we could see a strong upward push toward the 115,000–116,000 zone 🎯. This move would confirm a bullish reversal from the recent low. Key confirmation: Break & retest above 111,000 ✅ Momentum continuation with volume 🔥 📉 Bearish Scenario (Blue Arrow Down): However, if BTC fails to sustain above 109,000–110,000, a rejection could lead to another drop toward 107,000 support ⚠️. This would maintain the range-bound structure between these two zones. Key warning signs: Lower highs near 111,000 ❌ Breakdown below 108,500 → strong bearish signal 🐻 🎯 Trading Summary: Resistance Zone: 115,000 – 116,000 💥 Support Zone: 106,000 – 107,000 🧱 Current Bias: Neutral-to-bullish (watch for breakout confirmation) Next Targets: Upside ➡️ 115,000+ Downside ➡️ 107,000 📌 Conclusion: BTC/USDT is consolidating between strong support and resistance. A breakout above 111,000 could trigger a bullish wave 🌊, while failure may result in a retest of 107,000 support 📉.