Technical analysis by RSI_Trading_point about Symbol SOL: Sell recommendation (11/11/2025)

RSI_Trading_point
(SOL/USDT 1H timeframe...
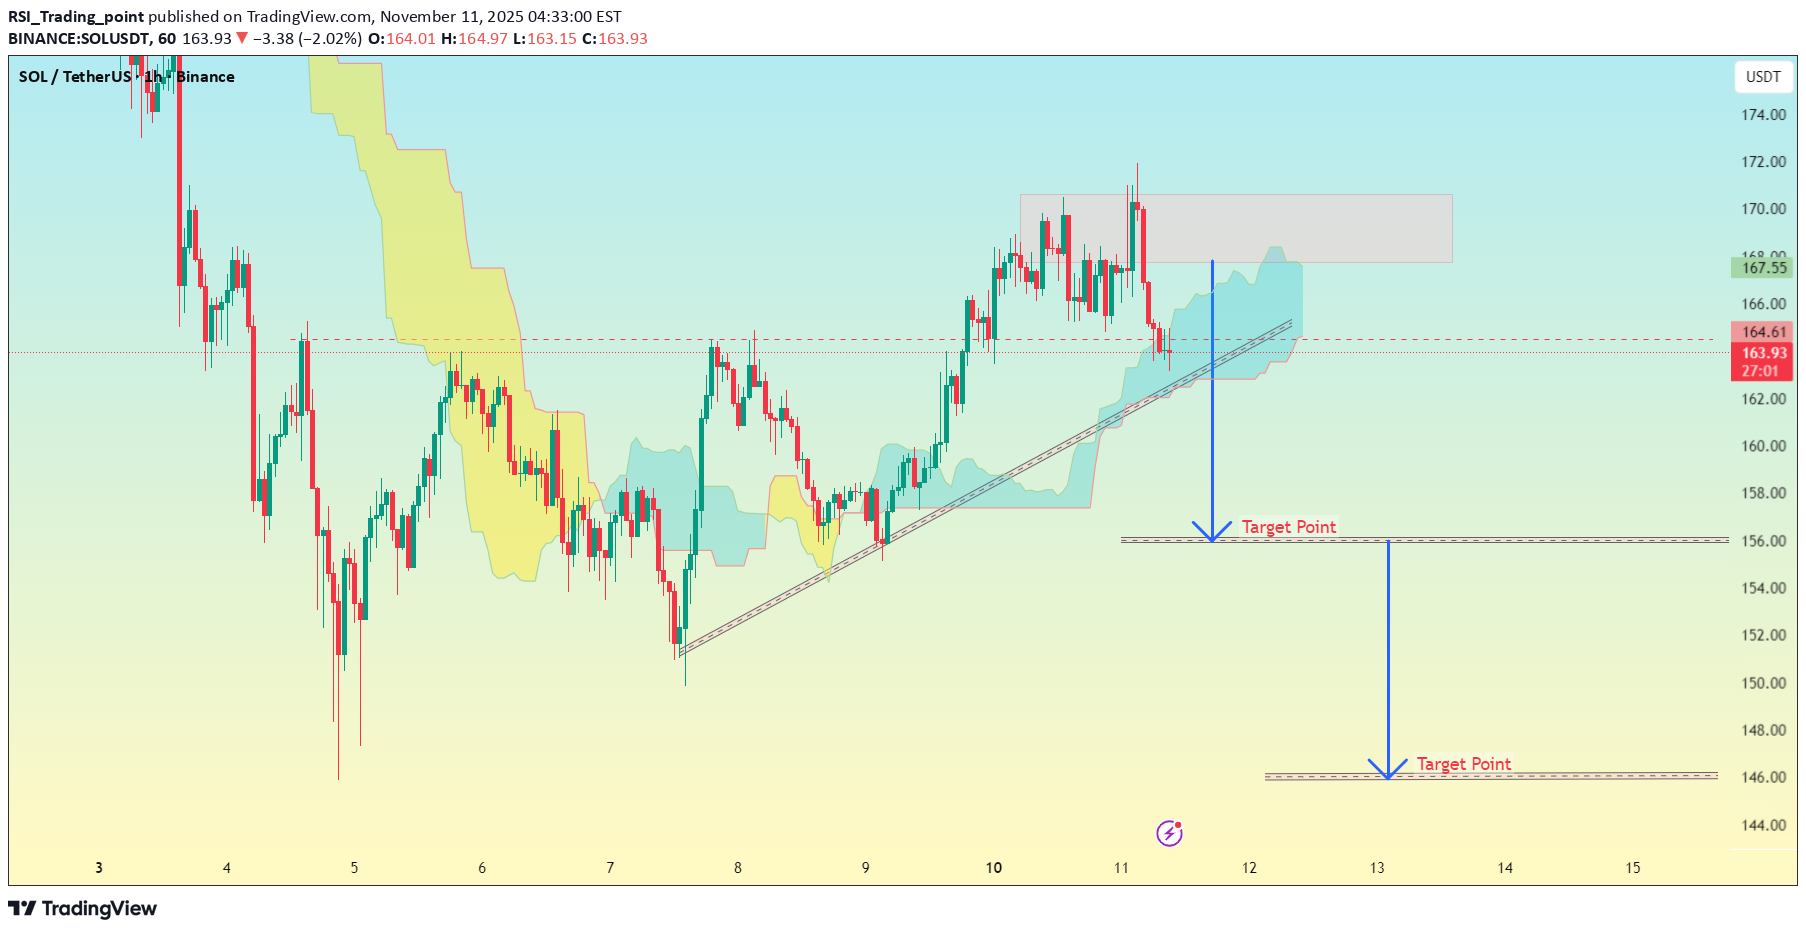
(SOL/USDT 1H timeframe on Binance): Here’s what I can interpret from the structure shown: Current Price: Around $164 Support Trendline: Rising from around $158 → $164 (now price has slightly broken or retested this line) Resistance Zone: Highlighted in red box near $169–$172 Two Target Points are drawn on the chart: 🎯 Target 1: The first blue arrow (labeled Target Point) points to around $156. → This is likely the first downside target after trendline break. 🎯 Target 2: The second blue arrow (lower one) points to around $146–$147. → This is my extended or final bearish target if the price continues falling. --- 🔍 Summary: Level Type Target Zone Target 1 Short-term $156 Target 2 Major target $146–$147 --- ⚠ Tip: If SOL closes below $162 on 1H or 4H candle → high chance to move toward $156. If it loses $156 support, then $146 becomes realistic. But if SOL reclaims and closes above $168–$170, the bearish setup fails and bullish continuation toward $174+ can begin.trade active