Technical analysis by Mentor_Michael03 about Symbol BTC: Sell recommendation (11/25/2025)

Mentor_Michael03
Supply, Demand & Range Shift: Bitcoin’s Tactical Path
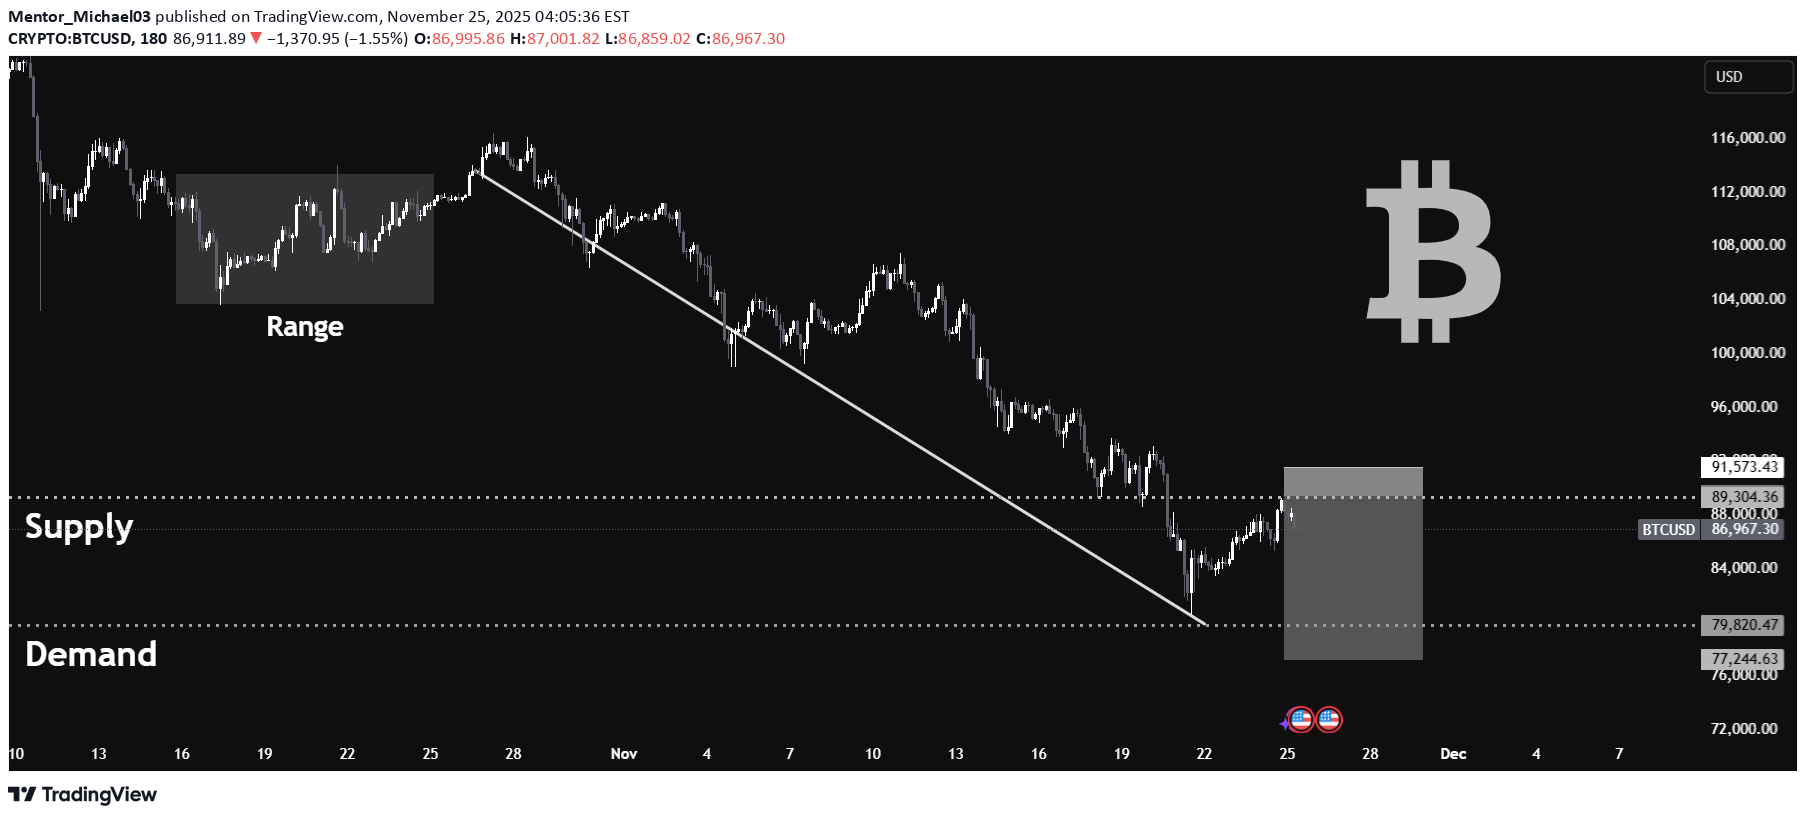
Technical Analysis Bitcoin is undergoing a marked structural transition, as evident on the recent chart. The price action has exited a sustained range, characterized by tight consolidation, and shifted into an impulsive downward leg. Range Breakdown: The period of stability (highlighted “Range”) gave way to new volatility. This transition initiated a pronounced downtrend, confirmed by repeated lower highs and a decisive break of the descending trendline. Supply & Demand Zones: Supply: The zone above $91,500 signals heavy overhead pressure, where sellers have repeatedly absorbed rallies. Demand: Layers around $77,250 to $79,800 represent robust buy-side defense—these are filled with unexecuted orders from earlier lows. Liquidity Structure: Price is oscillating between established liquidity pools. The retracement into the supply zone may invite aggressive responses from sellers, but a hold above demand could open recovery scenarios. Directional Bias: Currently, bearish control dominates as long as price remains below the broken trendline and fails to reclaim the supply overhead. Watch for reversal signals at demand that could ignite short-term bullish momentum. Key Levels: Resistance: $91,573; pivot for short squeeze or further rejection. Support: $77,244; anchor for bullish defense. Conclusion Bitcoin is at a strategic inflection: recovering buyers must defend demand zones to regain momentum, while sellers remain in control near supply. The next move will be defined by how price interacts with these critical liquidity areas—follow confirmation and watch for engineered volatility near the boundaries.tradingview.com/x/0bs6IsOE/Bitcoin BTC chart is active