
Bixley2
@t_Bixley2

What symbols does the trader recommend buying?
Purchase History
Trader Messages
Filter
Message Type
Bixley2
SOLUSD - Ascending Triangle
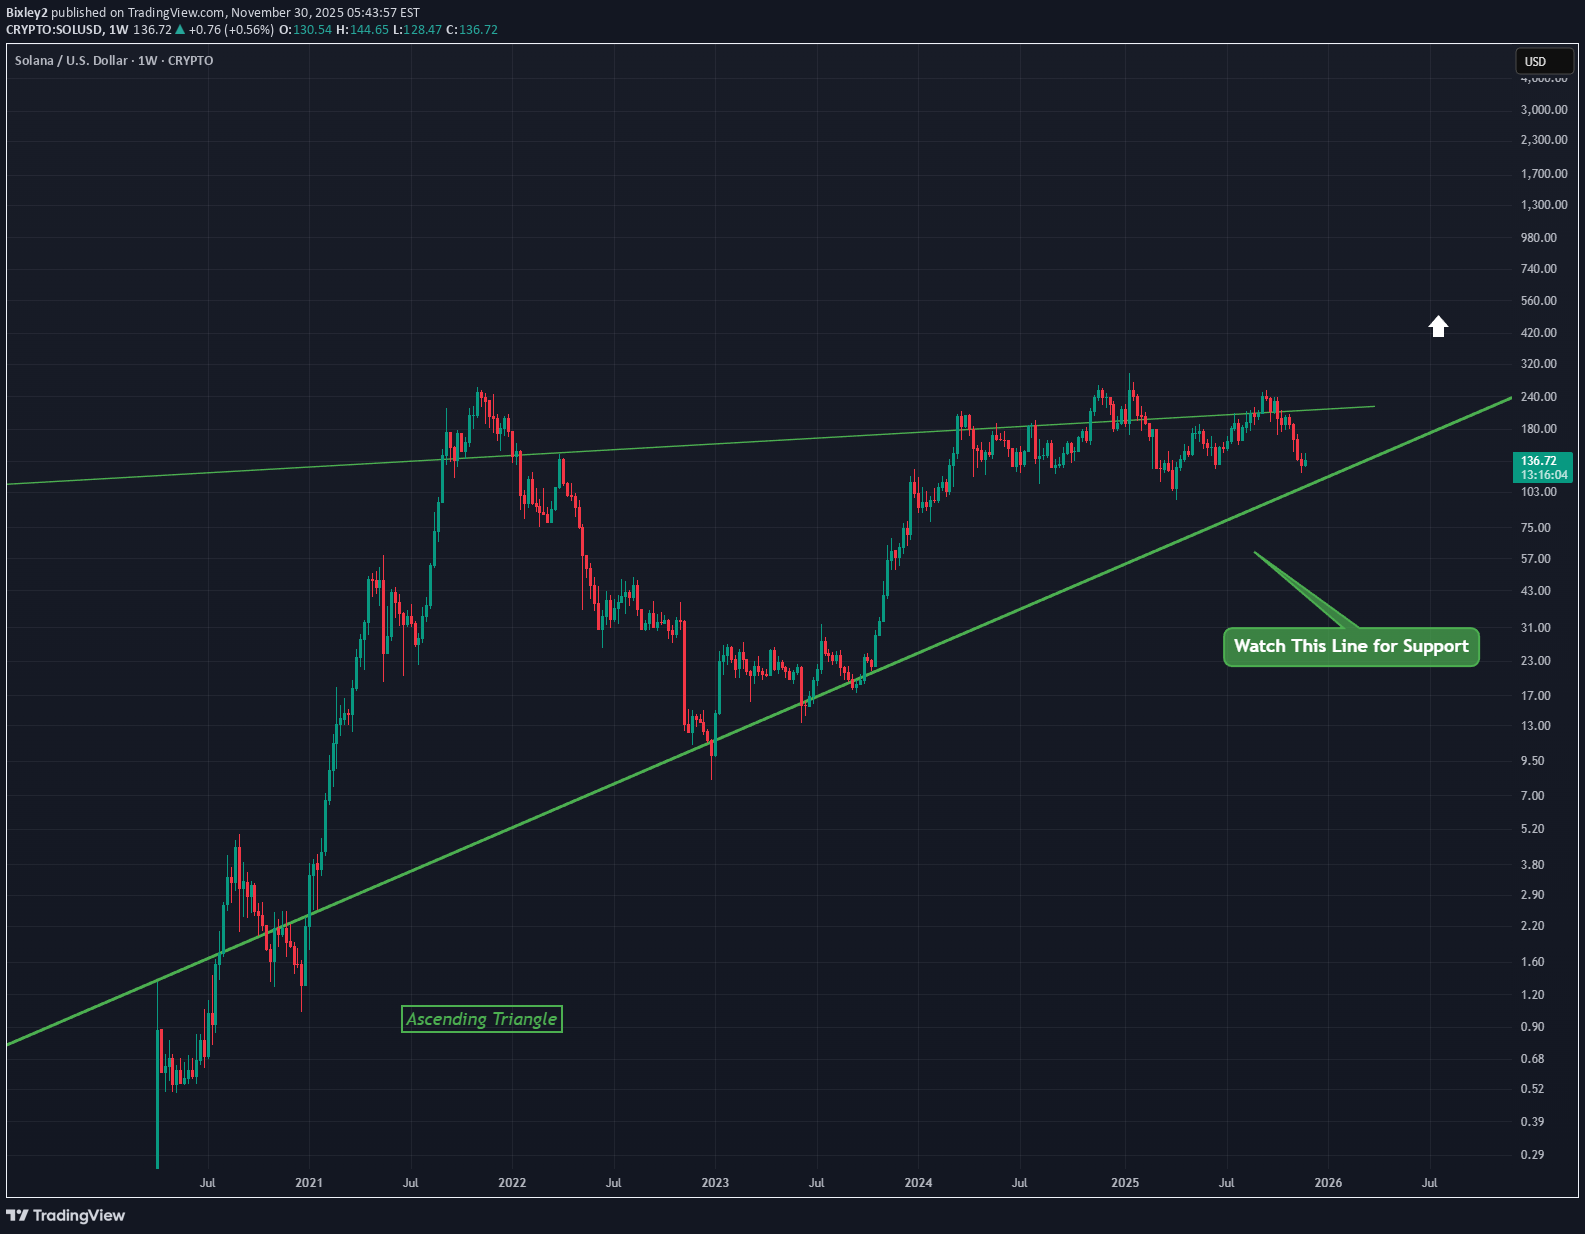
A bullish ascending triangle on SOLUSD Watch the lower line to confirm support and then break out potential This is the Weekly chart so long term good for Solana
Bixley2
Catch XRP's Run Early
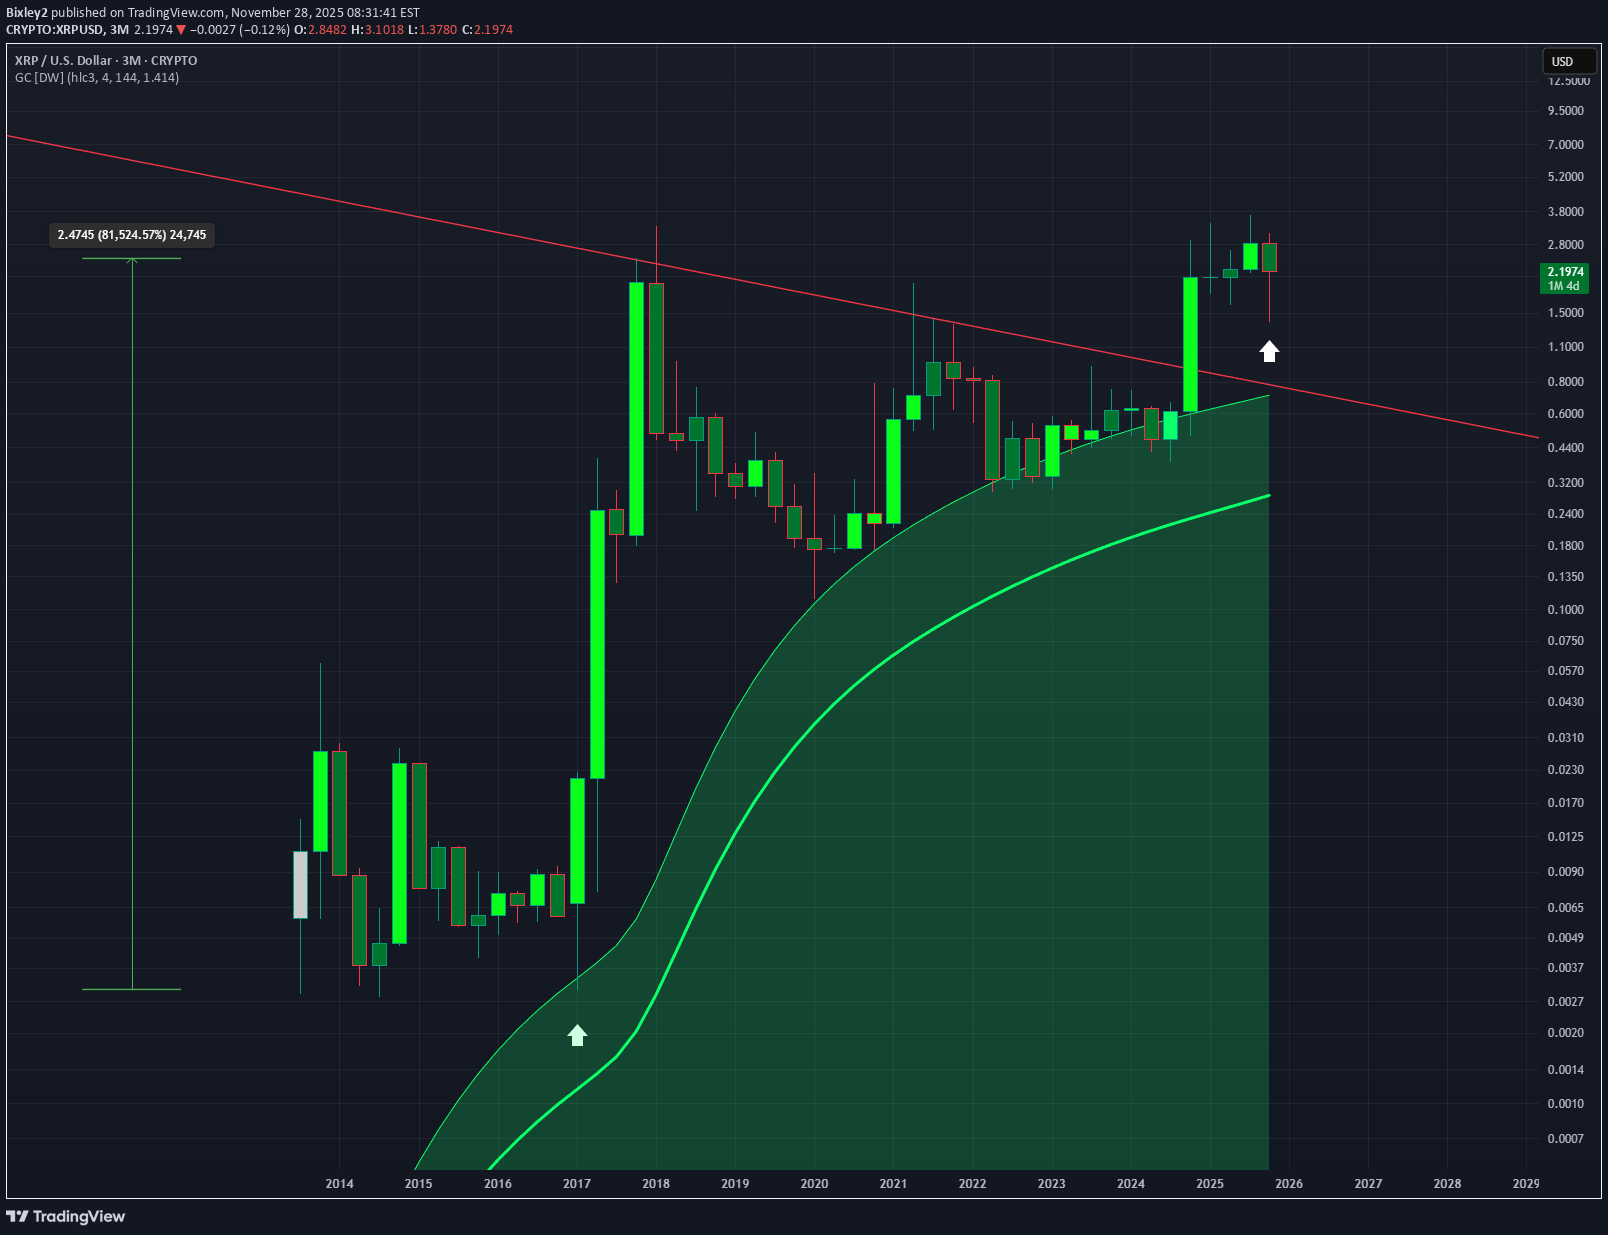
This is the 3 month timeframe for XRP but it shows a clear pattern of support along the upper line of the Gaussian Channel indicator A breakout has already begun but there is potentially more to this run if you compare it to the first bull run. Support will be found above the broken trend line in red
Bixley2
ETHUSD - Inverted H&S
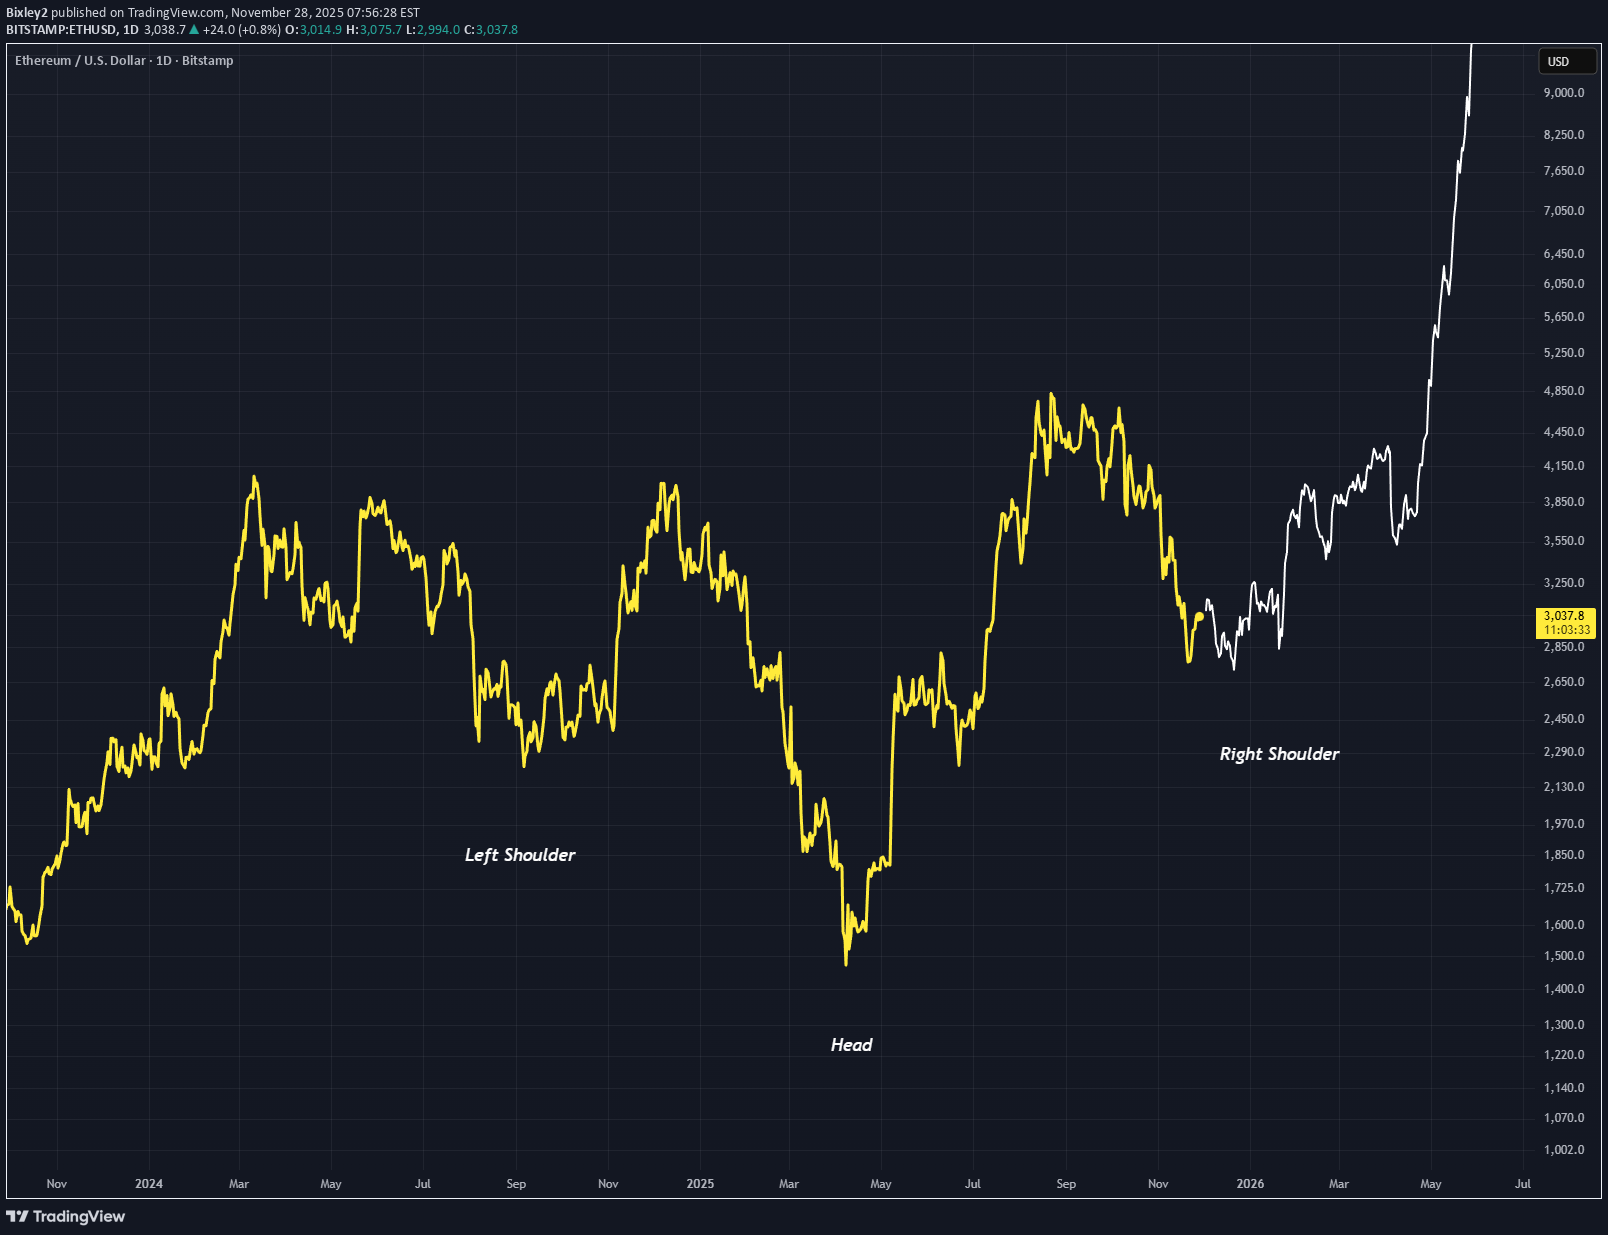
An inverted H&S pattern forming with only the right shoulder yet to complete. I expect following the right shoulder upward movement to come, not sure how much but it will be there. Chart pattern analysis on this daily timeframe. Alt season?
Bixley2
LTCUSD - Symmetrical Triangles
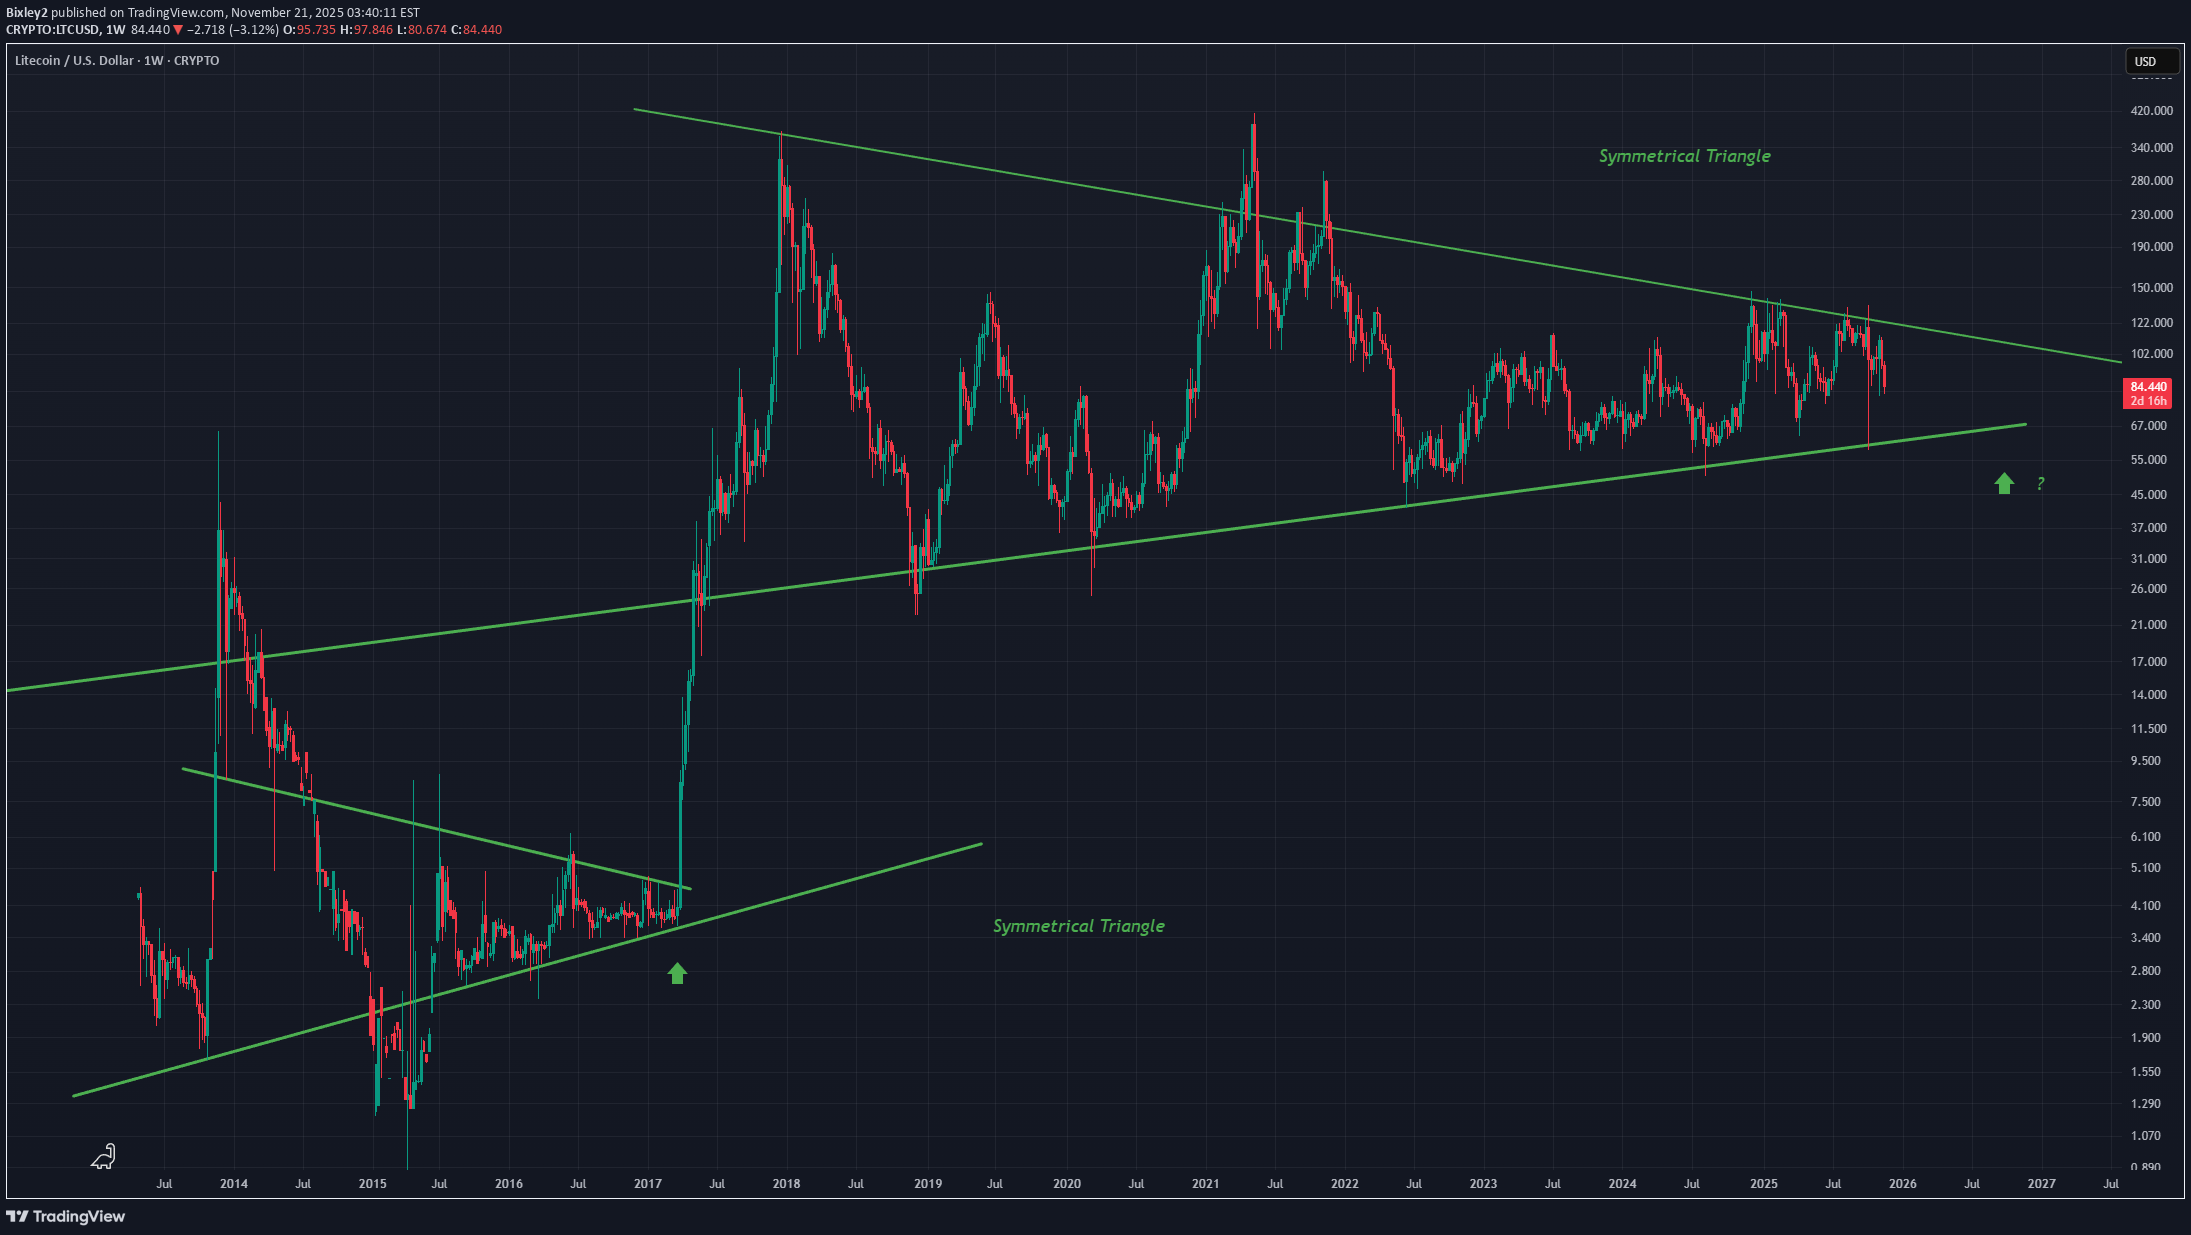
As seen in the first symmetrical triangle a massive break out followed If the second is anything like the first we can expect a breakout like that one I have posted this chart before but it really is a strong bull option for a long term altcoin. Weekly timeframe
Bixley2
ETHUSD - Further Bearish Scenario

A double top scenario between last bull runs peak and the current action seen is an idea that ive come across. Price may not go up at all and retest the dotted line in red in a bearish action I dont expect this as much as I expect the occurrence of a late altcoin bull run. Weekly chart
Bixley2
ETHUSD - Log Band Indicator

Indicator shows that the top band is being tested Places in circles are of similar movement, both containing a retest of this line I still believe in an alt szn Weekly chart
Bixley2
Continuation of the "AI Bubble"

A chart for NVDA that illustrates the parabolic curve on this very large timeframe To expect a curve like this to break is unlikely AI will have huge implications The potential of AGI aswell is huge for humanity in general. I don't see a bubble at all. Weekly timeframe
Bixley2
ETHUSD - Maintain Trend Line

Daily chart for ETHUSD suggesting that this trend line on this chart will be maintained an a strong altseason will ensue with ETH increasing faster than BTC. This can be seen by comparing BTC dominance and ETH dominance aswell. ETHD going up, BTCD going down.
Bixley2
BCHUSD - Resistance Broken
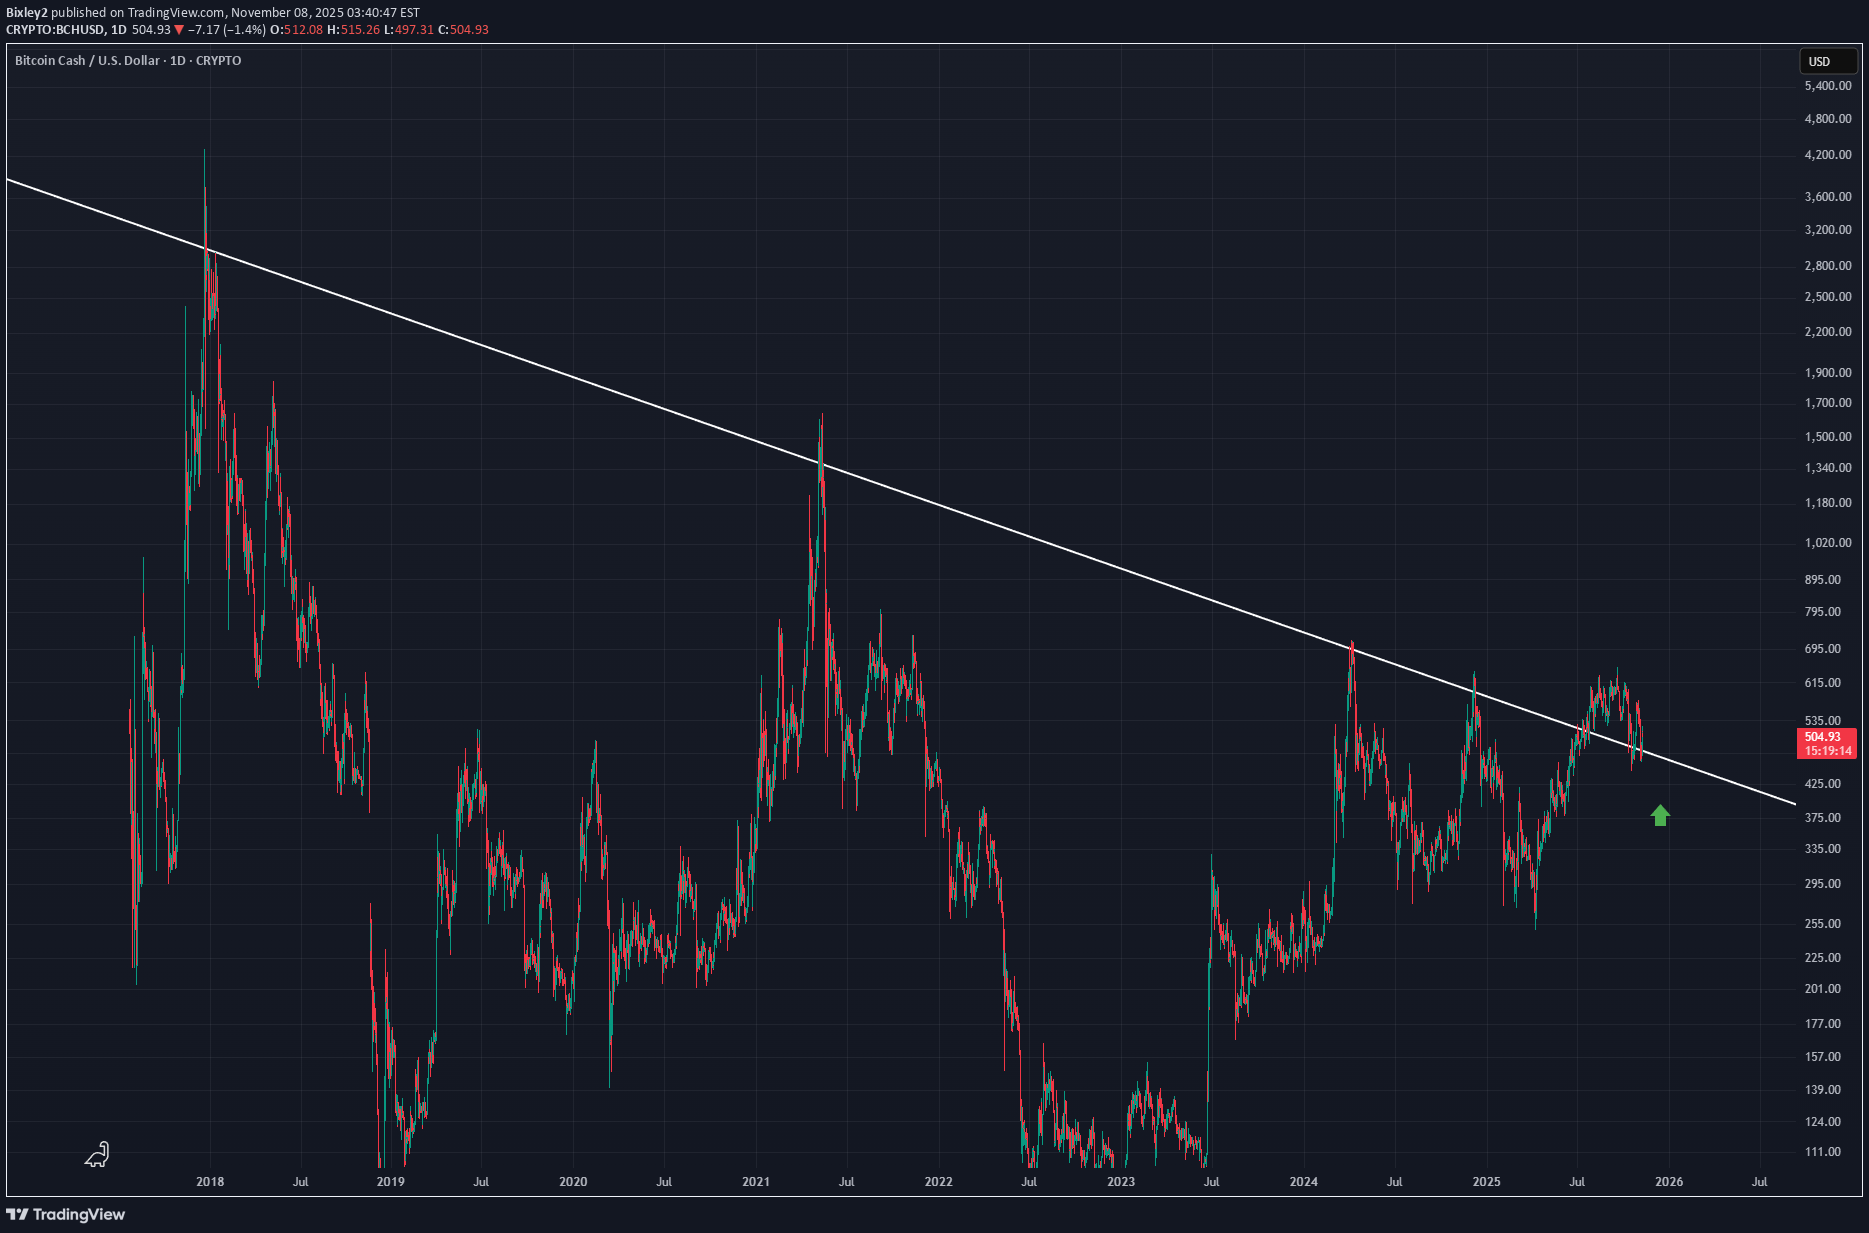
This long term resistance line has been approached and broken through by price I think a bigger break out is coming if this is a true break of this trend line In my opinion a very undervalued crypto right now Daily timeframe
Bixley2
ETHUSD - Bullish Curve Up
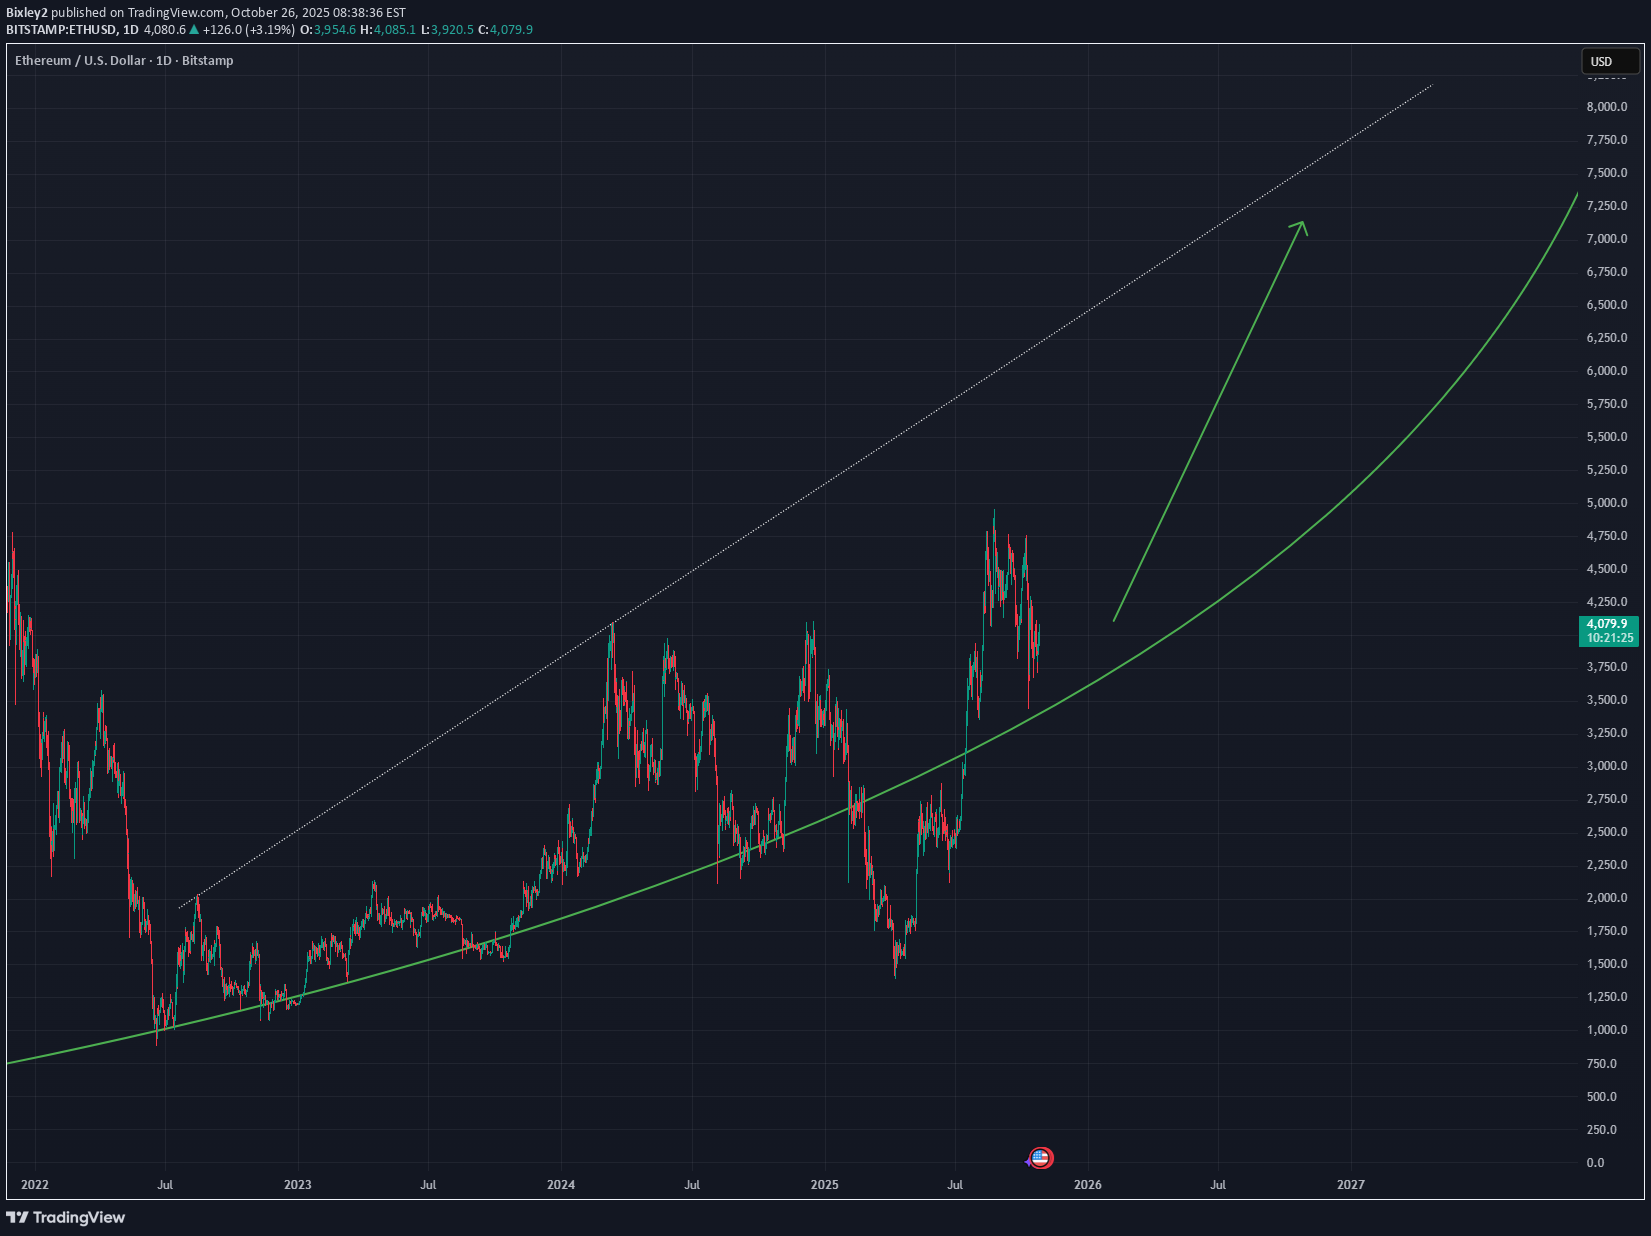
Following the trend line in green, should breakout and touch the white dotted line again Very bullish on Ethereum right now and altcoins in general Daily chart
Disclaimer
Any content and materials included in Finbeet's website and official communication channels are a compilation of personal opinions and analyses and are not binding. They do not constitute any recommendation for buying, selling, entering or exiting the stock market and cryptocurrency market. Also, all news and analyses included in the website and channels are merely republished information from official and unofficial domestic and foreign sources, and it is obvious that users of the said content are responsible for following up and ensuring the authenticity and accuracy of the materials. Therefore, while disclaiming responsibility, it is declared that the responsibility for any decision-making, action, and potential profit and loss in the capital market and cryptocurrency market lies with the trader.