
CryptoCoinsCoach
@t_CryptoCoinsCoach

What symbols does the trader recommend buying?
Purchase History
Trader Messages
Filter
Message Type
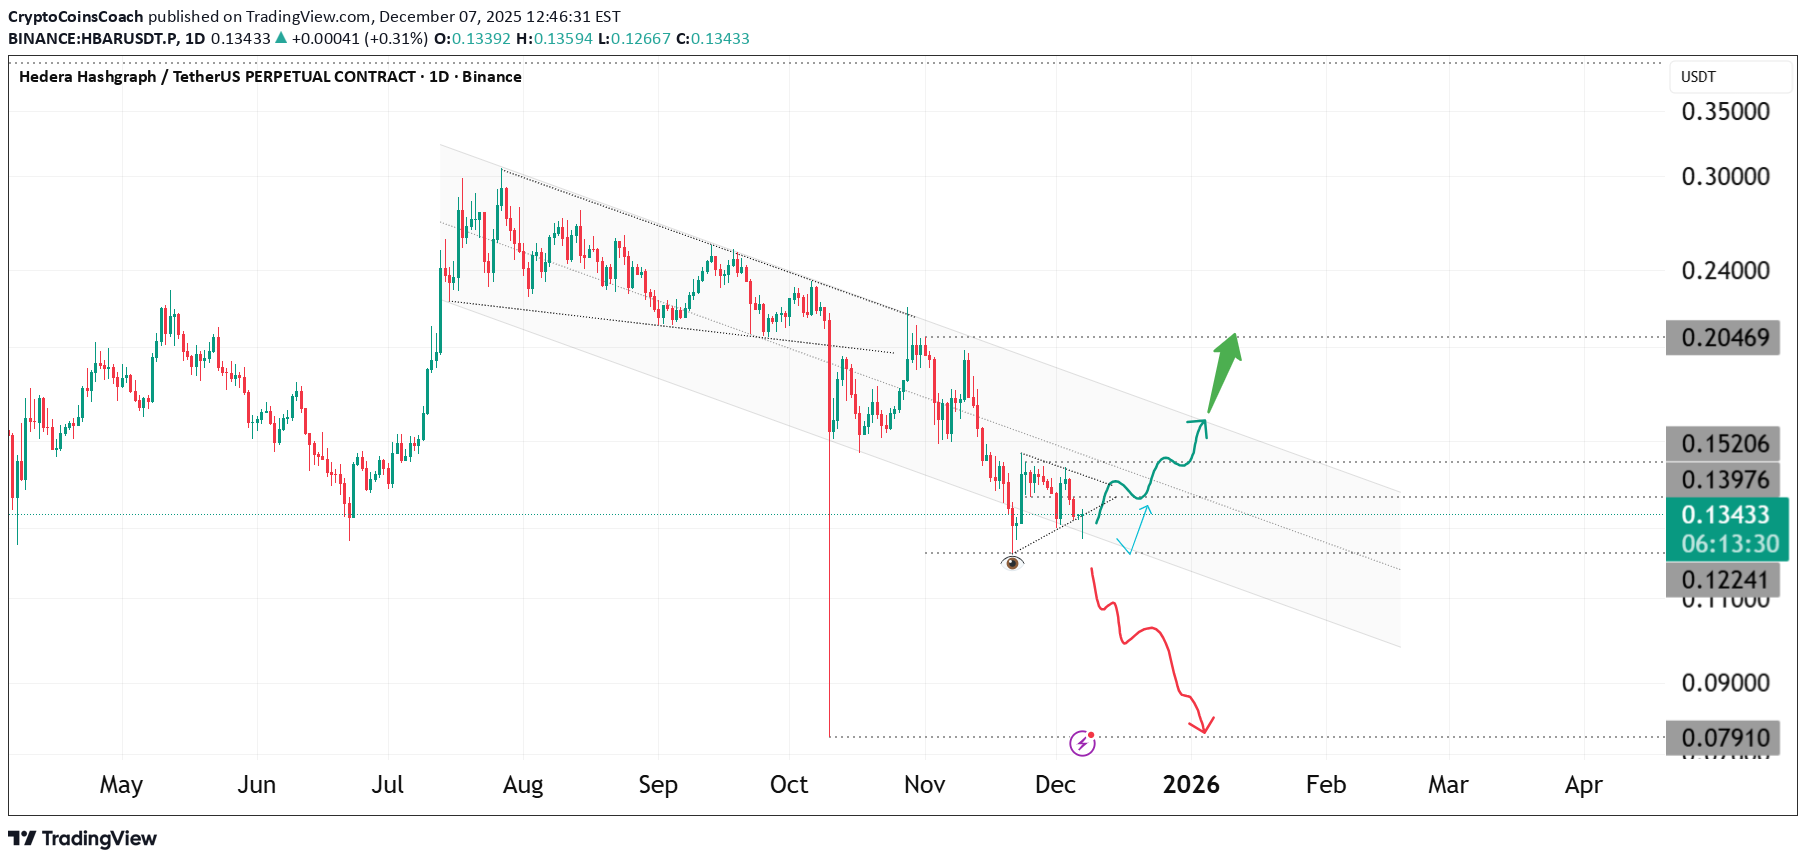
HBAR continues to move within a descending channel on the higher time frame, with price now reacting near the lower third of the structure. The current positioning suggests that the next directional move will likely be decided within this zone. Key points from the chart Descending Channel Structure • Price has respected both channel boundaries since early October. • Each touch of the lower boundary has produced a short term rebound. • Recent candles show slowing bearish momentum near the same zone. Local Support Zone • HBAR is testing a demand area that previously acted as a launch point. • Reaction from this zone determines whether the market forms a new higher low. Potential Bullish Scenario • If HBAR maintains support, price may begin moving toward the middle band of the descending channel. • A confirmed break above the internal trendline could open the path toward the next resistance levels near 0.152 and 0.204. Potential Bearish Scenario • A breakdown from the support region exposes the lower channel boundary. • Failure to hold this structure may extend the decline toward deeper levels around 0.110 and possibly 0.079. What to watch • Strength or weakness around the current support zone. • Reaction to the internal trendline. • Volume confirmation on any breakout attempts. Market stance Neutral until the channel boundary or the resistance line is decisively broken.
SHIB approaching a key reversal zone inside a descending channel
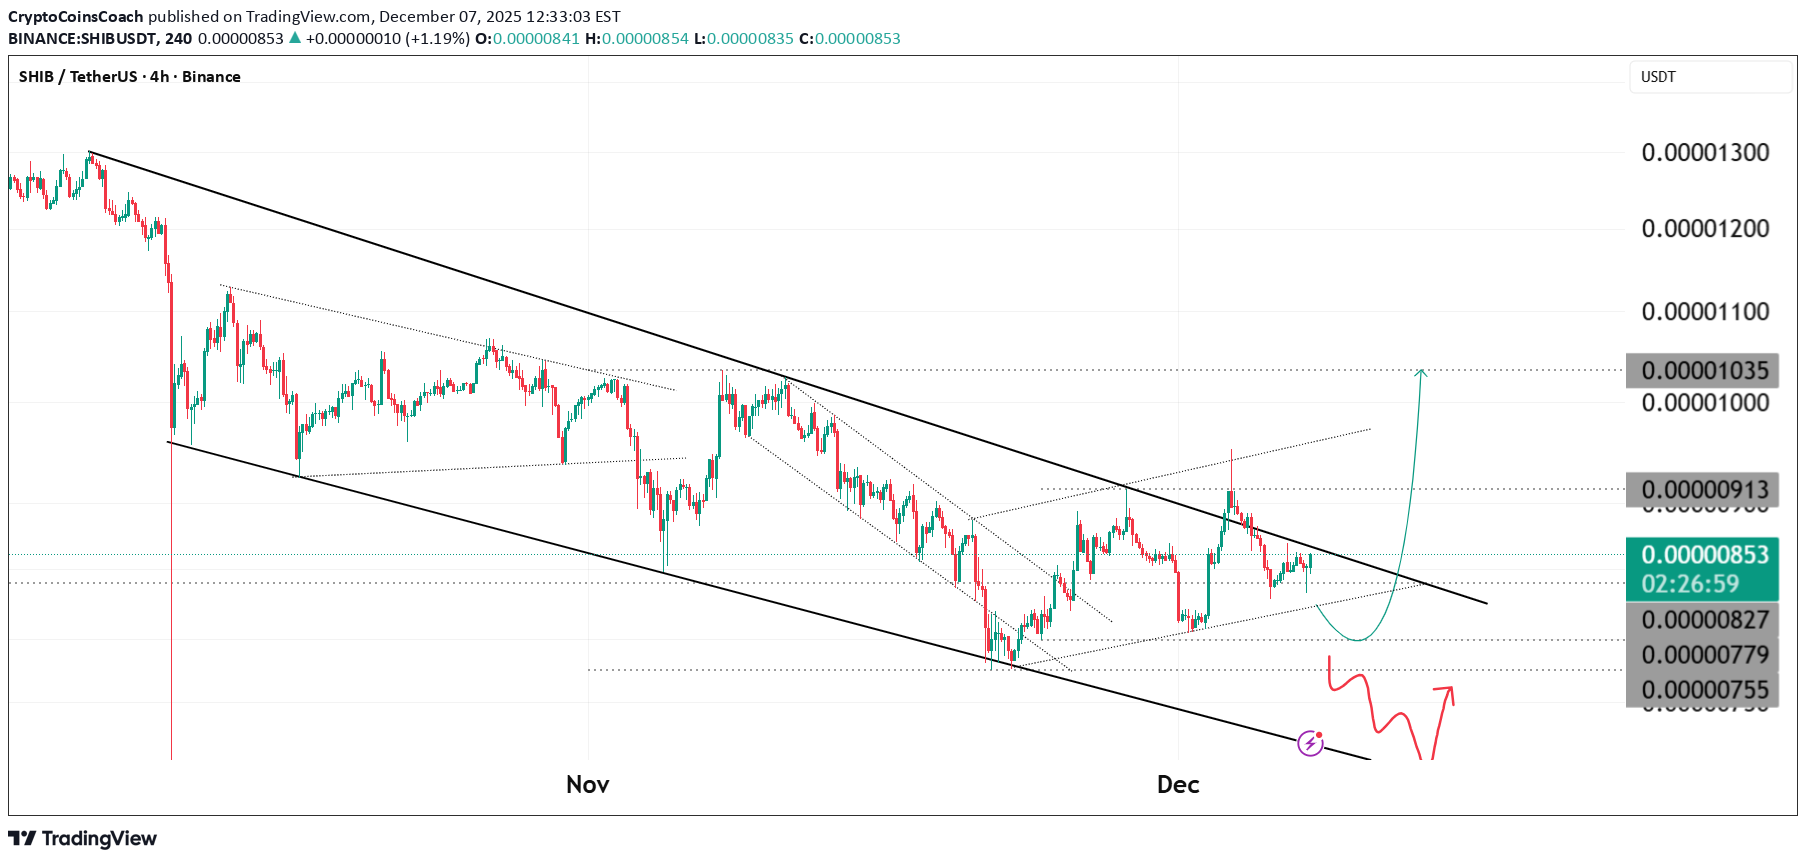
SHIB continues to move inside a clear descending channel that has been respected since mid October. Price is once again approaching the mid zone of the channel while holding above a short term support created by recent higher lows. The structure is now offering two possible scenarios. Bullish idea A reclaim of the short term trendline resistance can trigger a recovery toward the upper boundary of the descending channel. Important focus points: • Price stability above the short term support • Breakout of the diagonal resistance • Room toward the liquidity cluster at 0.00000913 • A full channel rotation opens the path to 0.00001035 Bearish idea Failure to hold the mid support area invites continuation inside the channel. What to watch: • Loss of the support zone • Return toward 0.00000827 then 0.00000779 • Deeper liquidity around 0.00000755 at the channel bottom This level is an important pivot inside the overall channel. SHIB is preparing for a directional decision and the next breakout or rejection should define the coming weeks.
Stellar (XLM) Approaching a Decision Zone inside the Descending
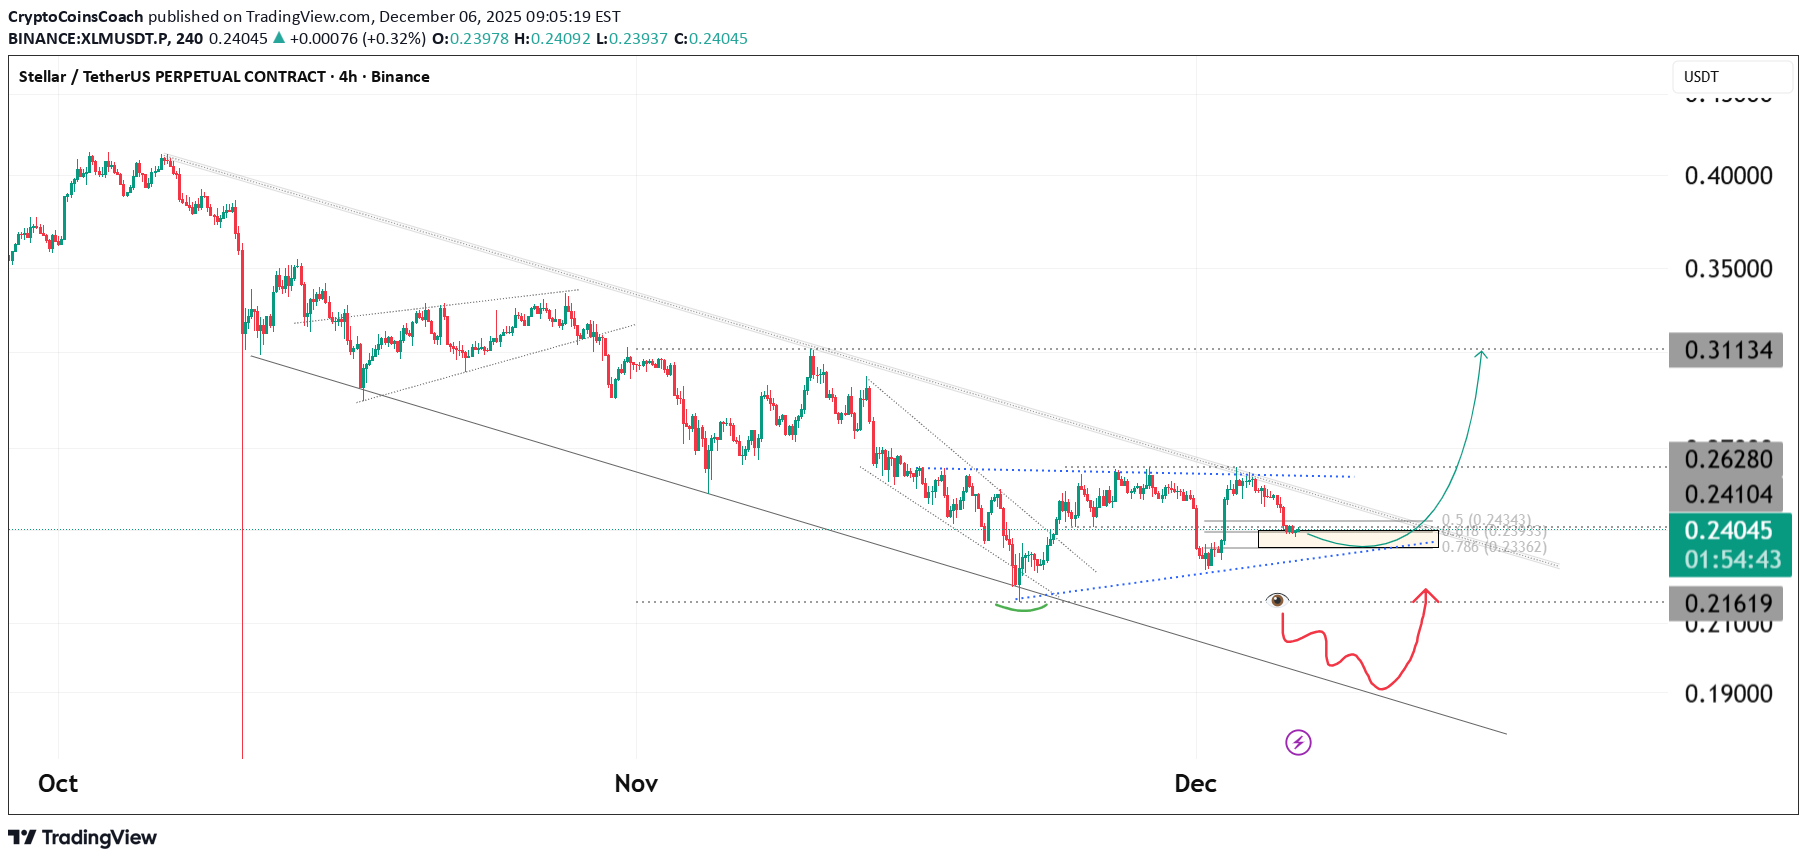
Stellar continues to move inside a broad descending channel, a structure that has been guiding price since the October high. The recent decline found support at the lower boundary of this channel, where buyers stepped in and created a short-term reaction. This zone now acts as an important decision point for the next directional move. Price is currently retesting a mid-range support cluster that includes the fifty percent and sixty-one point eight percent retracement levels of the latest impulse. This confluence zone often acts as a turning area when paired with a corrective decline inside a channel. If the market holds this level and pushes above the minor trendline resistance, the structure allows room for a broader recovery toward the upper boundary of the channel. A confirmed breakout from the channel, followed by a successful retest, would open the path toward the mid-term resistance near zero point three one. This level aligns with previous supply and serves as the next major upside objective. However, failure to hold the current support zone may send Stellar back toward the channel’s lower boundary around the zero point two one region. A breakdown below this area would signal continuation of the descending trend and postpone any meaningful recovery attempts. Key Technical Notes: Price remains within a well-defined descending channel on the four-hour timeframe. Current structure is respecting a support cluster formed by Fibonacci retracements and previous demand. Break and hold above the minor descending trendline would confirm bullish momentum. First upside target sits at zero point two six, extended target near zero point three one. Loss of the support zone exposes zero point two one and below. Bias: Neutral until the breakout is confirmed. Balanced risk on both sides with clear invalidation levels.
LTC: Final Compression Before the Break - Major Wedge Ending
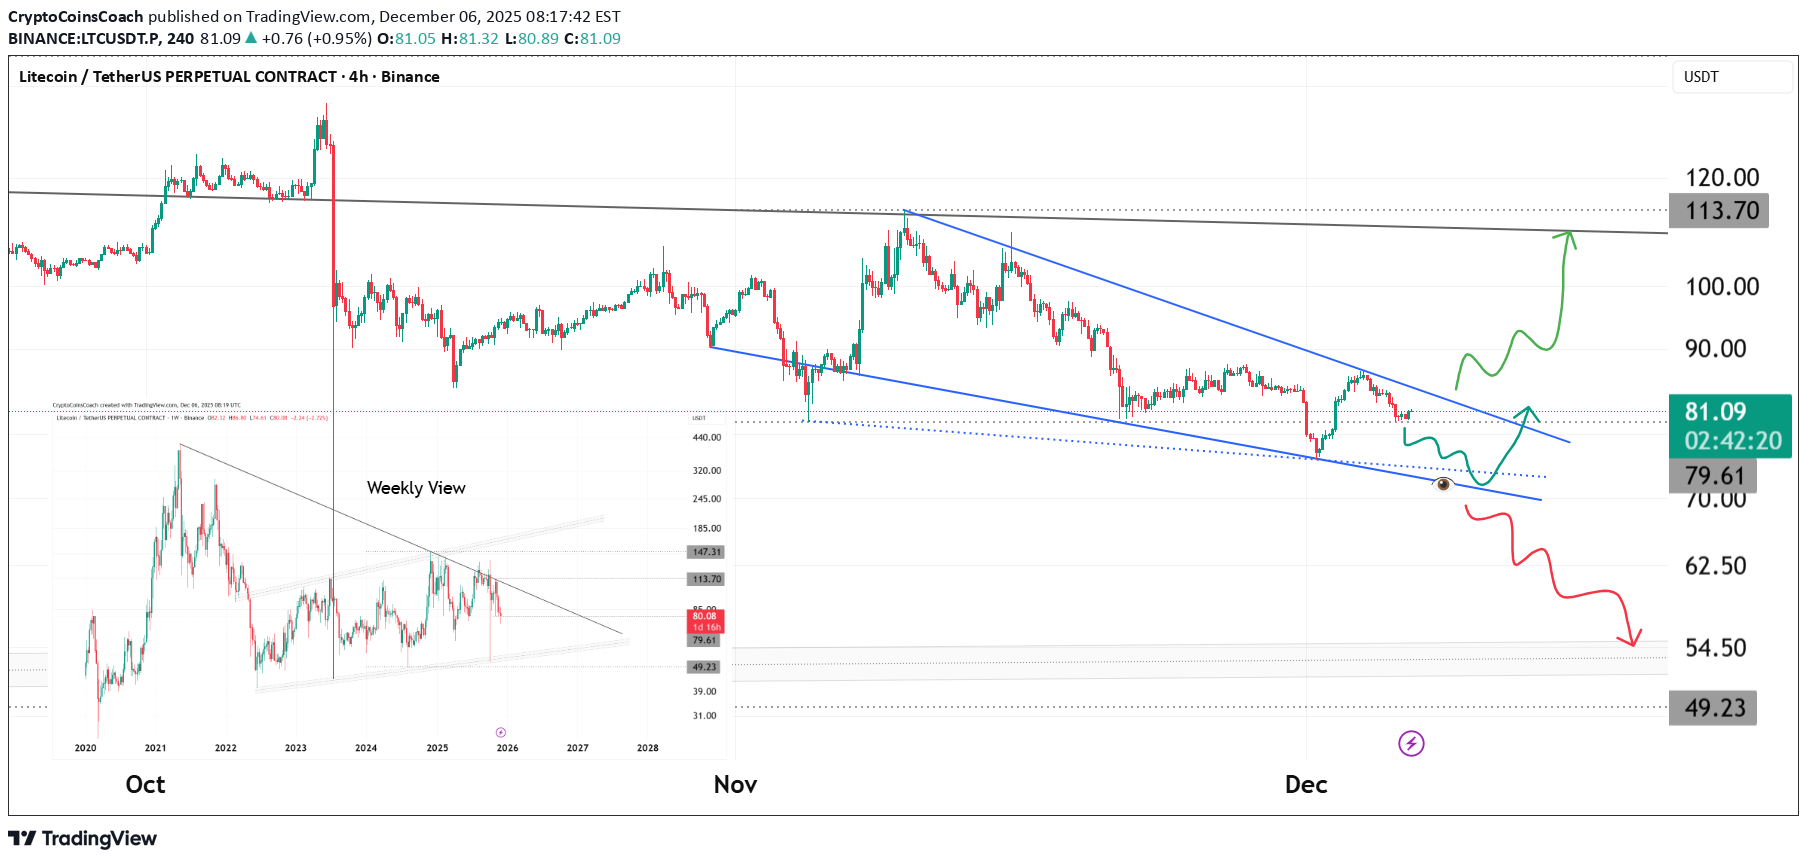
Litecoin is trading inside a clean falling wedge after multiple rejections from the macro trendline visible on the weekly chart. Price is now squeezing toward the apex with momentum flattening out. Key notes: • Bullish scenario: A breakout above the wedge resistance + reclaim of 85–87 opens room toward 113.70 and later the macro resistance at 120 . • Bearish scenario: Losing the lower wedge line + breakdown from 79–80 can send LTC toward 54–49 demand. Reasons this level matters: • The wedge has 60+ days of compression • Weekly multi-year trendline shows confluence • Local liquidity pools positioned right above current price • Multiple reaction wicks signaling absorption Watching the reaction at 79–82 will reveal the next wave: strong bounce = bullish continuation, weak retest = deeper correction.
Chainlink (LINK) Approaching Decision Zone
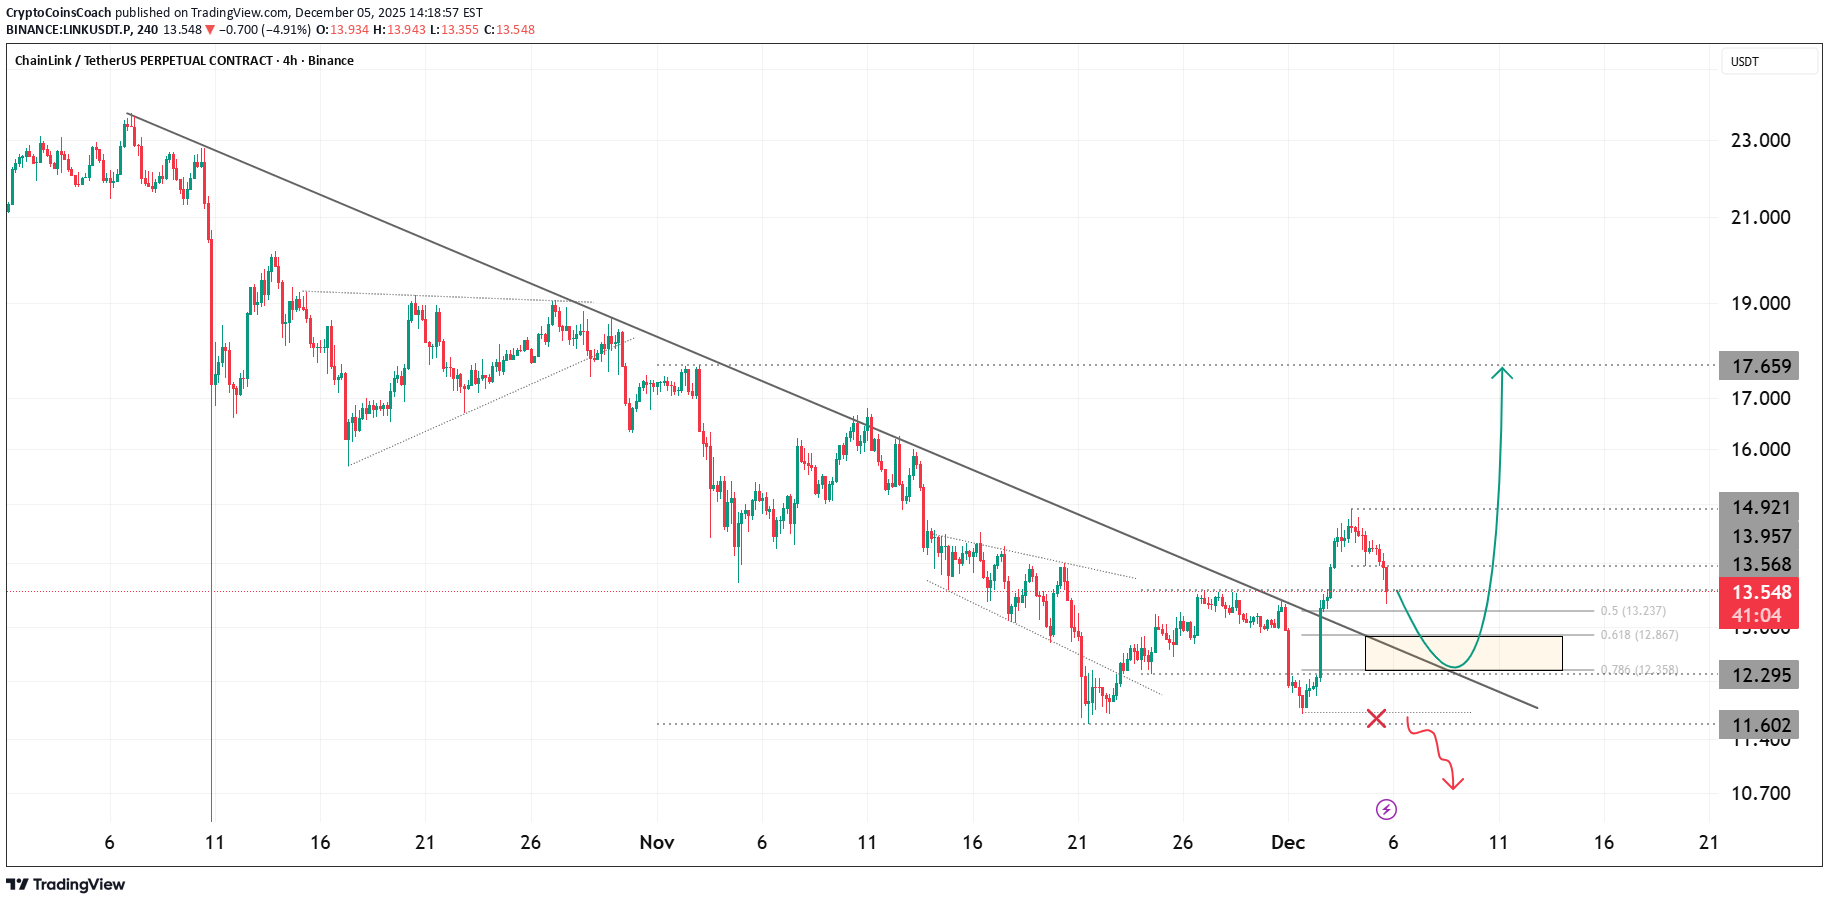
Symbol: LINK USDT Timeframe: 4H LINK is retesting the breakout zone after reclaiming the long term descending trendline. The market is approaching a key liquidity pocket that will decide the next wave. Key Points: • Price reclaimed the multi week trendline • Consolidation happening inside a golden retrace region • Breakout retest structure gives a cleaner bullish continuation setup • Fibonacci 0.5 to 0.786 cluster acting as the main decision zone Bullish Scenario: If LINK holds the 12.3 to 12.8 support box and confirms a higher low then a push toward 14.92 and 17.65 becomes highly probable. Momentum favours a continuation if buyers step in at the retest. Bearish Scenario: Failure of the support box opens the door to 12.29 and even 11.60 where the next liquidity pocket is waiting. What I am watching: • Stability above 13.5 • Reaction at the trendline retest • Volume confirmation on bounce
Bitcoin Cash (BCH) Preparing for a Breakout Move
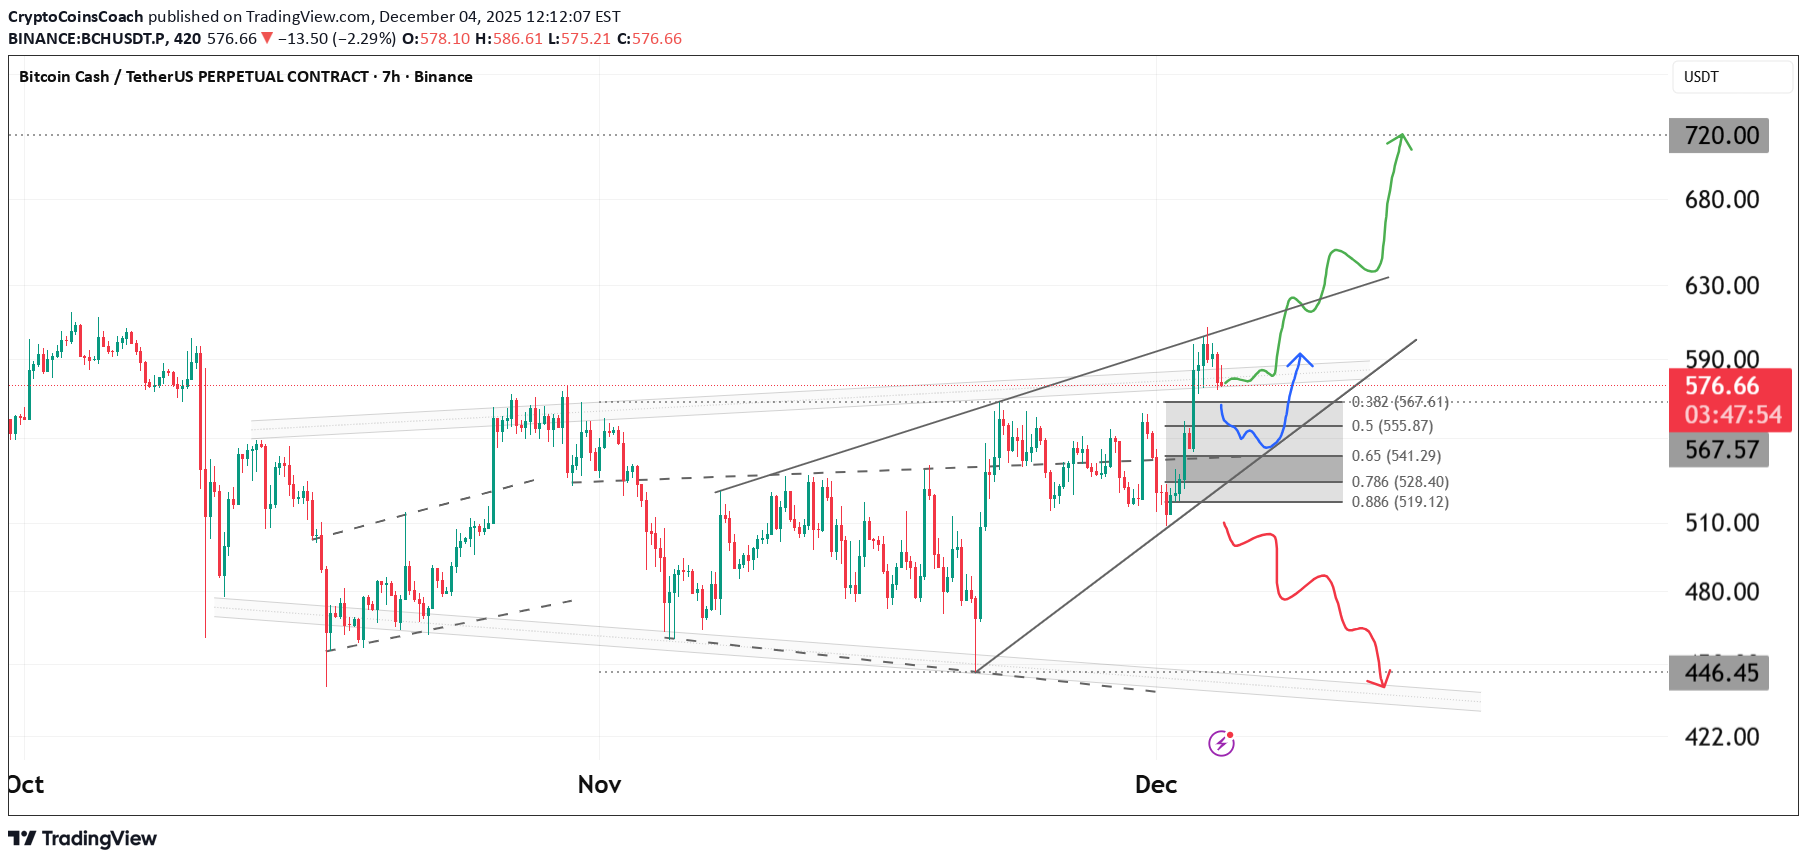
BCH is currently trading inside a rising wedge structure, where price keeps creating higher lows while struggling to clear the upper resistance. This pattern often appears before a decisive expansion in volatility, either as a continuation or as a reversal depending on how the breakout occurs. Recent price action shows rejection at the upper boundary, followed by a pullback into a fib cluster between 0.382 and 0.786. This zone acts as a short term decision point, where the next directional move is likely to originate. The market structure remains constructive as long as BCH holds above the rising wedge support. A controlled retracement into the grey demand block keeps the bullish case intact, while a deeper breakdown would shift momentum in favour of sellers. Key Technical Notes: • Rising wedge structure guiding current trend • Clear fib retracement confluence inside the demand block • Higher lows indicate buyers are still defending structure • Breakout above the wedge can trigger an impulsive move • Breakdown from wedge support opens a larger correction Bullish Scenario: A bounce from the fib cluster and a breakout above the wedge resistance can open a rapid expansion toward the 720 region. Momentum would accelerate if buyers reclaim the mid channel levels with strength. Bearish Scenario: Losing wedge support flips the entire structure short. In that case, BCH may slide toward 446 where major liquidity sits. In simple terms: BCH is compressing inside a rising wedge. A breakout means continuation toward 720, while a breakdown exposes 446. Watch the fib cluster for confirmation of direction.
SUI Approaching Decision Point as Channel Weakens
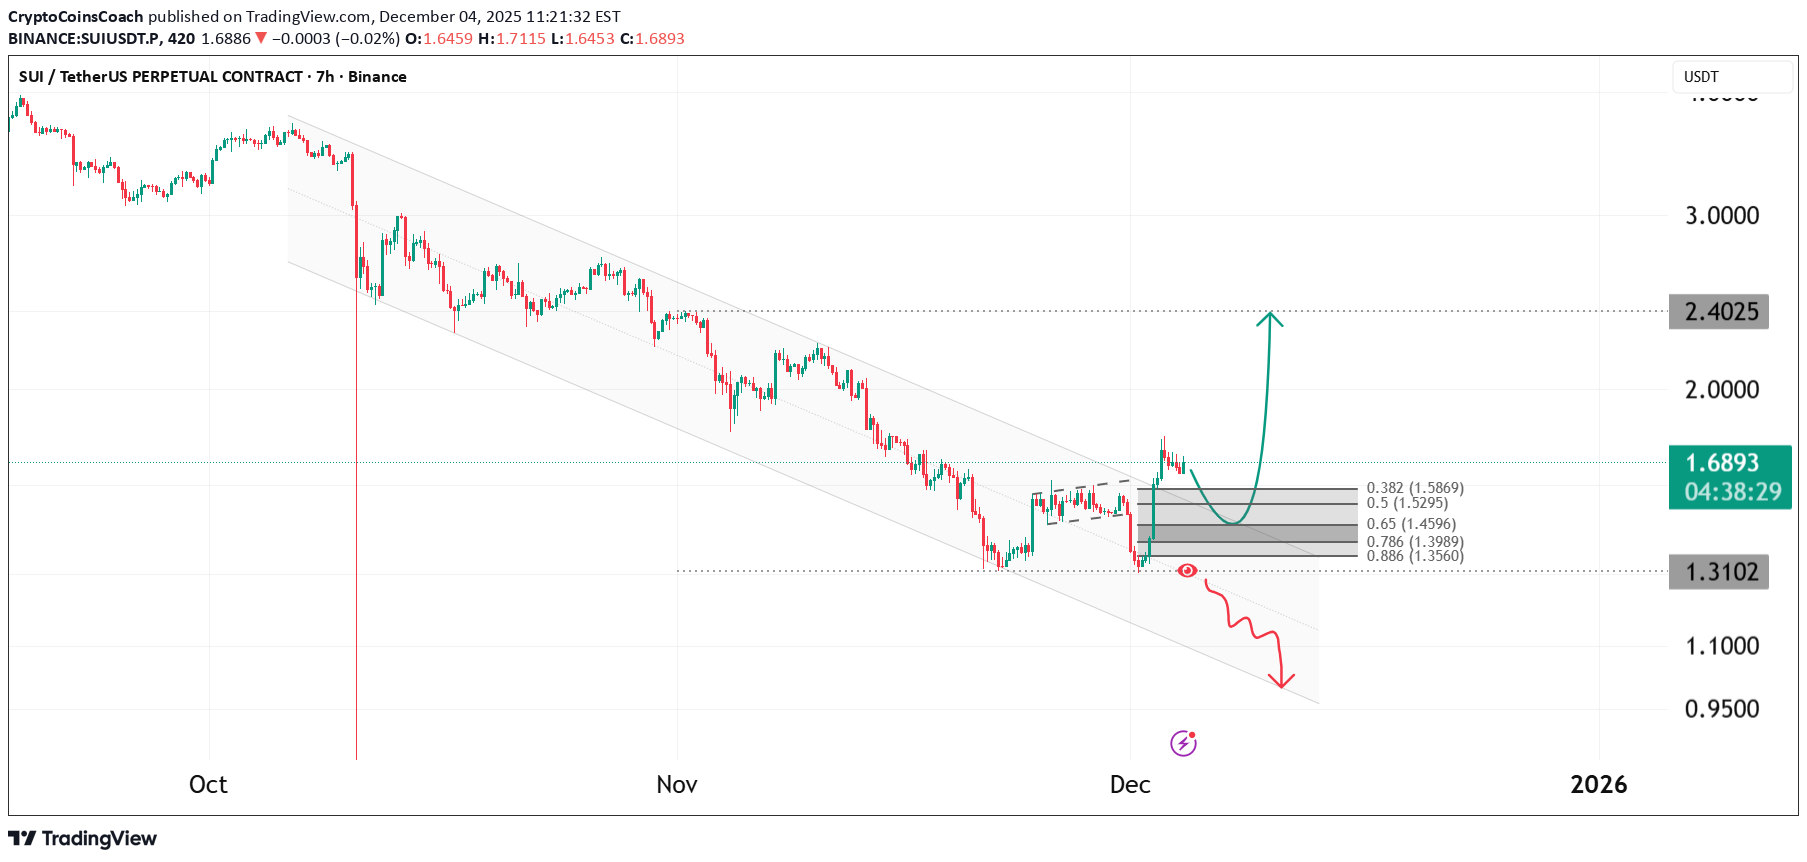
SUI is approaching an important decision zone after spending months inside a clearly defined descending channel. Price has reached the lower boundary of structure multiple times, and the recent reaction suggests growing interest near the demand zone. The current bounce is forming directly at a cluster of Fibonacci supports, including the 0.5 and 0.618 retracement levels, which often act as strong pivot points during trend exhaustion. As long as SUI holds above the highlighted demand area, a short term relief wave toward the upper channel line remains possible. A clean reclaim of the mid range structure would open the door toward the first major upside target at 2.4025. If momentum builds from there, the overall structure could shift from corrective to impulsive. The bearish continuation scenario remains valid only if the demand area fails. A breakdown below 1.3102 would expose the lower expansion of the channel, where liquidity could be swept before any attempt to form a reversal. Key Technical Notes: • Price has respected the descending channel for several months • Current bounce aligns with layered Fibonacci supports • Reclaiming the mid range may activate bullish continuation • Breakdown below demand confirms continuation of the downtrend Invalidation: A loss of 1.3102 would invalidate the bullish bias and reopen lower liquidity zones. In simple terms: SUI is sitting on major support. Holding here can trigger an upward wave toward 2.40. Losing support flips the outlook back to bearish continuation.
HYPE Approaching Key Reversal Zone
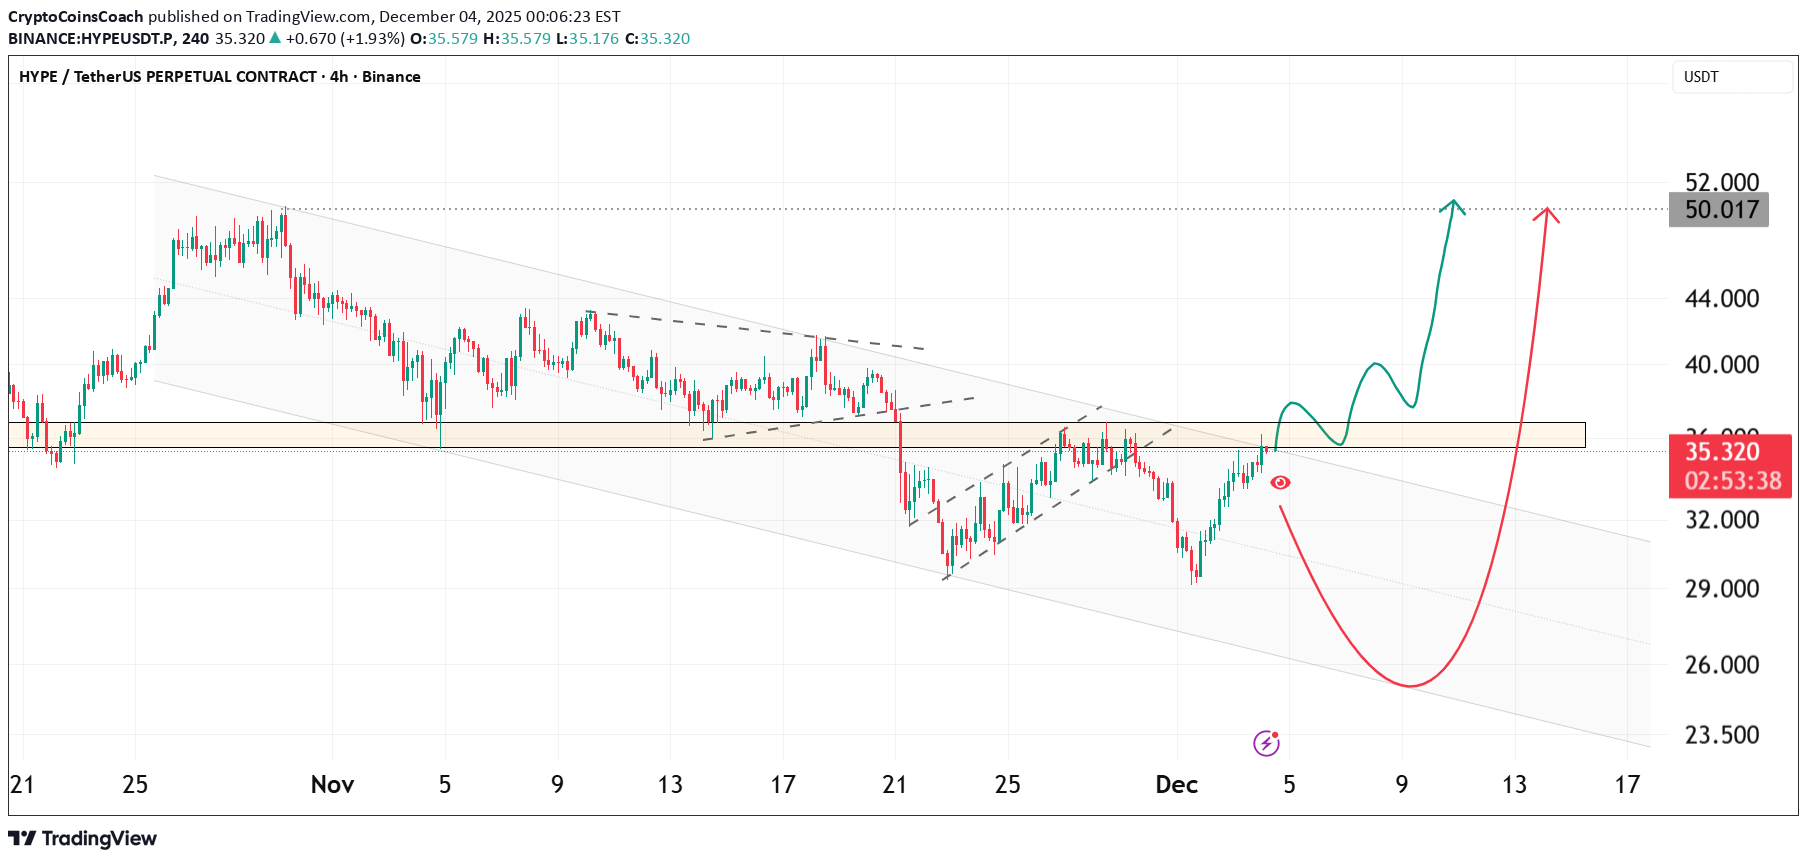
HYPE is approaching a critical decision zone after a long corrective move inside a descending channel. Price has returned to the mid-range supply zone, where previous reactions created strong turning points. This area now acts as the major pivot for the next directional leg. After the recent liquidity sweep, the market is showing early signs of stabilization. The reaction inside the demand pocket indicates that buyers are slowly stepping in, although the overall structure is still corrective until the mid-range is reclaimed. The next movement will likely be defined by how price behaves around the highlighted zone. Key Technical Points • Price has reached a major mid-range supply block • Reaction from the lower channel boundary confirms buyer interest • A break above the supply zone unlocks momentum toward the upper channel • Failure to reclaim the zone risks a deeper sweep toward lower liquidity levels • Volatility is expected as price compresses inside the range Bullish Scenario If price reclaims the shaded zone with sustained strength, HYPE may initiate a trend reversal. This can open the door for a move toward the channel top and ultimately toward the 50-52 region. Bearish Scenario If rejection occurs from this zone, price may rotate back toward the lower boundary of the channel. A deeper sweep of liquidity can occur before any strong reversal attempt. Simple View HYPE is sitting at a decisive supply zone. Reclaiming it leads to upside continuation. Rejecting it leads to another leg down. This is a pivotal moment.
TRX Approaching Key Breakout Zone as Structure Tightens
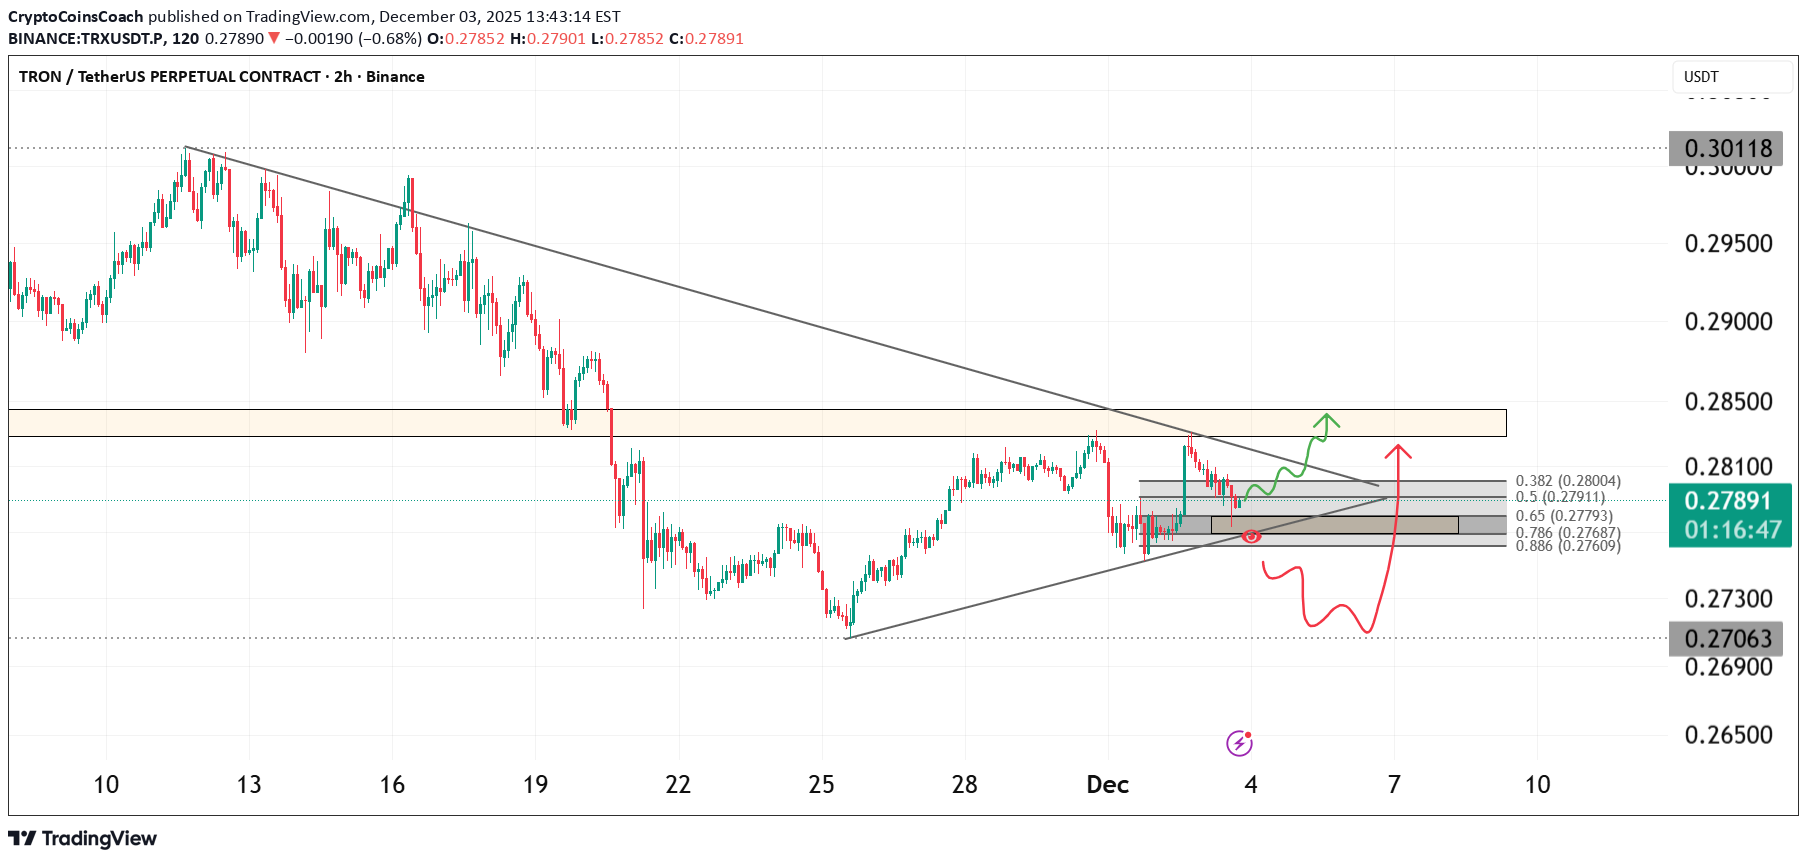
TRX is approaching a critical decision point inside a compressing structure where price is being held between diagonal resistance and a rising support line. The market has printed a clean series of higher lows while repeatedly testing the same resistance, suggesting growing pressure beneath the price. The current reaction inside the grey fib zone shows that buyers are active, and as long as this support holds, TRX can attempt another push into the supply region highlighted above. The behaviour inside this zone will determine whether price continues upward or rejects for a deeper pullback. The zone around 0.282 to 0.286 is the important breakout region to watch. If price reclaims it, momentum can shift upward rapidly toward the next liquidity pockets. Key Notes • Price is compressing into an apex between support and diagonal resistance • Fib retracement region is holding as intraday support • Liquidity sits above the 0.282 to 0.286 supply region • Higher lows suggest accumulation behaviour Bullish Scenario If TRX continues to hold the fib support and breaks above 0.282, the structure opens room for a move toward the upper supply zone with potential follow through. Bearish Scenario Failure to hold the grey support region can push price back to retest the lower trendline around 0.270. Invalidation A clean break and continuation below 0.270 invalidates the bullish setup and delays any potential breakout. Simple explanation TRX is squeezing into a decision point. Holding support gives it room to break out. Losing support sends it back to the lower trendline. Watch how price behaves around 0.282 because that level decides everything.
BNB at Make-or-Break Support– Final Sweep or Major Reversal Zone
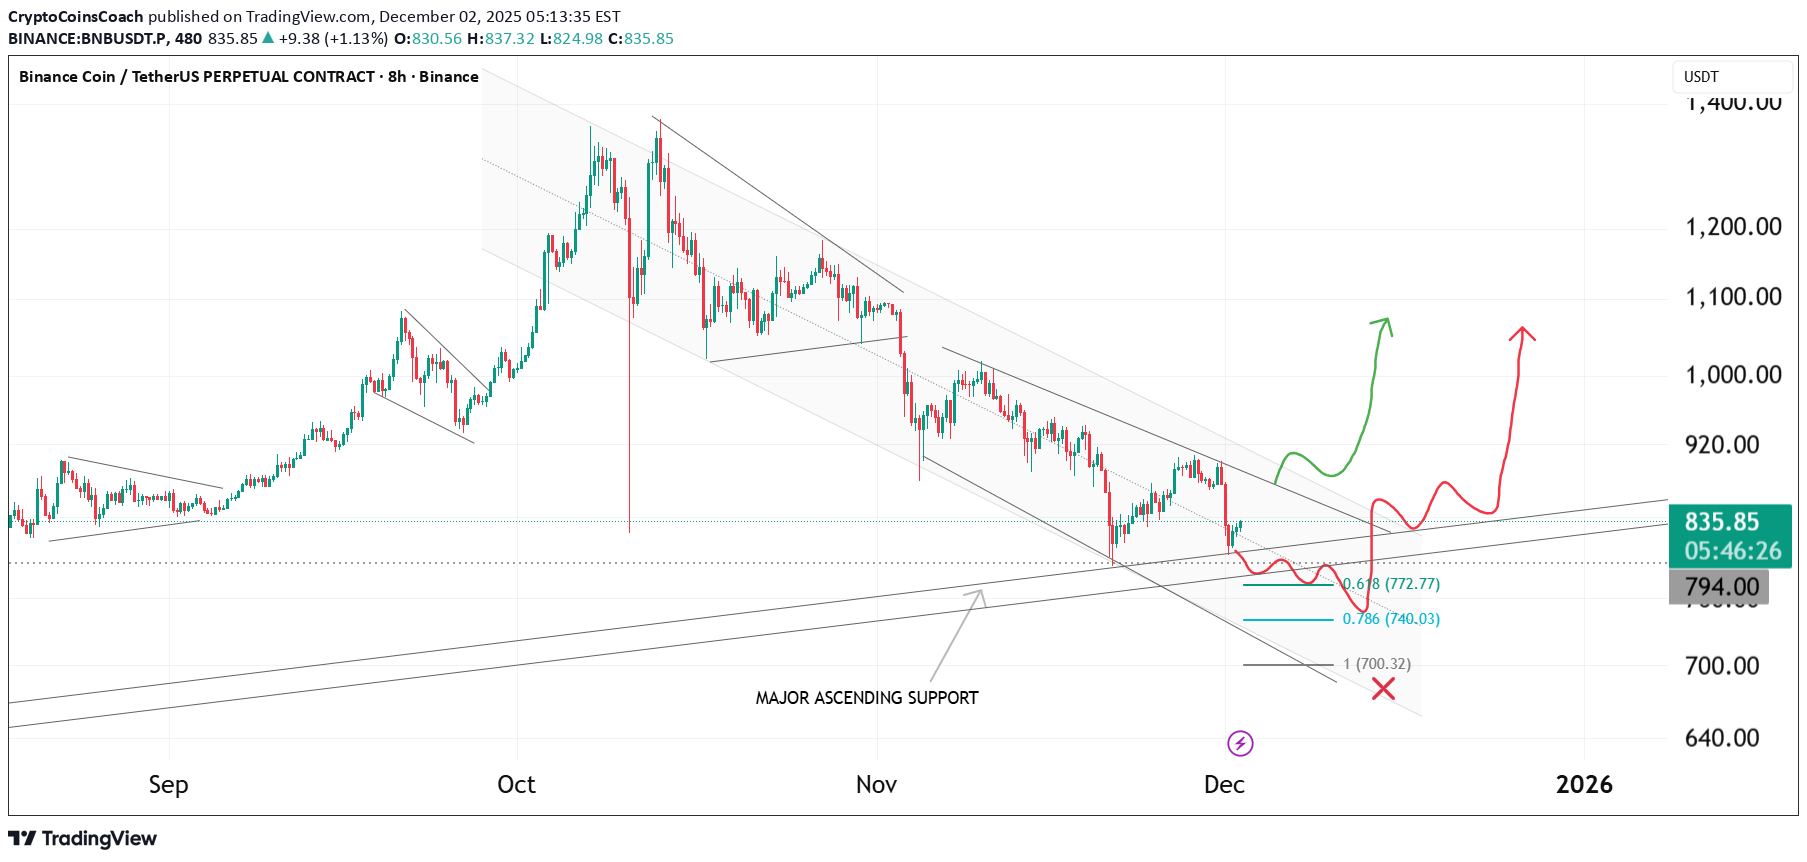
BNB is approaching a very important area where two major structures meet: the descending channel and the long-term ascending support. This region has historically triggered strong reactions, and price is now retesting it again. The recent drop pushed BNB directly into the confluence of • 0.618 fib (772) • 0.786 fib (740) • major ascending support • the bottom of the falling channel This combination forms a high-value reaction zone where volatility usually expands. If price holds this zone and reclaims the smaller descending trendline, the market can begin the next corrective leg to the upside. However, failure to hold this support may trigger a deeper sweep before any recovery attempt. Key Structure Notes • BNB is trading inside a falling channel • Price is sitting at a multi-month ascending support • Fib confluence strengthens the potential for a rebound • A clean reclaim of the inner trendline would confirm strength • A breakdown below 740 would invalidate this scenario Invalidation A confirmed close below 740 invalidates the bullish recovery idea and opens the door for a deeper move toward 700. Simple Explanation BNB is sitting at a major support cluster. If this area holds and the trendline is reclaimed, upside continuation can follow. If it breaks, expect another sweep lower before any meaningful bounce.
Disclaimer
Any content and materials included in Finbeet's website and official communication channels are a compilation of personal opinions and analyses and are not binding. They do not constitute any recommendation for buying, selling, entering or exiting the stock market and cryptocurrency market. Also, all news and analyses included in the website and channels are merely republished information from official and unofficial domestic and foreign sources, and it is obvious that users of the said content are responsible for following up and ensuring the authenticity and accuracy of the materials. Therefore, while disclaiming responsibility, it is declared that the responsibility for any decision-making, action, and potential profit and loss in the capital market and cryptocurrency market lies with the trader.