
CryptoNuclear
@t_CryptoNuclear

What symbols does the trader recommend buying?
Purchase History
Trader Messages
Filter
Message Type
CryptoNuclear
SHIB/USDT — Critical Demand Zone: Reversal or Full Capitulation?

SHIB is now revisiting the major demand zone at 0.000007–0.0000055, a level that has acted as the foundation of every major multi-month rally since 2021. This zone is not just support — it is a psychological pivot that separates long-term accumulation from market capitulation. Each historical touch of this zone has triggered strong bullish reactions, yet the current structure is different: Weekly price action continues to print lower highs, signaling that institutional selling pressure remains active while buyer conviction has not yet shown dominance. SHIB is entering a transitional phase, where the next few weekly candles can redefine its macro direction. --- Price Structure and Market Pattern 1. Descending Structure / Lower Highs Indicates weakening long-term momentum and the need for strong confirmation before any sustainable bullish reversal. 2. Major Demand Zone (0.000007–0.0000055) A multi-year accumulation area with repeated deep wicks and strong historical rejections, showing where large players have entered previously. 3. Layered Horizontal Supply Zones Key resistance levels created by previous distribution phases: 0.0000107 0.0000160 0.0000326 0.0000667 4. Market Compression The longer price compresses against this demand zone, the larger the eventual breakout impulse — in either direction. --- Bullish Scenario: A Major Reversal Begins Here Bullish confirmation requires: 1. A weekly close above 0.000007 2. A strong reversal candle (bullish engulfing, hammer with solid body) 3. Increasing buying volume 4. Early bullish divergence on RSI/MACD (weekly or daily) If confirmed, upside levels open in stages: Target 1: 0.0000107 Target 2: 0.0000160 Target 3: 0.0000326 Breaking above Target 3 would signal a potential macro trend shift, turning SHIB from long-term bearish to structurally bullish. --- Bearish Scenario: Breakdown and Capitulation Phase Bearish continuation is confirmed if: 1. Weekly close breaks below 0.0000055 2. Retest of 0.000007 fails to reclaim 3. Selling volume accelerates, showing loss of long-term accumulation interest If this breakdown holds, price opens the door to deeper downside: 0.0000040 0.0000030 These levels represent historical liquidity pockets where capitulation tends to occur before larger players begin accumulating again. --- Key Takeaway SHIB is not just sitting at a support — it is testing the macro decision zone that will determine its long-term direction into 2026. From a probability perspective: Holding the 0.000007–0.0000055 zone = potential for a major swing rally Losing it on a weekly close = activation of a deeper bearish leg The upcoming weekly closures will define whether SHIB resets its long-term trend or enters a prolonged capitulation phase. --- #SHIB #SHIBUSDT #CryptoAnalysis #MarketStructure #WeeklyChart #SupportZone #DemandZone #PriceAction #AltcoinAnalysis
CryptoNuclear
STRK/USDT – The 0.153–0.133 Zone Will Decide the Next Trend?

STRK/USDT is entering one of the rarest market phases: a combination of a major trendline breakout, a clean retest into a historical accumulation zone, and a perfect alignment with the 0.5–0.618 Fibonacci retracement levels. This trio of signals often appears at the early stage of a major trend reversal. The 0.153–0.133 zone (yellow block) is not just a support area. It is a high-value demand zone that has consistently absorbed selling pressure for months, and now acts as the critical pivot that will decide STRK’s mid-term direction. Following the successful breakout above the long-term descending trendline, the price is now retesting the same accumulation area. This is the classic pattern often seen before a major expansion move: Breakout → Retest → Expansion. If the retest holds, this area could serve as the launchpad for STRK’s next major leg upward. --- Bullish Scenario (Primary – High Probability) 1. Price holds the 0.153–0.133 support block and forms a clear bullish rejection candle. 2. Additional confirmation: a 3D or daily close above the first resistance at 0.195. Once confirmed, STRK opens room toward the following upside targets: TP1: 0.195 (first resistance and structural pivot) TP2: 0.355 (major supply zone + measured-move target) TP3: 0.520 (continuation-level target if momentum expands) If the full breakout & retest pattern plays out, STRK may enter a mid-term trend reversal from bearish to bullish. --- Bearish Scenario (Invalidation Criteria) The bearish case activates only if: Price closes decisively below 0.133, breaking the entire accumulation block and invalidating the retest structure. If this breakdown occurs: Market structure shifts back into bearish continuation. Downside targets would shift toward: 0.10 – 0.09 Extended support: 0.07 – 0.05 if momentum accelerates The 0.153–0.133 zone is therefore the key invalidation area for bullish traders. --- Pattern & Market Structure Overview Long-term trendline breakout shows a shift in sentiment. Perfect retest into demand signals strong buyer presence. 0.5–0.618 Fibonacci alignment provides technical confluence for a potential reversal. Range contraction inside the yellow block indicates a buildup before a large move. This combination makes STRK one of the more technically compelling setups on the mid-term chart. --- Trading Conclusion As long as price holds the 0.153–0.133 accumulation block: STRK remains in a high-probability reversal phase with upside potential toward 0.195 → 0.355 → 0.520. A close below 0.133 invalidates the bullish structure and opens the door for deeper downside targets. The yellow zone remains the decisive level that will define STRK’s next trend. --- #STRK #STRKUSDT #CryptoAnalysis #Altcoins #BreakoutRetest #MarketStructure #DemandZone #TrendReversal #TechnicalAnalysis
CryptoNuclear
FIL/USDT — Brutal Rejection or the Beginning of Major Reversal?

FIL/USDT is entering one of the most critical decision zones of the entire 2025 structure. After spending months inside a clean, well-defined downtrend (yellow trendline), FIL attempted a breakout — only to be met with a violent wick rejection, signaling heavy supply waiting above. Price has now fallen back into the Golden Retracement zone (0.5–0.618 Fibonacci) — a region that often determines whether a market forms a true reversal or continues its larger downtrend. What happens here is pivotal. --- 🔶 Key Structure & Pattern Insights 1. Long-Term Downtrend Still in Control Clear formation of lower highs and lower lows visible since early 2025. The yellow descending trendline has acted as major resistance for almost the entire year. 2. False Breakout (Wick Rejection) FIL broke above the trendline but failed to close above it. This usually indicates upside liquidity grab, not a confirmed reversal. 3. Price Returns to the Critical Fibonacci Zone 0.5 = 2.155 0.618 = 1.968 A textbook retest region where major directional decisions often occur. 4. Layered Resistance Levels Above If FIL stabilizes, these become the upside checkpoints: 2.65 → key confirmation level 3.27 → first major resistance 4.875 / 6.07 / 7.88 → structural targets if a full reversal unfolds --- 🟢 Bullish Scenario (True Reversal Potential) Bullish bias becomes valid ONLY if: ✔ Price holds above 2.15–1.97 and forms a higher low ✔ A 2D/weekly close occurs above 2.65 If both conditions are met → the trend reversal becomes official. Bullish targets: 3.27 – first major confirmation 4.875 – upside continuation 6.07 – mid-term target 7.88 – high zone that may trigger market FOMO Additional Bullish signals: Volume expansion on the 2.65 breakout Clean retest of the Fibonacci zone Strong-bodied candles instead of wick-driven spikes --- 🔴 Bearish Scenario (False Breakout Confirmed) Bearish continuation strengthens if: ❌ Price breaks & closes below 1.97 (0.618 Fib) If this happens → the previous breakout is fully confirmed as a false break, and the downtrend resumes. Downside targets: 1.70–1.50 → major structural support Breakdown below this region could send FIL to deeper lows Additional Bearish signals: Strong rejection near 2.15–2.20 Increasing sell volume Weak reaction every time price retests the trendline --- 🎯 Key Takeaways FIL is currently sitting at a major reversal zone or a continuation breakdown point. 📌 2.15–1.97 is the main battlefield 📌 Closing above 2.65 = multi-week bullish potential 📌 Losing 1.97 = downtrend continuation 📌 Watch 2D and weekly closes very closely This is a decision zone — not a place for FOMO, but a place for precision and disciplined planning. --- #FIL #FILUSDT #Filecoin #CryptoAnalysis #TechnicalAnalysis #TrendReversal #Fibonacci #Breakout #Rejection #CryptoTrading
CryptoNuclear
GOAT/USDT — Critical Decision Zone: Major Reversal or Breakdown?

GOAT is now sitting at the most critical level since its earlier distribution phase: the price has returned to retest the Primary Structural Base at 0.041–0.035, a zone that previously triggered a major bullish expansion. This area is not just support — it is the battleground that decides the next macro direction. The entire downtrend from the peak has formed a consistent descending wave structure, yet each drop into the 0.041–0.035 block has been met with aggressive buy absorption. This indicates that a large liquidity cluster sits within this zone and may act as the pivot for a significant reversal. --- Pattern & Market Structure Overview Price action is currently forming a low-compression pattern into the key support. This typically ends with either: a strong impulsive reversal, or a high-momentum breakdown into deeper liquidity zones. The latest 2D candle closed right above the upper boundary (0.041), showing buyers are still defending — but the momentum remains fragile. Overhead resistance levels (0.0635 → 0.0885 → 0.114 → 0.150 → 0.1999) form a clean ladder of recovery targets if a bounce is confirmed. --- Bullish Scenario — “Major Accumulation Rebound” This scenario activates if: 1. Price holds and rebounds strongly from 0.041–0.035. 2. A clean 2D close above 0.0635 appears — this zone is the Bullish Trigger. Once confirmed, the market shifts from a downtrend into a recovery structure, with step targets: 0.0635 → Reversal validation 0.0885 → Momentum expansion 0.114–0.150 → Mid-range trend shift 0.1999 → Major structural retest From the support zone to the upper targets, the upside potential can reach +300%, but only with full bullish confirmation. --- Bearish Scenario — “Liquidity Flush Breakdown” A strong breakdown below 0.035 signals buyer exhaustion. If that occurs: Price will likely drop quickly into 0.02684 (previous liquidity wick). If 0.02684 fails, the chart may enter a capitulation phase, opening the path toward the low 0.02 region. This would confirm the continuation of the primary downtrend. --- Core Conclusion GOAT is positioned inside a macro decision zone. The 0.041–0.035 range determines whether we see: the end of the prolonged bearish cycle and the beginning of a major reversal, or the start of a deeper capitulation leg, as the market hunts lower liquidity. This makes the zone both the highest-reward entry area and the highest-risk failure point. #GOATUSDT #GOAT #CryptoAnalysis #PriceAction #SupportZone #Breakout #BullishScenario #BearishScenario #CryptoTA #TechnicalAnalysis
CryptoNuclear
TAO/USDT — Breakout Incoming or Breakdown Imminent?

TAO/USDT is now sitting on one of the most critical price zones of its entire mid-term structure. On the 2D timeframe, price has returned to the Golden Demand Zone at 340–305 — an area that previously acted as accumulation, breakout base, and institutional defense line. Now the market is testing it again, which means: > How price reacts here will determine the next major directional wave. --- 🔶 Why the 340–305 Zone Is Extremely Important A proven demand zone where buyers consistently stepped in with strength. A flip zone (old resistance → new support). A region where institutions filled liquidity before previous rallies. Multiple long wicks were created here → indicating liquidity sweeps and strong buy absorption. In simple terms: This zone is the foundation of the current trend cycle. --- 📈 Bullish Scenario — “Institutional Rebound Setup” If 340–305 holds firmly, the market may form a strong bullish reversal: 1. Bullish confirmation from the zone Look for: Strong bullish 2D candle Long lower wick Rejection from 305 followed by a close above 340 This would indicate aggressive buy-side defense. 2. Upside targets (layered resistances) 385 → first resistance, local take-profit zone 460 → key supply zone 560 → major resistance from previous distribution 725 → high-range target if bullish continuation strengthens Bullish narrative: > If the 305–340 zone is defended again, TAO is likely preparing for a multi-wave bullish move toward upper-range resistances. --- 📉 Bearish Scenario — “Breakdown = Trend Reset” If price closes below 305 on the 2D chart, the structure shifts into a deeper corrective phase: 1. Breakdown of the Golden Zone Buyers lose control A failed retest of 305–340 → confirmation of bearish dominance 2. Downside targets 260–220 → next minor support 163 → major structural low and liquidity magnet in a full breakdown scenario Bearish narrative: > Losing 305 is not a simple breakdown — it signals a trend cycle reset and opens the door for deeper distribution. --- 🔍 Market Mood & Pattern: Range, Traps, and Energy Compression TAO has been forming a large multi-month range Repeated fakeouts and long wicks → liquidity hunting, not trending This type of structure usually forms before a major breakout or major dump Price is sitting at the tail end of compression — the next move out of 340–305 will define the coming trend direction. #TAOUSDT #TAO #CryptoAnalysis #KeyLevels #MarketStructure #DemandZone #Breakout #Liquidity #SwingTrading #CryptoOutlook
CryptoNuclear
DASH/USDT - Ready for a New Rally? Strong Trendline Break?

DASH is entering a highly critical phase. After a deep corrective move, the price has finally broken above the main downtrend line, which has been suppressing every bullish attempt for several sessions. This breakout is not just a casual push — it occurred exactly after the market retested the strong demand zone at $83–$75, an area that has repeatedly acted as an accumulation block for larger players. The market structure paints a clear story: Impulsive rally toward $150 → distribution → controlled retracement. A series of lower highs → well-defined downtrend → bearish pressure gradually fading. Strong 4H breakout above the trendline → early trend reversal signal. DASH now stands at an inflection point. Buyers successfully defended the demand zone, and the next move will determine whether this breakout evolves into a full bullish reversal or simply a temporary relief rally. --- Bullish Scenario (Rising Momentum + Structural Shift) If the buyers maintain this momentum, the bullish setup becomes very compelling: 1. Successful retest/hold above the broken trendline → validation of the reversal. 2. Clean 4H breakout above $96.9 → opens the next range. 3. Upside targets become: Target 1: $105 Target 2: $134 (major supply zone) Primary Target: $149–150 (previous swing high) A confirmed breakout above $134 would signal the start of a larger markup phase. --- Bearish Scenario (If the Breakout Turns Into a Fakeout) The bearish scenario activates only if price breaks back below the $83–$75 demand zone. A 4H close beneath this region would: Invalidate the bullish breakout Shift structure back into bearish continuation Confirm downside targets toward: $68 $60 And in an extended selloff, a revisit to the $40 region. This $83–$75 zone remains the final defensive line for buyers. As long as it holds, bullish bias stays intact. --- Key Pattern Breakdown Downtrend Breakout → transition from distribution to accumulation. Demand Zone Rejection ($83–$75) → shows strong buy-side interest and potential structural reversal. Potential Higher Low Formation → early stages of bullish trend development. Continuation Potential if $96.9 is broken with strength. These elements suggest that DASH may be preparing for the early phase of an uptrend — pending confirmation. --- Technical Insight Bulls have successfully defended structural support above the demand zone. Momentum shift appears after the trendline break. A confirmed 4H close above $96.9 will likely activate the next leg upward. Any pullback into the $83–$75 zone remains a high-value accumulation area (as long as the zone holds). #DASH #DASHUSDT #CryptoAnalysis #Breakout #Reversal #DemandZone #PriceAction #CryptoMarkets #TechnicalAnalysis
CryptoNuclear
NJ/USDT — Major Decision Zone: Massive Reversal or a Breakdown?
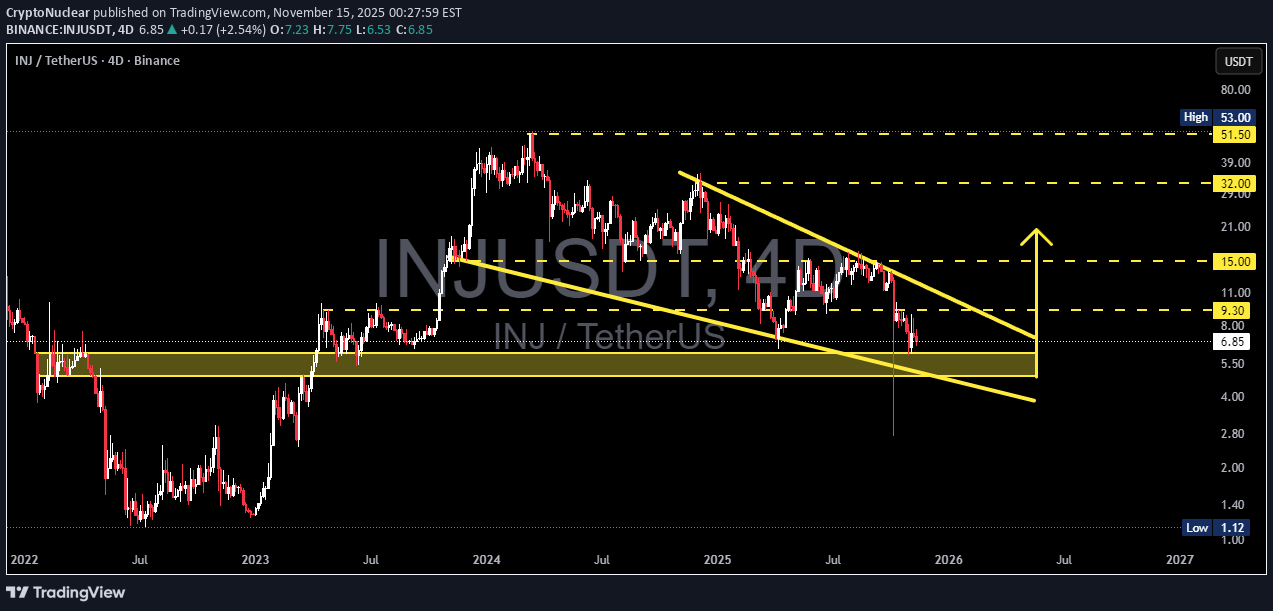
INJ is currently at a critical moment within its broader market structure. The price has returned to the historical demand zone at 6.1–4.9, an area that previously triggered a large rally. The market’s reaction here will dictate whether INJ is preparing for a major bullish reversal, or entering a continuation of the bearish trend toward lower levels. The current formation resembles a medium-term Falling Wedge, a pattern typically known for signaling a potential reversal if a breakout occurs. However, selling pressure still dominates, with a persistent sequence of lower highs kept in check by the descending upper trendline. One of the most interesting elements on this chart is the long wick sweeping below support, indicating liquidity grabbing — many stop losses were triggered before the price was pulled back up. This is often an early sign that the market may be preparing to move in the opposite direction, but only if bullish confirmation follows. Without a breakout, the structure remains firmly under bearish control. In short: ➡️ INJ is standing at its biggest decision point for the coming weeks. --- Bullish Scenario — “High-Potential Reversal from the Golden Zone” Bullish Triggers A strong bounce from 6.1–4.9 with a solid 4D bullish candle. A clear breakout above the wedge’s upper trendline. Increasing buy volume accompanying the breakout. Bullish divergence appearing on momentum indicators (RSI/MACD). Bullish Targets (Tiered & Based on the Chart) 1. 9.3 USDT → first resistance and early bullish validation. 2. 15 USDT → medium-term resistance to test trend strength. 3. 32 USDT → major target if a mid-term uptrend forms. 4. 51.5 USDT → long-term major supply for a super-bullish scenario. Bullish Narrative If INJ successfully breaks out of this wedge, the structure will strongly resemble a classic reversal pattern, often marking the beginning of a significant impulsive move. --- Bearish Scenario — “Support Break Leads to Trend Continuation” Bearish Triggers A 4D candle closing below 4.9, breaking the demand zone. No strong buying reaction on the retest of the broken support. Increasing sell volume during the breakdown. Bearish Targets (Tiered) 1. 3.0 USDT → psychological level & previous structural zone. 2. 1.12 USDT → extreme downside target if the long-term structure collapses. Bearish Narrative If the 6.1–4.9 zone fails to hold, the bearish momentum that has been building since early 2024 is likely to continue, and the wedge structure turns into a medium-term bearish channel. --- Pattern Explanation The chart currently forms a Falling Wedge (traditionally bullish). But until a breakout occurs, the pattern remains controlled by sellers. The 6.1–4.9 yellow zone acts as the key demand block — the buyers’ last major line of defense. The long lower wick indicates a liquidity sweep, often preceding a trend shift. The descending upper trendline has rejected every attempt at recovery since 2024 — a breakout here is the most crucial signal for a bullish move. --- #INJ #Injective #INJUSDT #CryptoAnalysis #PriceAction #CryptoChart #SupportAndResistance #FallingWedge #CryptoBreakout #AltcoinAnalysis #TechnicalAnalysis #MarketStructure
CryptoNuclear
XMR/USDT - Rounded Bottom Signals: Breakout New Bullish Cycle?
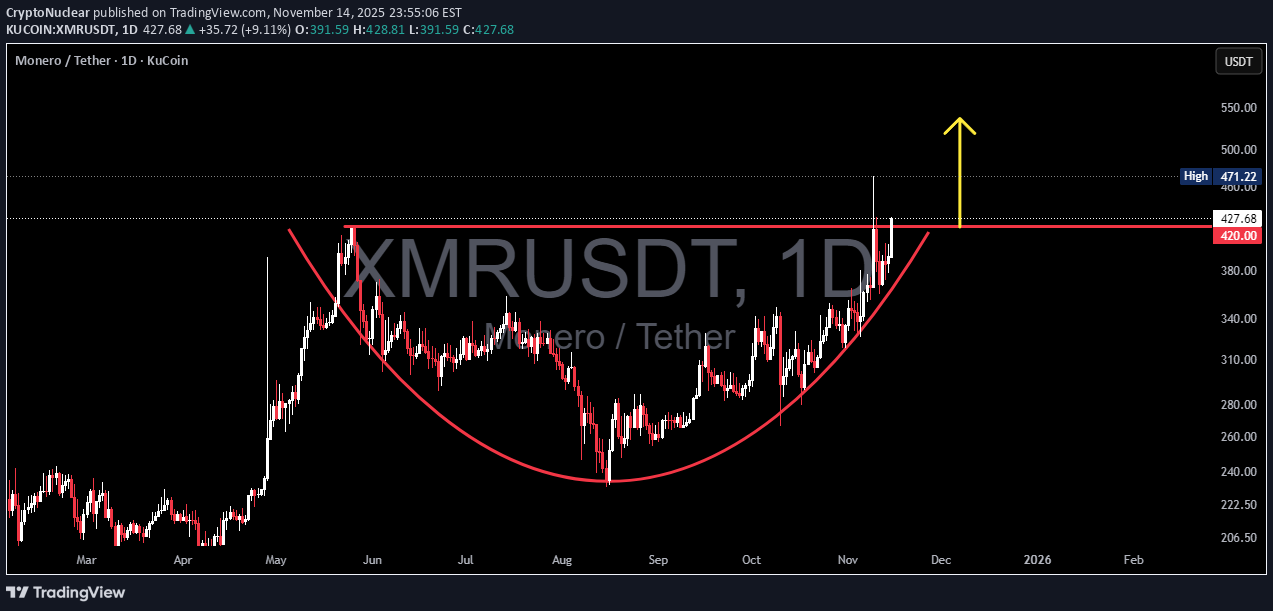
XMR has finally broken out of one of the strongest technical structures on the daily timeframe: a multi-month rounded bottom, a pattern that typically marks the transition from long distribution phases into new bullish cycles. After establishing a stable base near $235, price has been rising gradually, forming a clean upward curvature that reflects a steady shift from selling pressure toward sustained accumulation. A rounded structure this smooth rarely appears unless buyers have been consistently absorbing supply for a long period. Now, the market has touched and pierced the major historical resistance at $426, a level that has capped price for months. This breakout validates the pattern and suggests the market is shifting from consolidation into expansion. The quick spike toward $471 shows aggressive buying interest but also marks this region as a liquidity cluster that will play a crucial role in determining continuation. As long as price holds above the $420–426 rim, buyers maintain full control and the bullish probability remains dominant. Given the depth of the pattern at roughly $191, the measured breakout target sits around $615–$620, which is structurally reasonable if the breakout is confirmed and $426 flips into reliable support. --- Pattern Explanation (Clear and In-Depth) Pattern name: Rounded Bottom / Cup (pure cup, no handle formation). Formation duration: Multi-month, which increases reliability. Characteristics: stable bottom, consistent upward curvature, repeated rejections at the same horizontal level → market completing a major accumulation phase. Breakout confirmation: daily candle closing above the rim → shift in medium-term market structure. Large rounded bottoms like this are often precursors to trend reversals and are known for initiating strong directional moves. --- Bullish Scenario (Primary Outlook) 1. Price forms a clean daily close above $426. 2. Ideal retest occurs at $420–430 with lower-wick support and rising volume. 3. If confirmed, continuation targets become: $471 (local liquidity zone) $520 (psychological resistance) $618 (measured move) as the main structural target 4. As long as price holds above the ascending support and does not close below $420, the bullish structure remains intact. Market narrative: buyers are controlling the tempo, and momentum is transitioning decisively upward. --- Bearish Scenario (If Breakout Fails) 1. Breakout becomes a false breakout if price closes back below $420. 2. This would expose deeper corrective zones: $380–400 (ascending support) $340 $300 Even a return to the base of the pattern in a worst-case scenario 3. Bearish confirmation signals include: low breakout volume, repeated upper-wick rejections, and daily closes below the rim. Market narrative: buyers lose control, and the asset slips back into prolonged accumulation. --- Additional Insight A rounded bottom of this scale is more than a pattern; it often reflects a major shift in market psychology. It typically marks the transition from weak, low-interest conditions to renewed investor engagement. When paired with a breakout at a long-standing resistance, this formation is one of the strongest signals for potential medium-to-long-term trend continuation. For XMR, the structure shows that selling pressure that dominated earlier in the year has faded, and buyers are beginning to establish a clear advantage. --- #XMRUSDT #Monero #CryptoAnalysis #RoundedBottom #Breakout #TechnicalAnalysis #PriceAction #MarketStructure #CryptoTrading
CryptoNuclear
ATOM/USDT — Diving into the Zone 2.4–1.9: Breakout or breakdown?
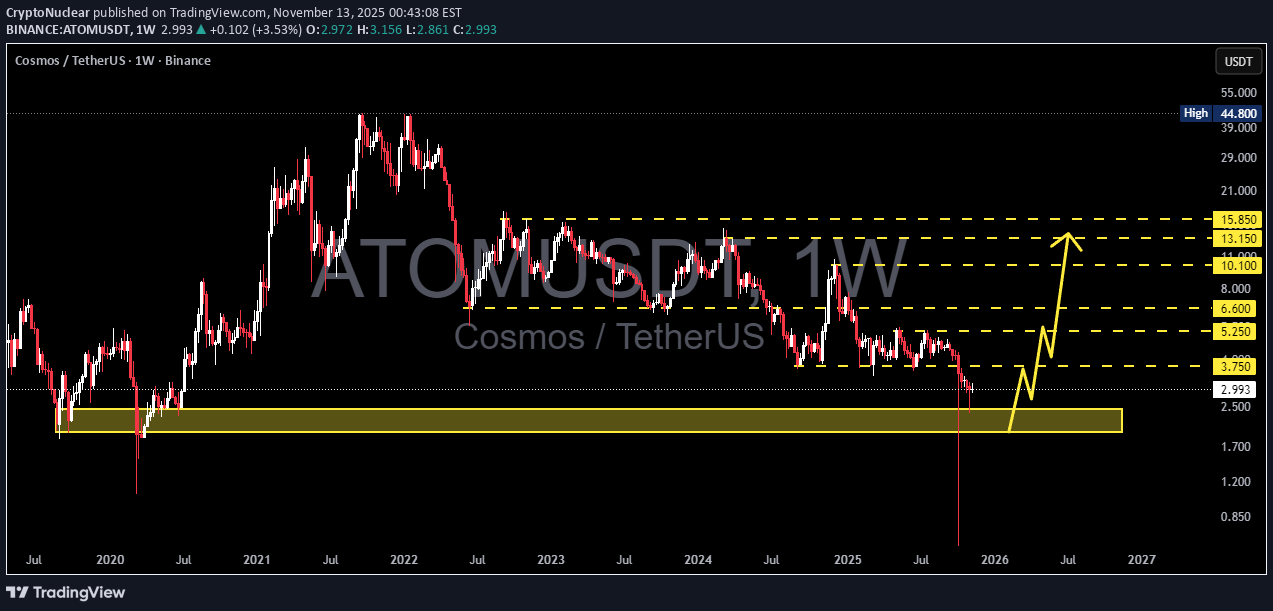
Cosmos (ATOM) is now standing at its most critical point in recent years, precisely within the historical support zone of 2.45–1.95, which has served as a major accumulation area since the early phase of the 2020 bull run. This zone isn’t just a number—it represents the psychological foundation of ATOM’s market. In recent weeks, the weekly chart has shown a sharp decline followed by a long lower wick, signaling a massive liquidity sweep. In other words, many long positions were flushed out before price was pulled back up — an indication that smart money might be accumulating here, though no confirmed reversal has occurred yet. Technically, ATOM remains in a medium- to long-term downtrend, forming a series of lower highs and lower lows since 2022. However, the current level opens two major possibilities — the beginning of a new accumulation phase, or the continuation of the final capitulation wave. --- Pattern Structure & Technical Context 1. Main Trend: The multi-year downtrend remains intact. 2. Golden Zone (Historical Support): 2.45–1.95 — the same accumulation area that fueled the 2021 bull run. 3. Fakeout & Liquidity Sweep: The long wick below the zone shows liquidity collection, a potential reversal signal if confirmed by a bullish weekly candle. 4. Reversal Confirmation: Requires a weekly close above 3.75, followed by a successful retest. 5. Volume & Divergence: Watch for bullish divergence on RSI or MACD to reinforce reversal strength. --- BULLISH SCENARIO – “The Rebirth Zone” If price holds and rebounds strongly from the 2.45–1.95 zone, this could mark the beginning of a major re-accumulation phase. The bullish case strengthens if: A weekly close above 3.75 occurs (reclaiming old structural support). The move is supported by strong volume and a solid bullish candle. A higher low forms above 2.45. Step-by-step target levels: ➡️ 3.75 → 5.25 → 6.60 → 10.10 → 13.15 → 15.85 If momentum continues, a potential Adam & Eve Reversal or Inverse Head & Shoulders could form in this zone, signaling the transition from bear market to a new bull trend. Core Bullish Idea: The 2.45–1.95 zone is a “life-or-death point” — holding above it offers a high-reward setup compared to the downside risk. --- BEARISH SCENARIO – “Break the Floor” However, if a weekly close occurs below 1.95, this historical support would be officially invalidated. This could trigger: A final capitulation wave toward 1.20 or even 0.85, levels that previously acted as a base before the 2020 rally. A failed retest of the 2.45–1.95 zone (flipping it into resistance). Weakening market sentiment, pushing ATOM into a prolonged bearish continuation phase. In this case, traders should wait for a confirmed bottom before accumulating, as further downside risk remains open. --- CONCLUSION ATOM is now at the ultimate battlefield between buyers and sellers. If the 2.45–1.95 zone holds, we could witness the early stages of ATOM’s major recovery, potentially heading back toward the 5–10 USD range. But if it breaks down, the long-term bull structure officially collapses, and the market may seek equilibrium much lower. The coming weeks will determine whether this zone becomes the foundation of a rebirth, or the gateway to deeper decline. --- #ATOMUSDT #Cosmos #CryptoAnalysis #WeeklyChart #SupportZone #MarketStructure #SwingTrade #BullishReversal #BearishBreakdown #TradingViewAnalysis #TechnicalAnalysis
CryptoNuclear
ICP — Golden Pocket Retest: Reversal or Continuation Down?
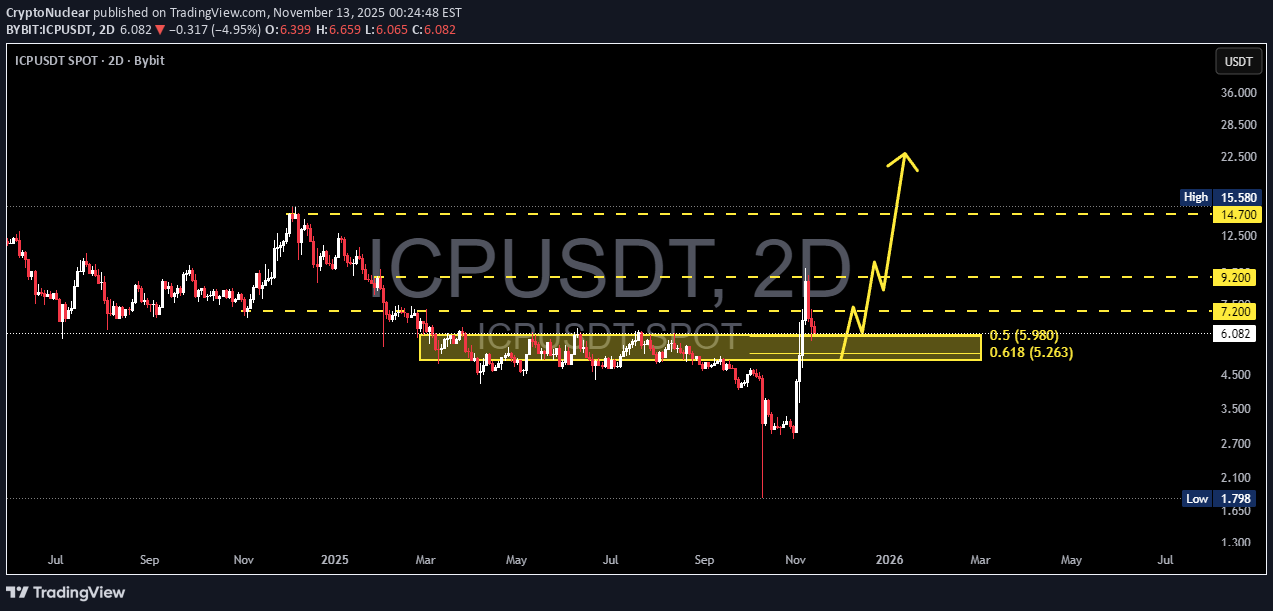
After a long period of accumulation followed by an extreme capitulation phase, ICP is finally showing signs of life again. The recent sharp rally managed to break through several mid-term supply levels, but now the price is retesting the most critical zone on the chart — the Fibonacci Golden Pocket (0.5–0.618) range between $5.26–$5.98. This yellow box is not just another technical bounce zone — it’s the decisive point for ICP’s mid-term direction: will ICP continue its recovery toward the former distribution area at $9.20 to $14.70, or will it fall back into the depths below $2.00? --- Structure & Pattern Phase 1: Sideways Accumulation (Early 2025) The price moved sideways for months — a strong sign of silent accumulation by larger players. Phase 2: Capitulation & Sharp Recovery A deep breakdown followed by a vertical spike toward $15.58 shows a massive liquidity sweep — stop-losses were cleared out, and the market reacted with a relief rally. Phase 3: Golden Pocket Retest (Now) The price is retracing in a controlled manner back into the $5–$6 zone, now serving as a key confluence of horizontal structure and Fibonacci support. --- Bullish Scenario (Potential Reversal) If the price can hold the $5–$6 zone and form a strong 2D candle closing above $6.50–$7.20, a new Higher Low structure will be confirmed — signaling the possibility of the next bullish leg. Confirmation: Break & Retest above $7.20 Targets: Target 1 → $9.20 (minor supply zone) Target 2 → $14.70 (major resistance & previous high) Momentum Clues: Increasing volume on green candles and a developing bullish RSI divergence. This could mark the beginning of a mid-term reversal for ICP, with potential upside exceeding +140% from the current price (~$6.07). --- Bearish Scenario (Rejection Case) However, if the Golden Pocket fails to hold and a 2D close below $5.00 occurs, the entire rally may turn out to be nothing more than a dead cat bounce. In this case, ICP risks continuing its decline toward: First support: $3.00 Major support: $1.80 (historical low and liquidity base) A confirmed breakdown below $5.00 would indicate that the market structure remains fully under sellers’ control. --- Conclusion The $5.0–$6.0 range is the most decisive level for the coming months. If it holds and forms a higher low, ICP may enter a new bullish cycle — but if it breaks down, a new distribution phase could begin. 📊 The golden pocket will decide the next chapter: is this the start of ICP’s rebirth, or just another bounce before another collapse? --- Trading Plan Aggressive Entry: Buy between 5.3–6.0, SL < 4.8 Conservative Entry: Wait for a Break & Retest above 7.20 Take Profit Targets: 9.20 → 14.70 Bullish Invalidation: 2D Close below 5.0 --- #ICP #ICPUSDT #CryptoAnalysis #GoldenPocket #Fibonacci #PriceAction #CryptoReversal #AltcoinSeason #TechnicalAnalysis #CryptoBreakout #MarketStructure
Disclaimer
Any content and materials included in Finbeet's website and official communication channels are a compilation of personal opinions and analyses and are not binding. They do not constitute any recommendation for buying, selling, entering or exiting the stock market and cryptocurrency market. Also, all news and analyses included in the website and channels are merely republished information from official and unofficial domestic and foreign sources, and it is obvious that users of the said content are responsible for following up and ensuring the authenticity and accuracy of the materials. Therefore, while disclaiming responsibility, it is declared that the responsibility for any decision-making, action, and potential profit and loss in the capital market and cryptocurrency market lies with the trader.