
CryptoSanders9563
@t_CryptoSanders9563

What symbols does the trader recommend buying?
Purchase History
Trader Messages
Filter
Message Type
CryptoSanders9563
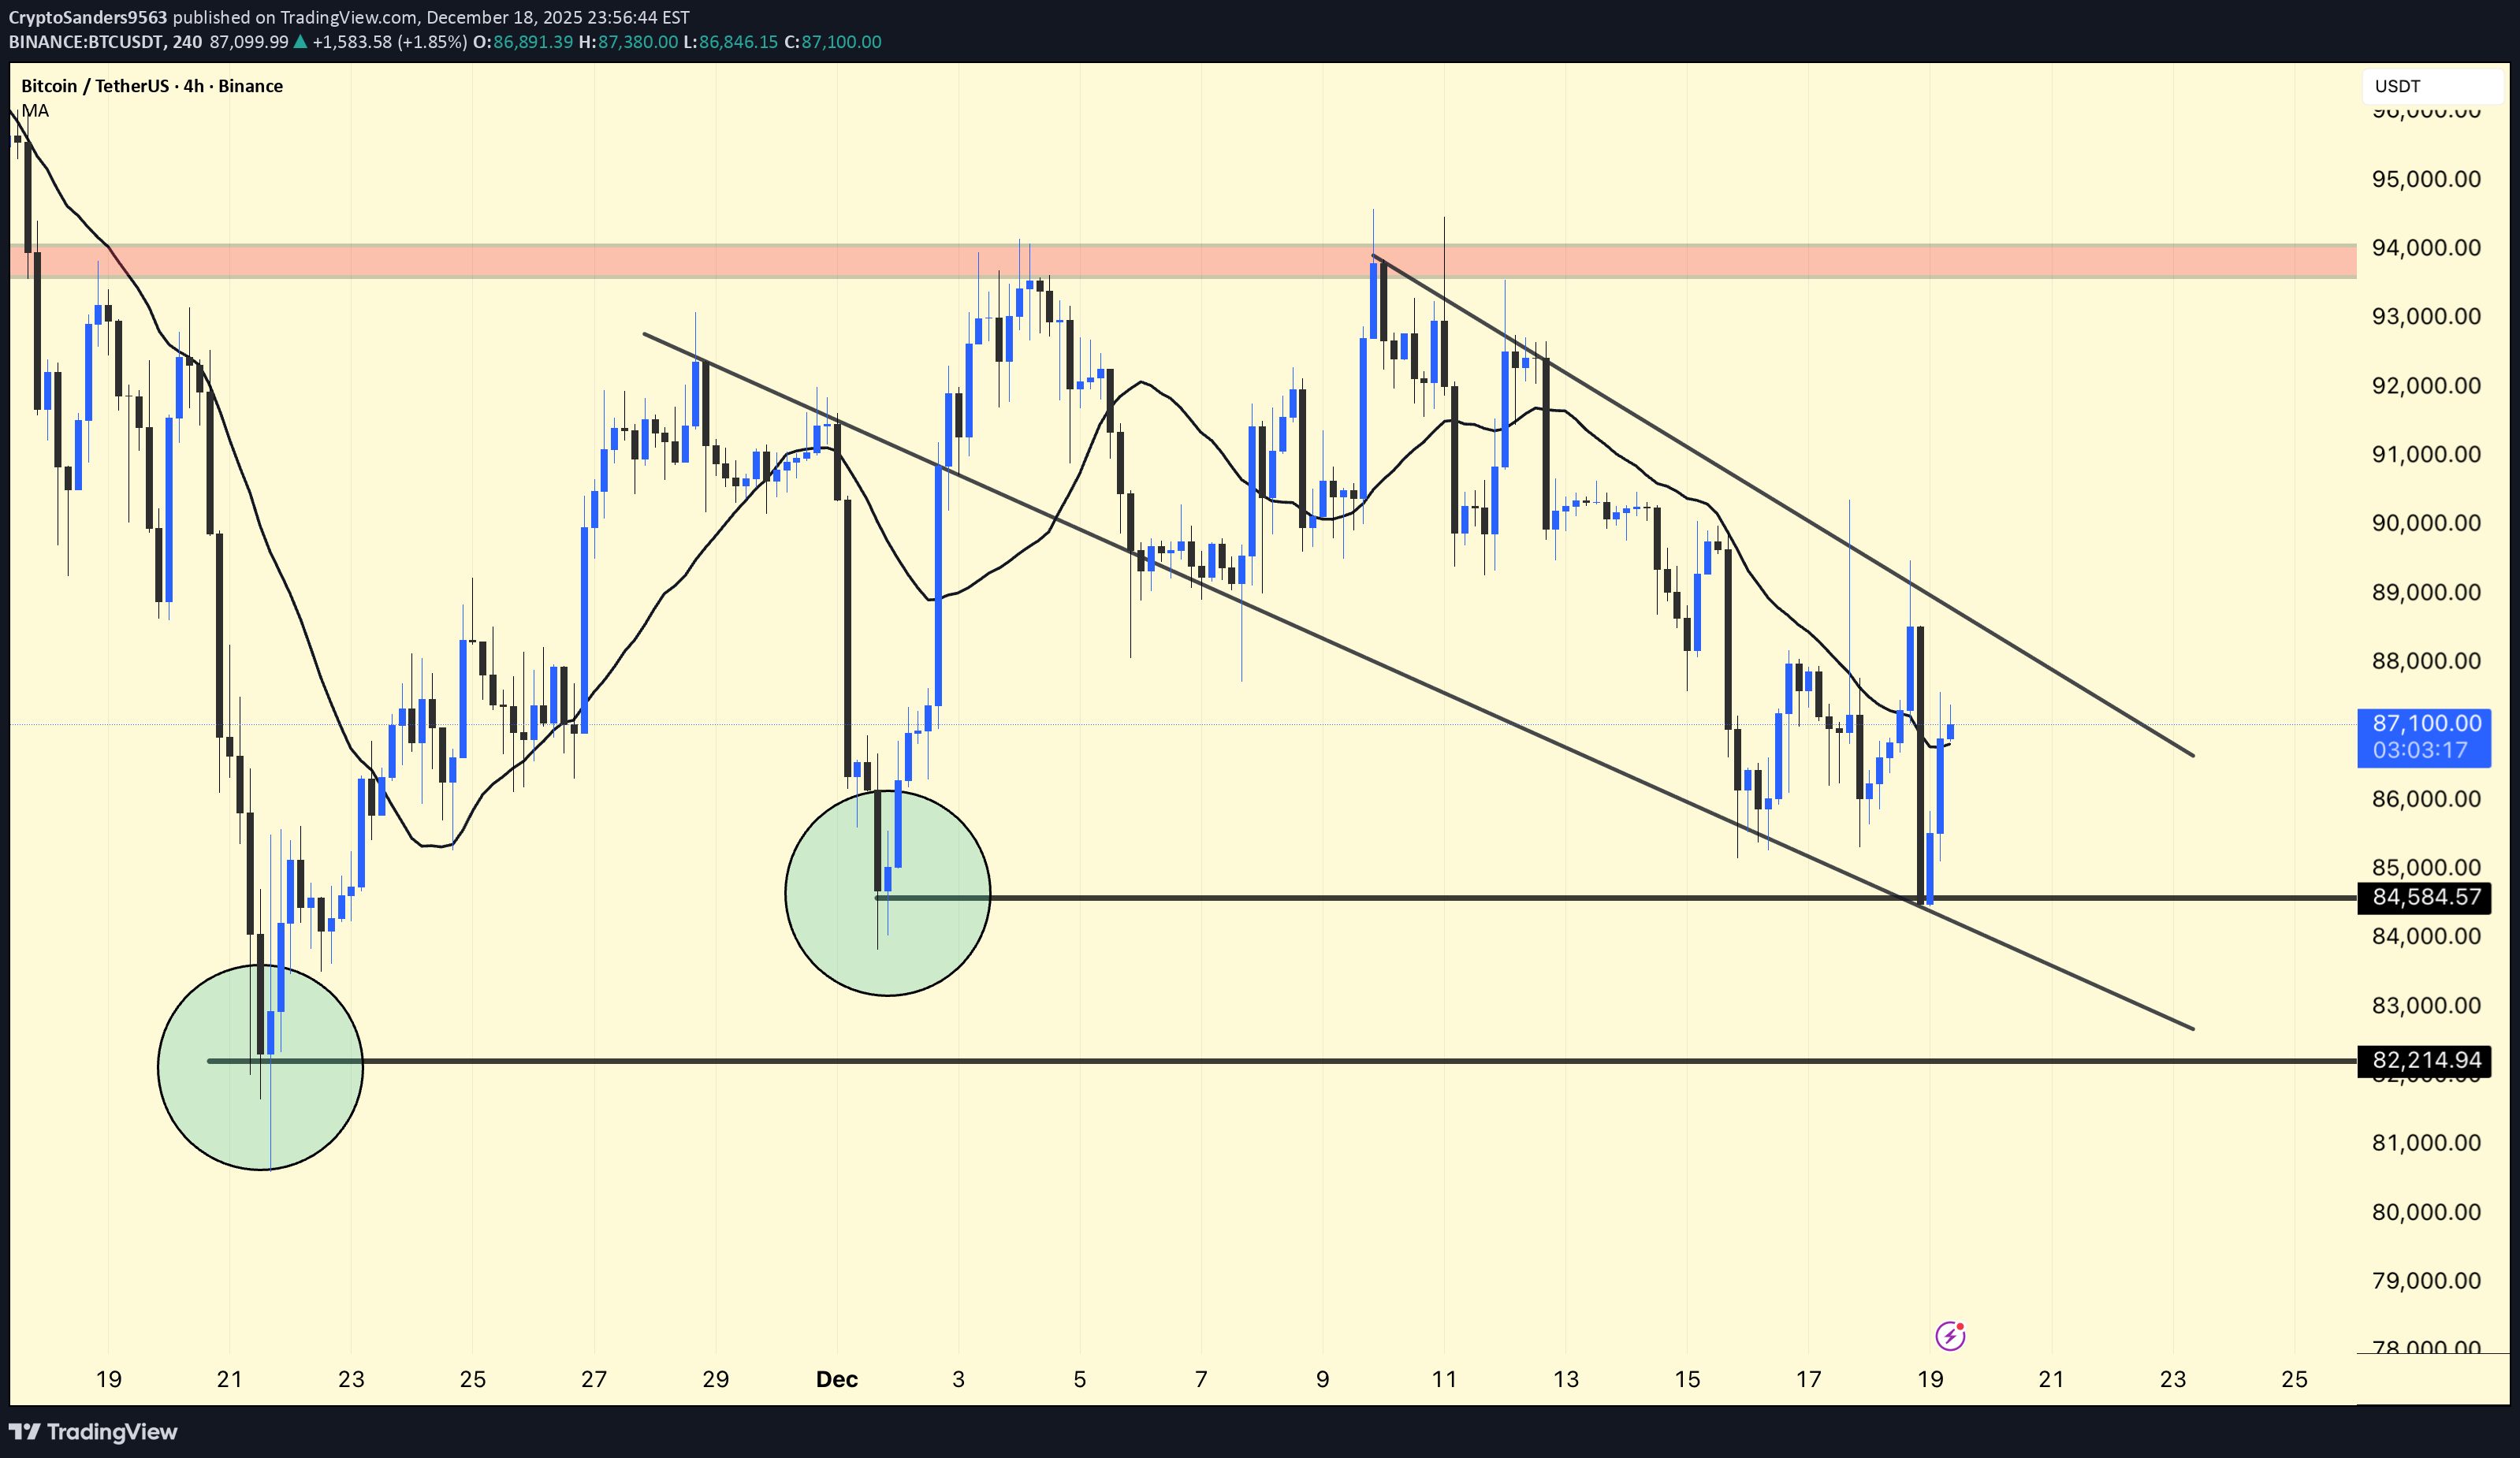
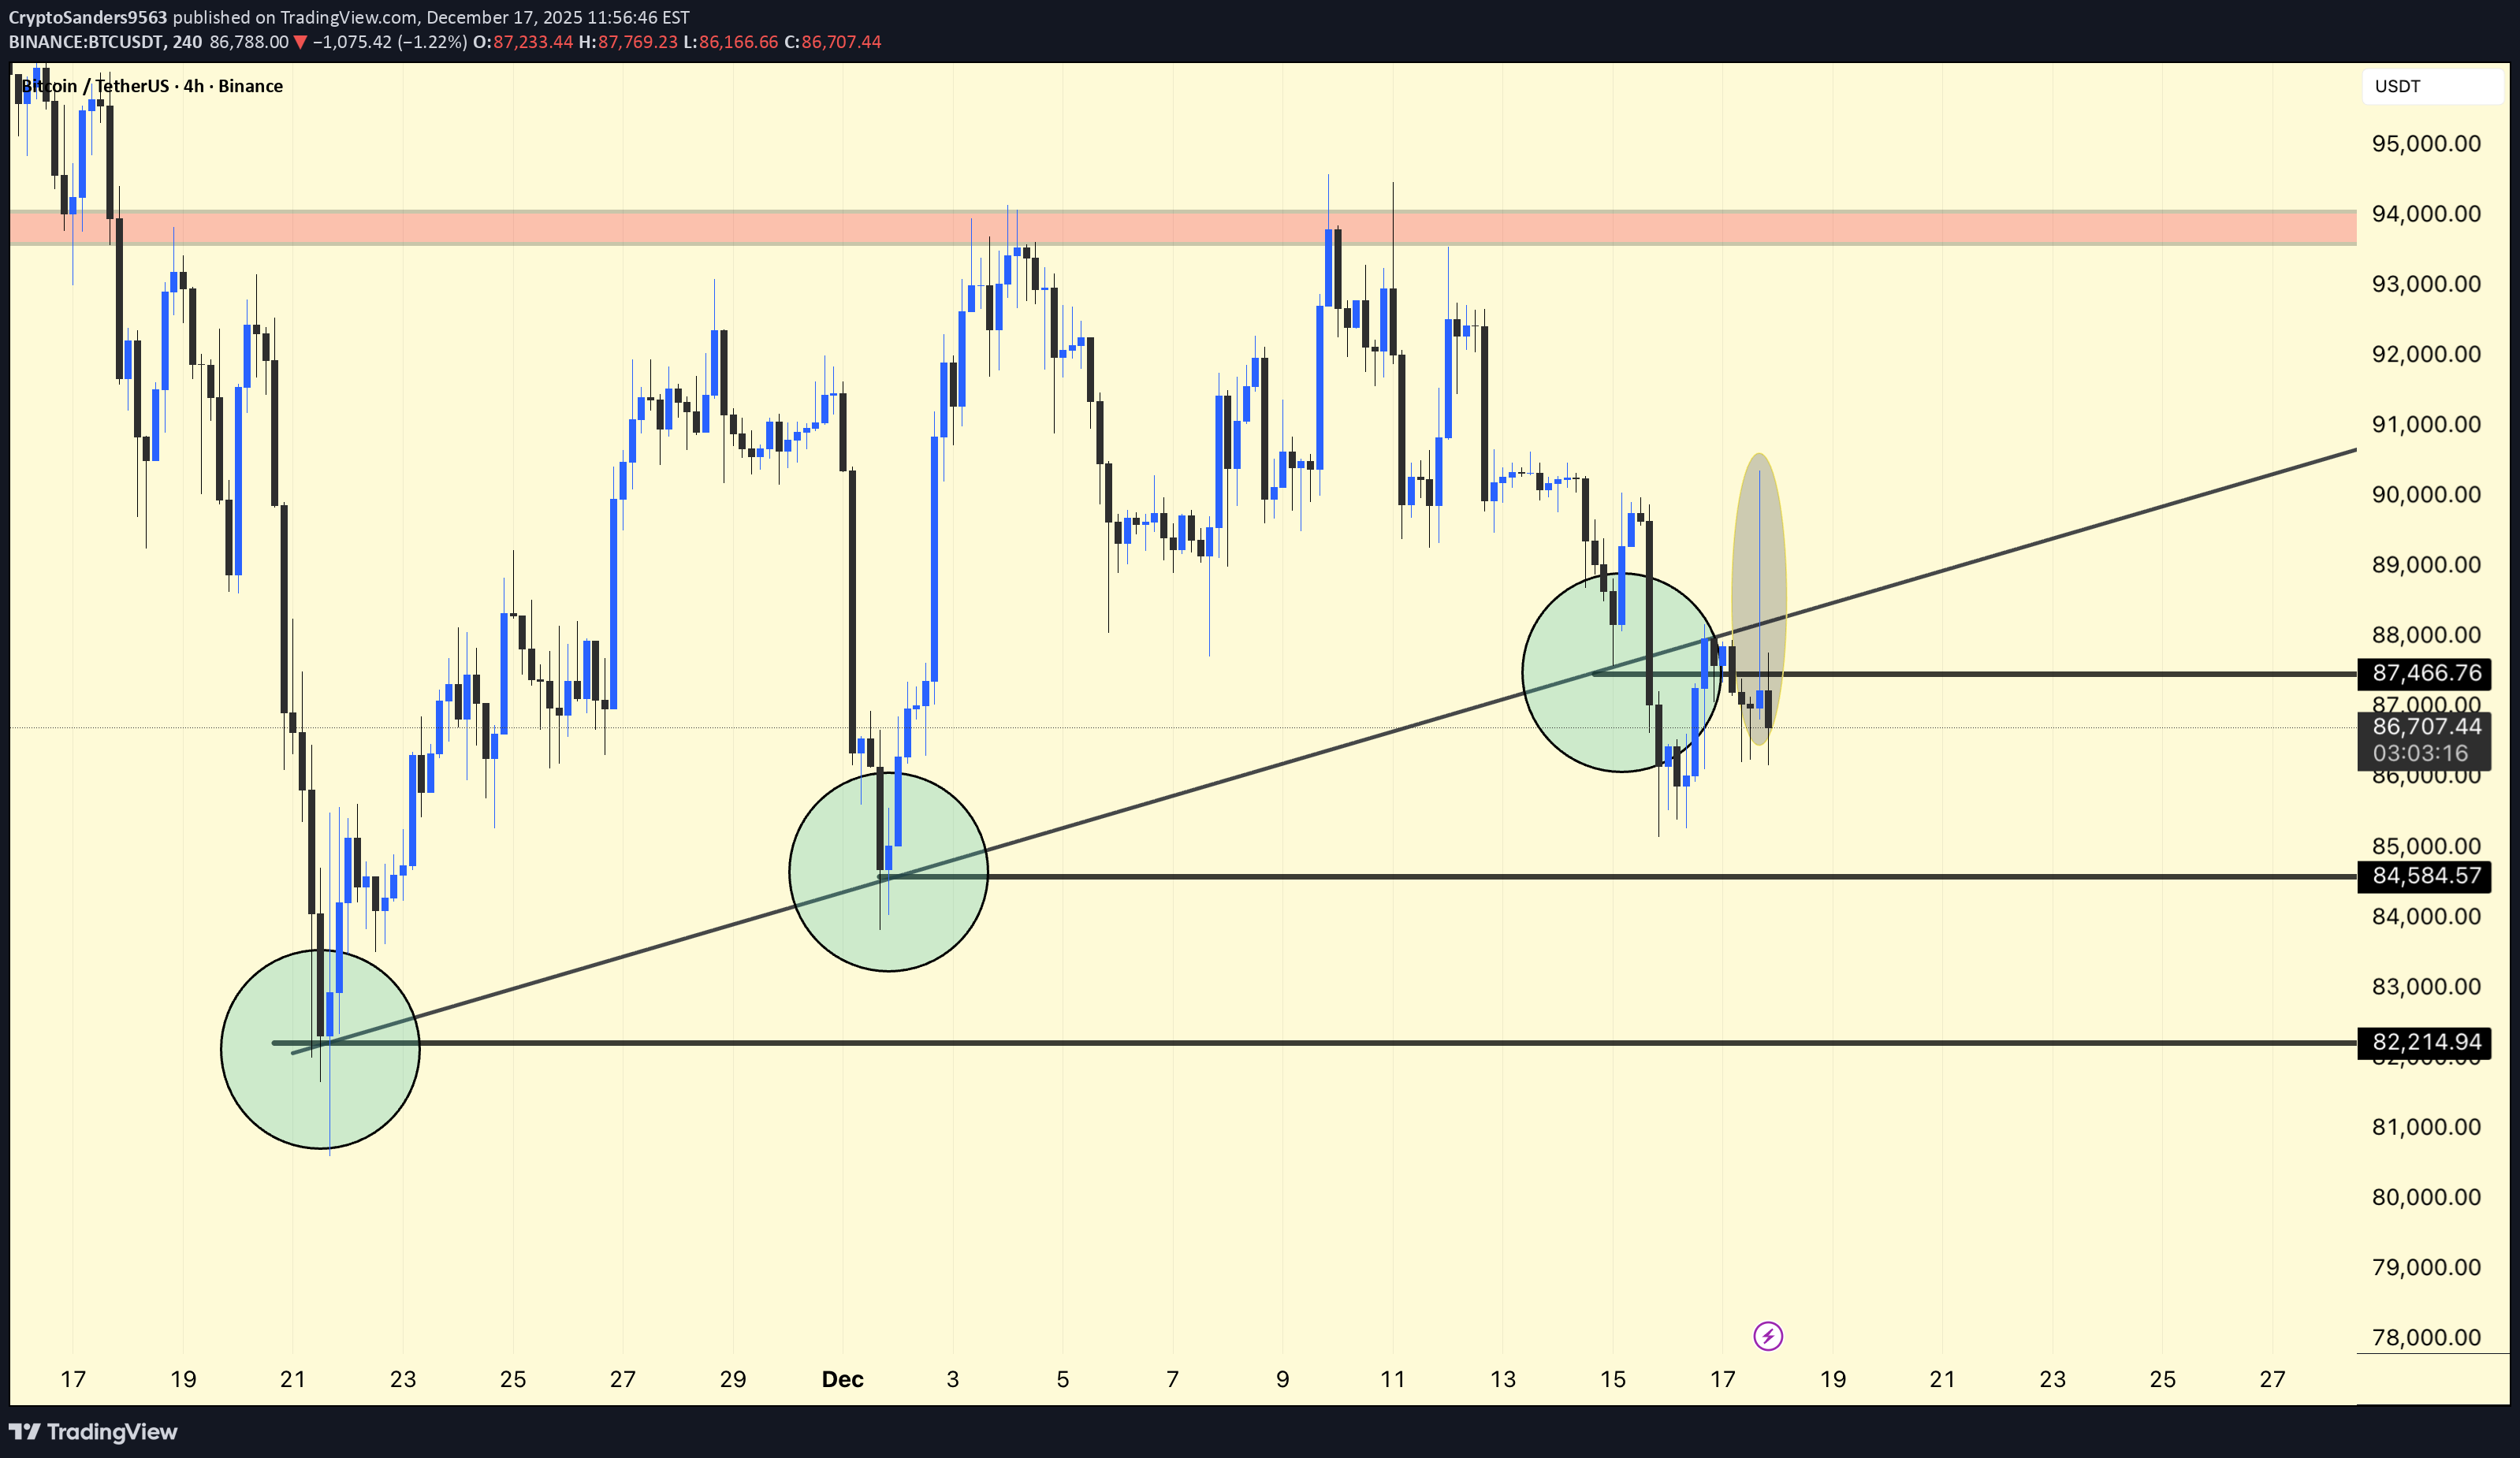
BTC/USDT – 4H Chart Update. Price swept liquidity near 84.5K and bounced → classic fake breakdown. Still moving inside a descending channel. 84.5K = key support (holding keeps bounce valid). 82.2K = invalidation level if support fails. Resistance: 88K → 92K–94K supply zone. Neutral to slightly bullish as long as 84.5K holds. Reclaim above 88K = upside continuation possible. Below 84.5K = increased risk of a deeper pullback. Not financial advice. Manage risk.
CryptoSanders9563
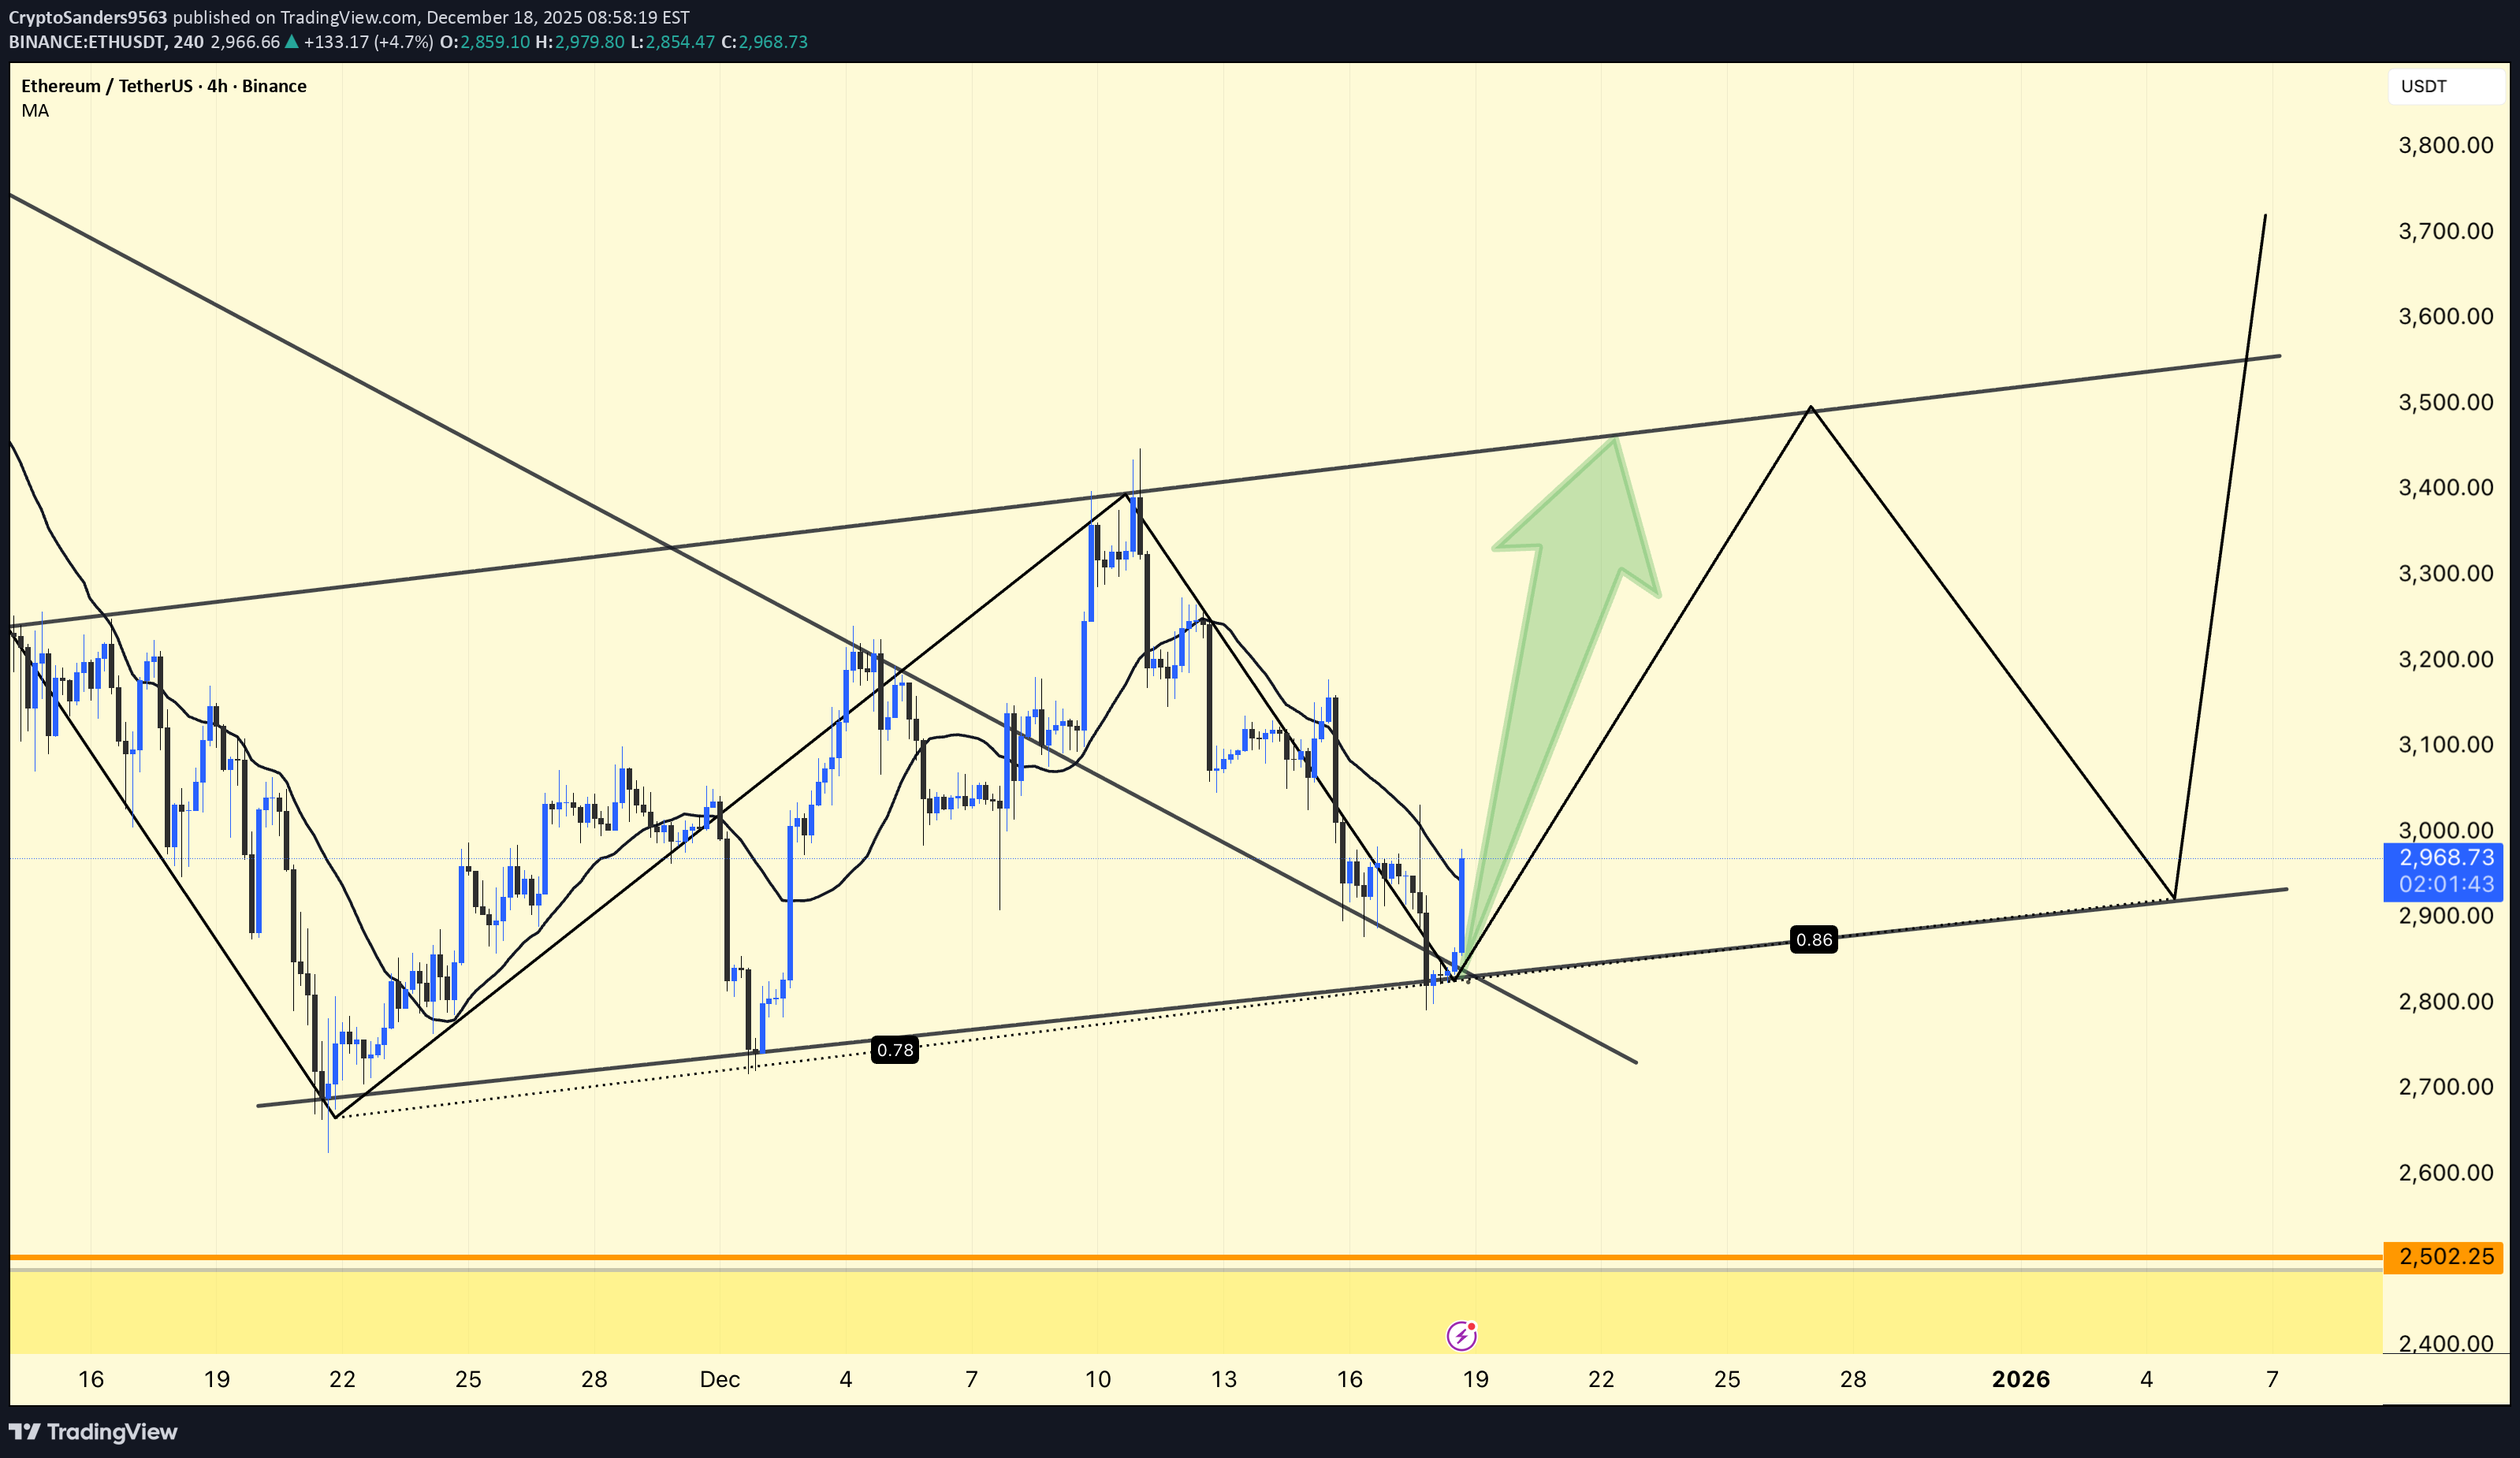
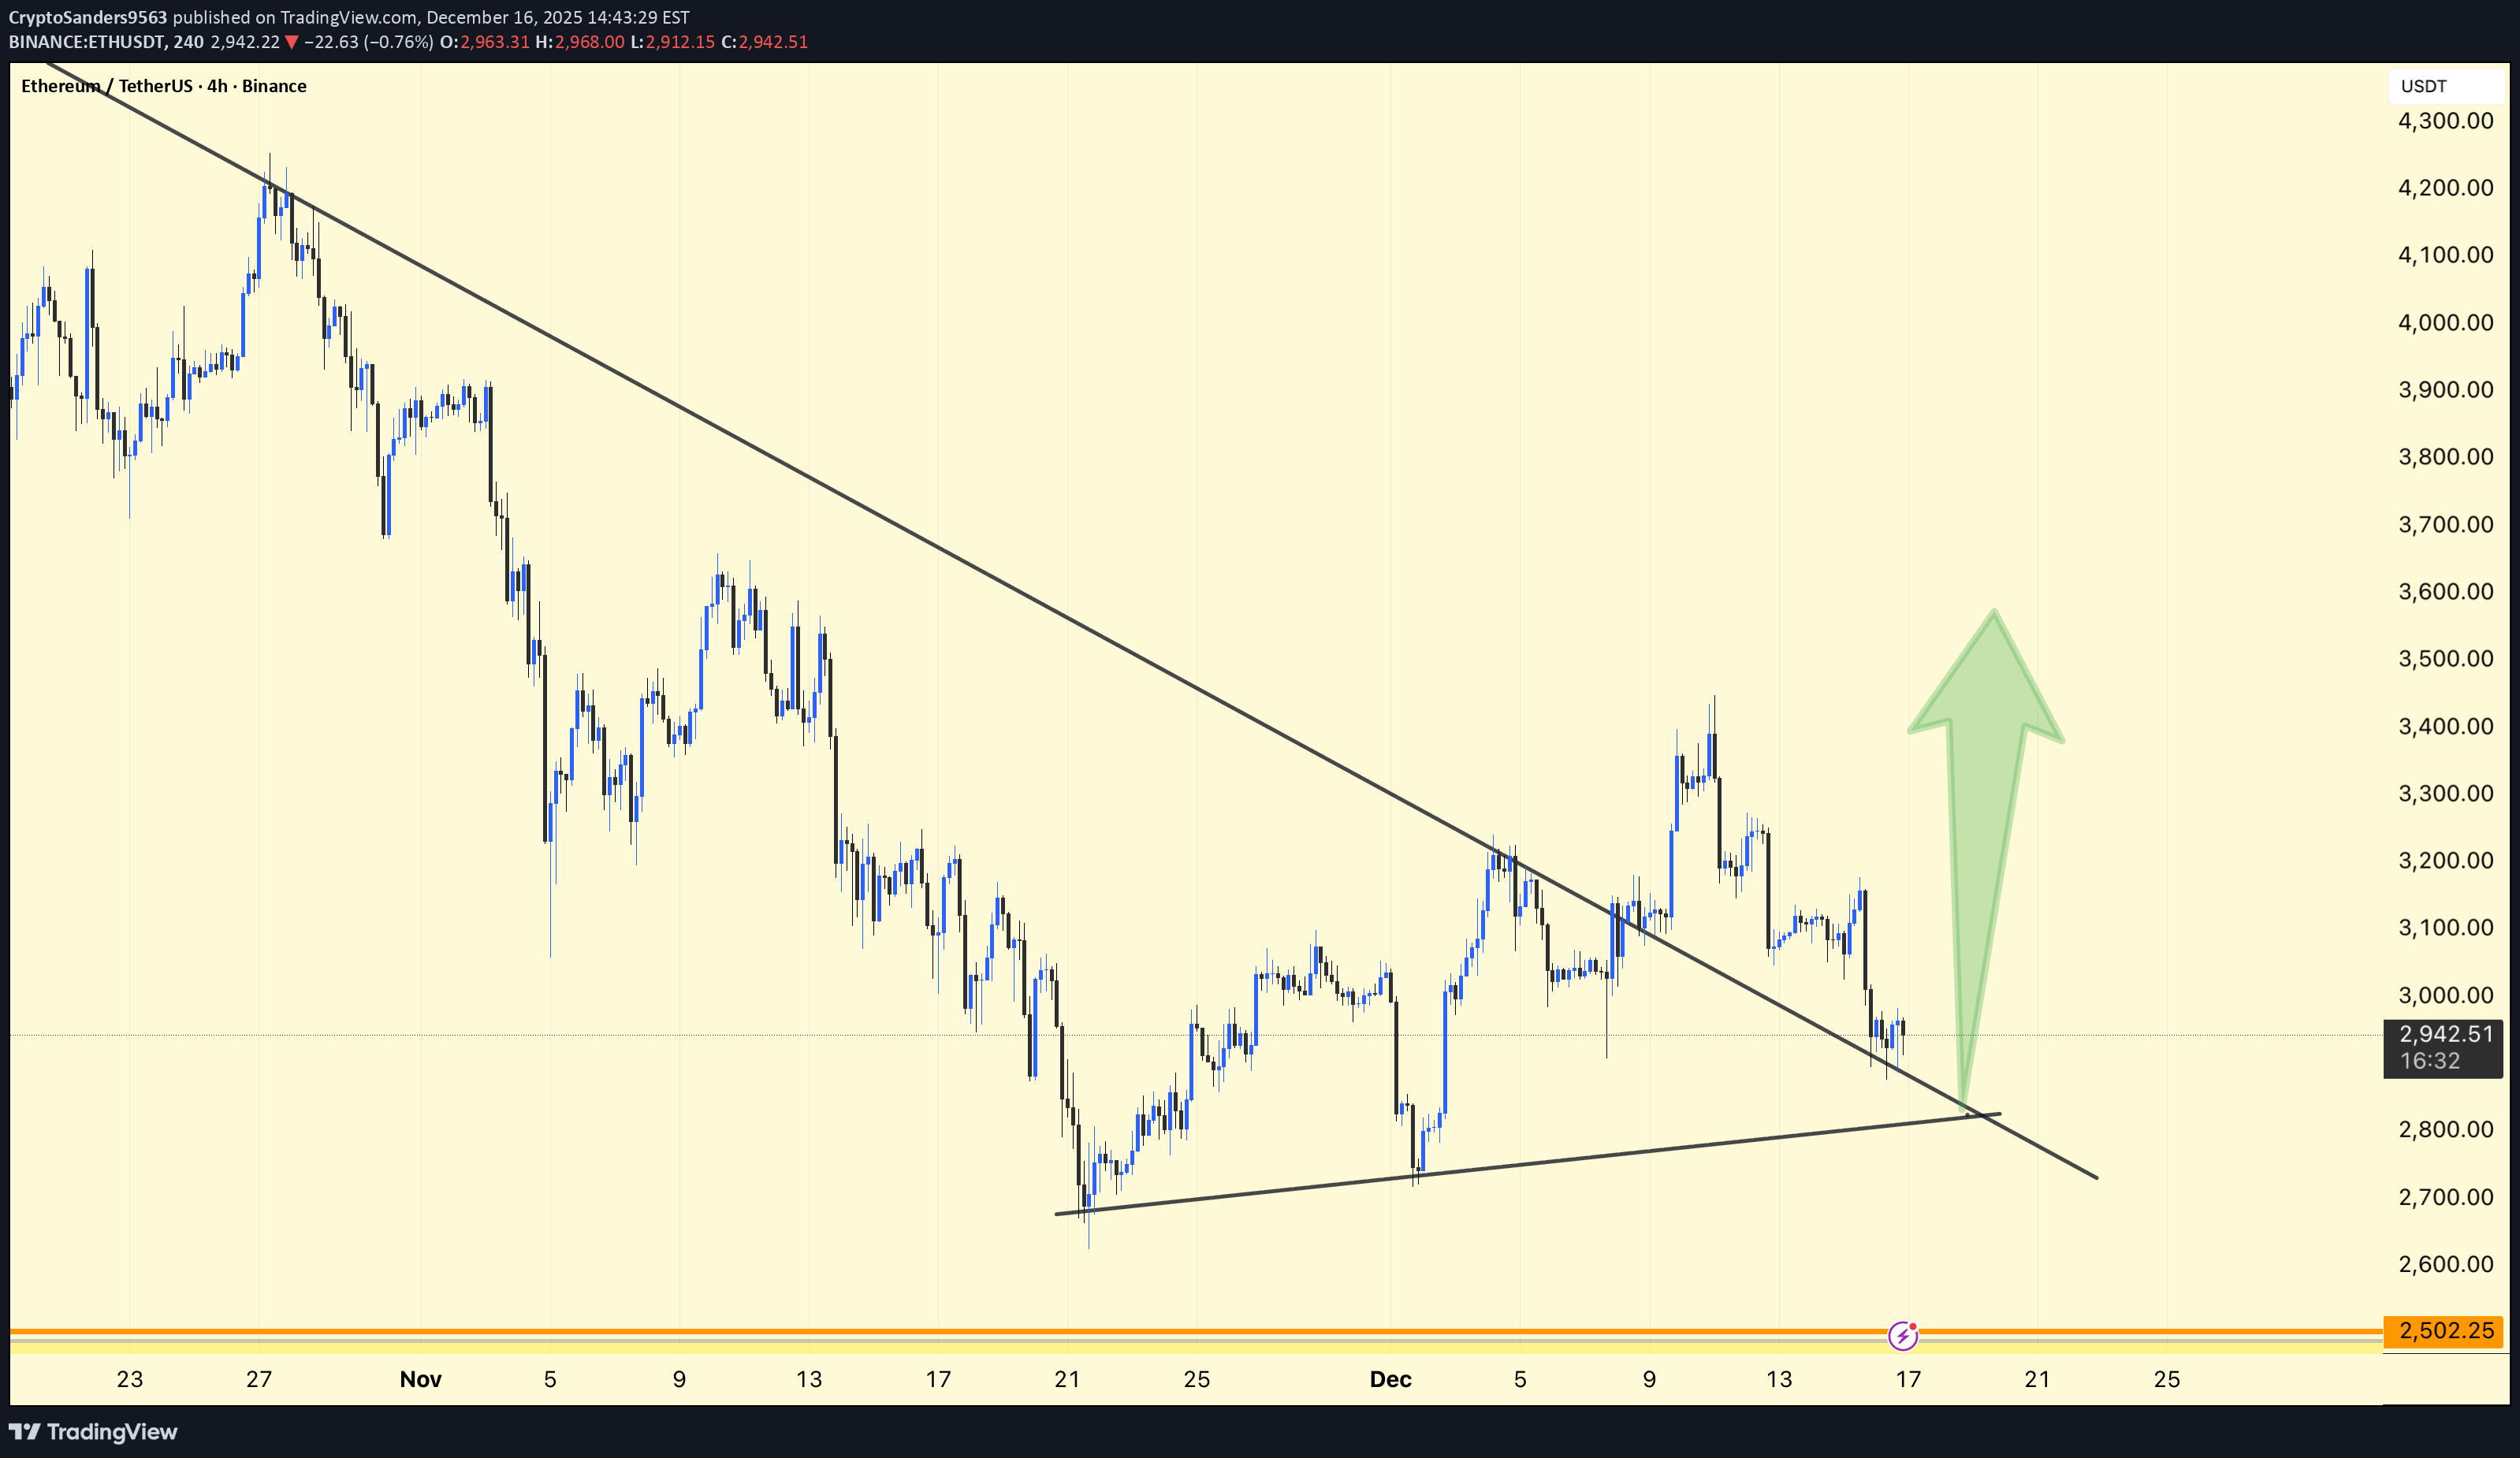
ETH/USDT – 4H Quick Update ETH has bounced strongly from the rising trendline support near 2,900, confirming that buyers are active. The price is now holding above the short-term moving averages, which supports a bullish short-term bias. The current move looks like a reaction from a demand zone, not a random pump. Support: 2,900–2,880 Resistance: 3,100–3,150 Targets: 3,300–3,400 (Upper trendline) 3,500+ if momentum increases ETH is reacting right from the main decision area. As long as the structure holds, the chart favors a continuation towards the upper trendline. ⚠️ This is not financial advice. Trade with confirmation and risk management. DYOR | NFA.
CryptoSanders9563
BTC/USDT –Chart Update (4H)
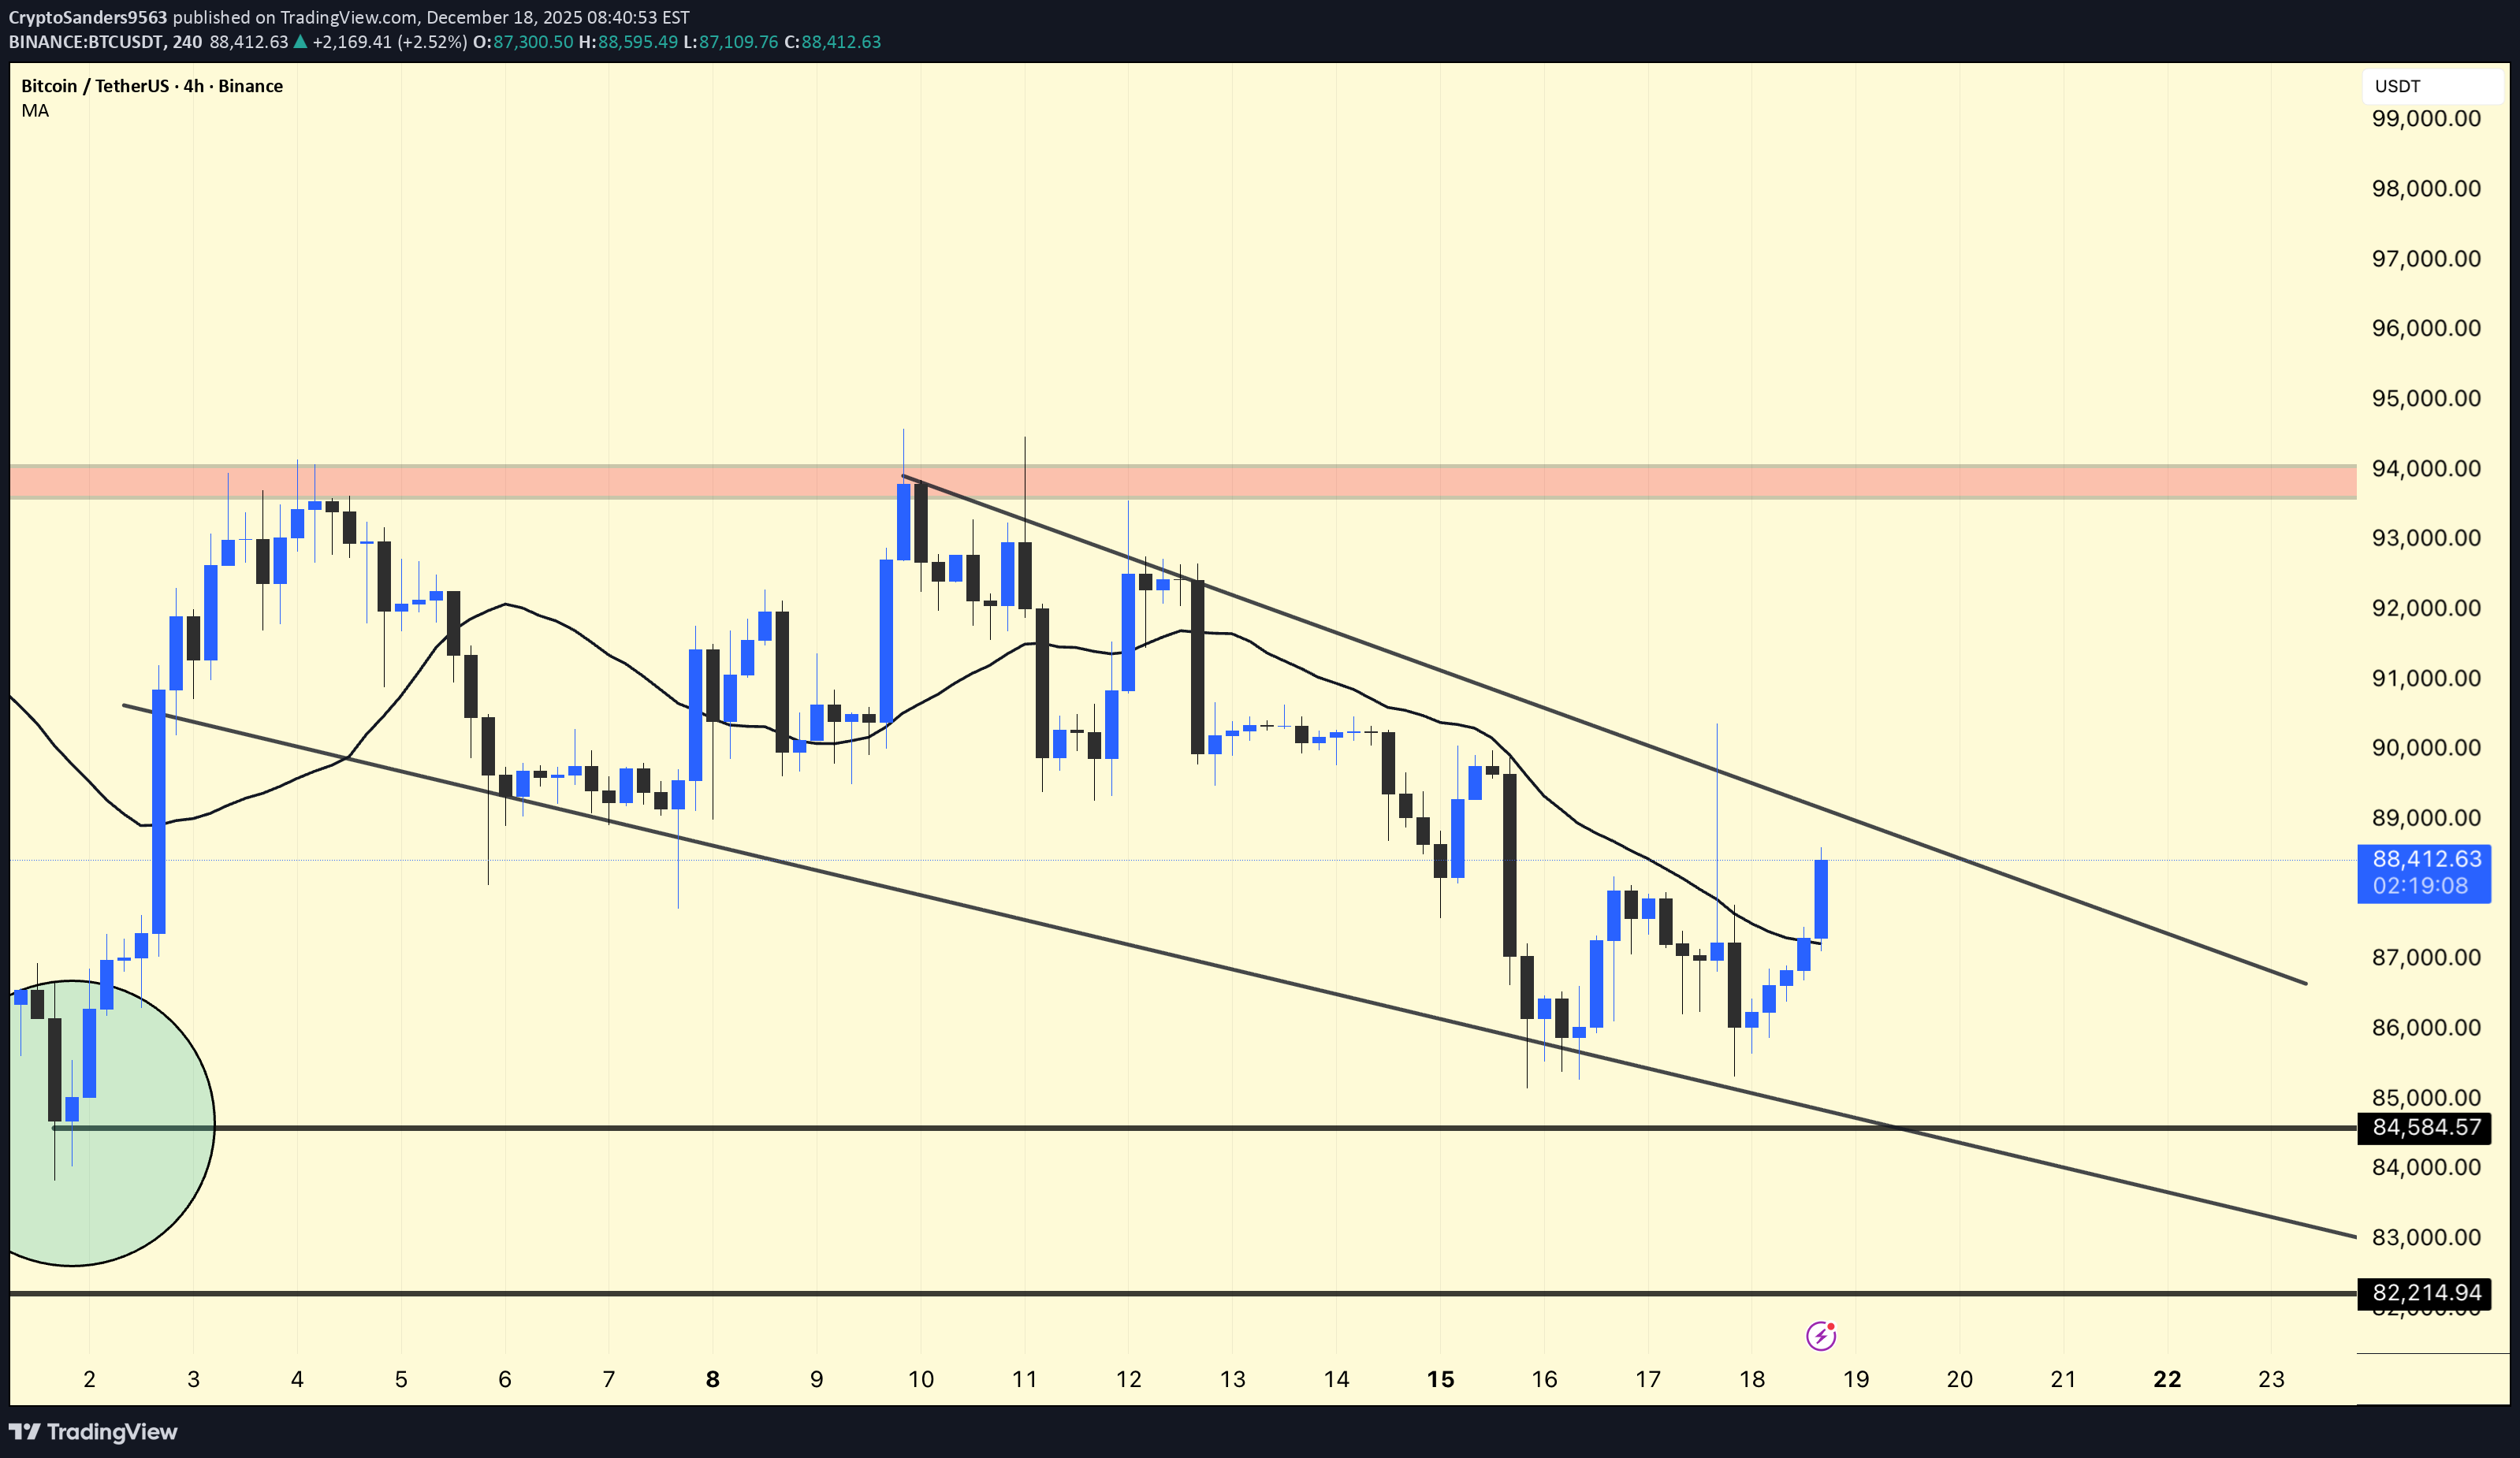
BTC/USDT –Chart Update (4H) Price is bouncing off the lower channel support near 84.5K. Currently trading above the 4H moving average (~87K), indicating short-term strength. The descending trendline resistance remains intact around 91–92K. Support: 87K → 84.5K Resistance: 90K → 92K → 94K (Major) DYOR | NFA.
CryptoSanders9563
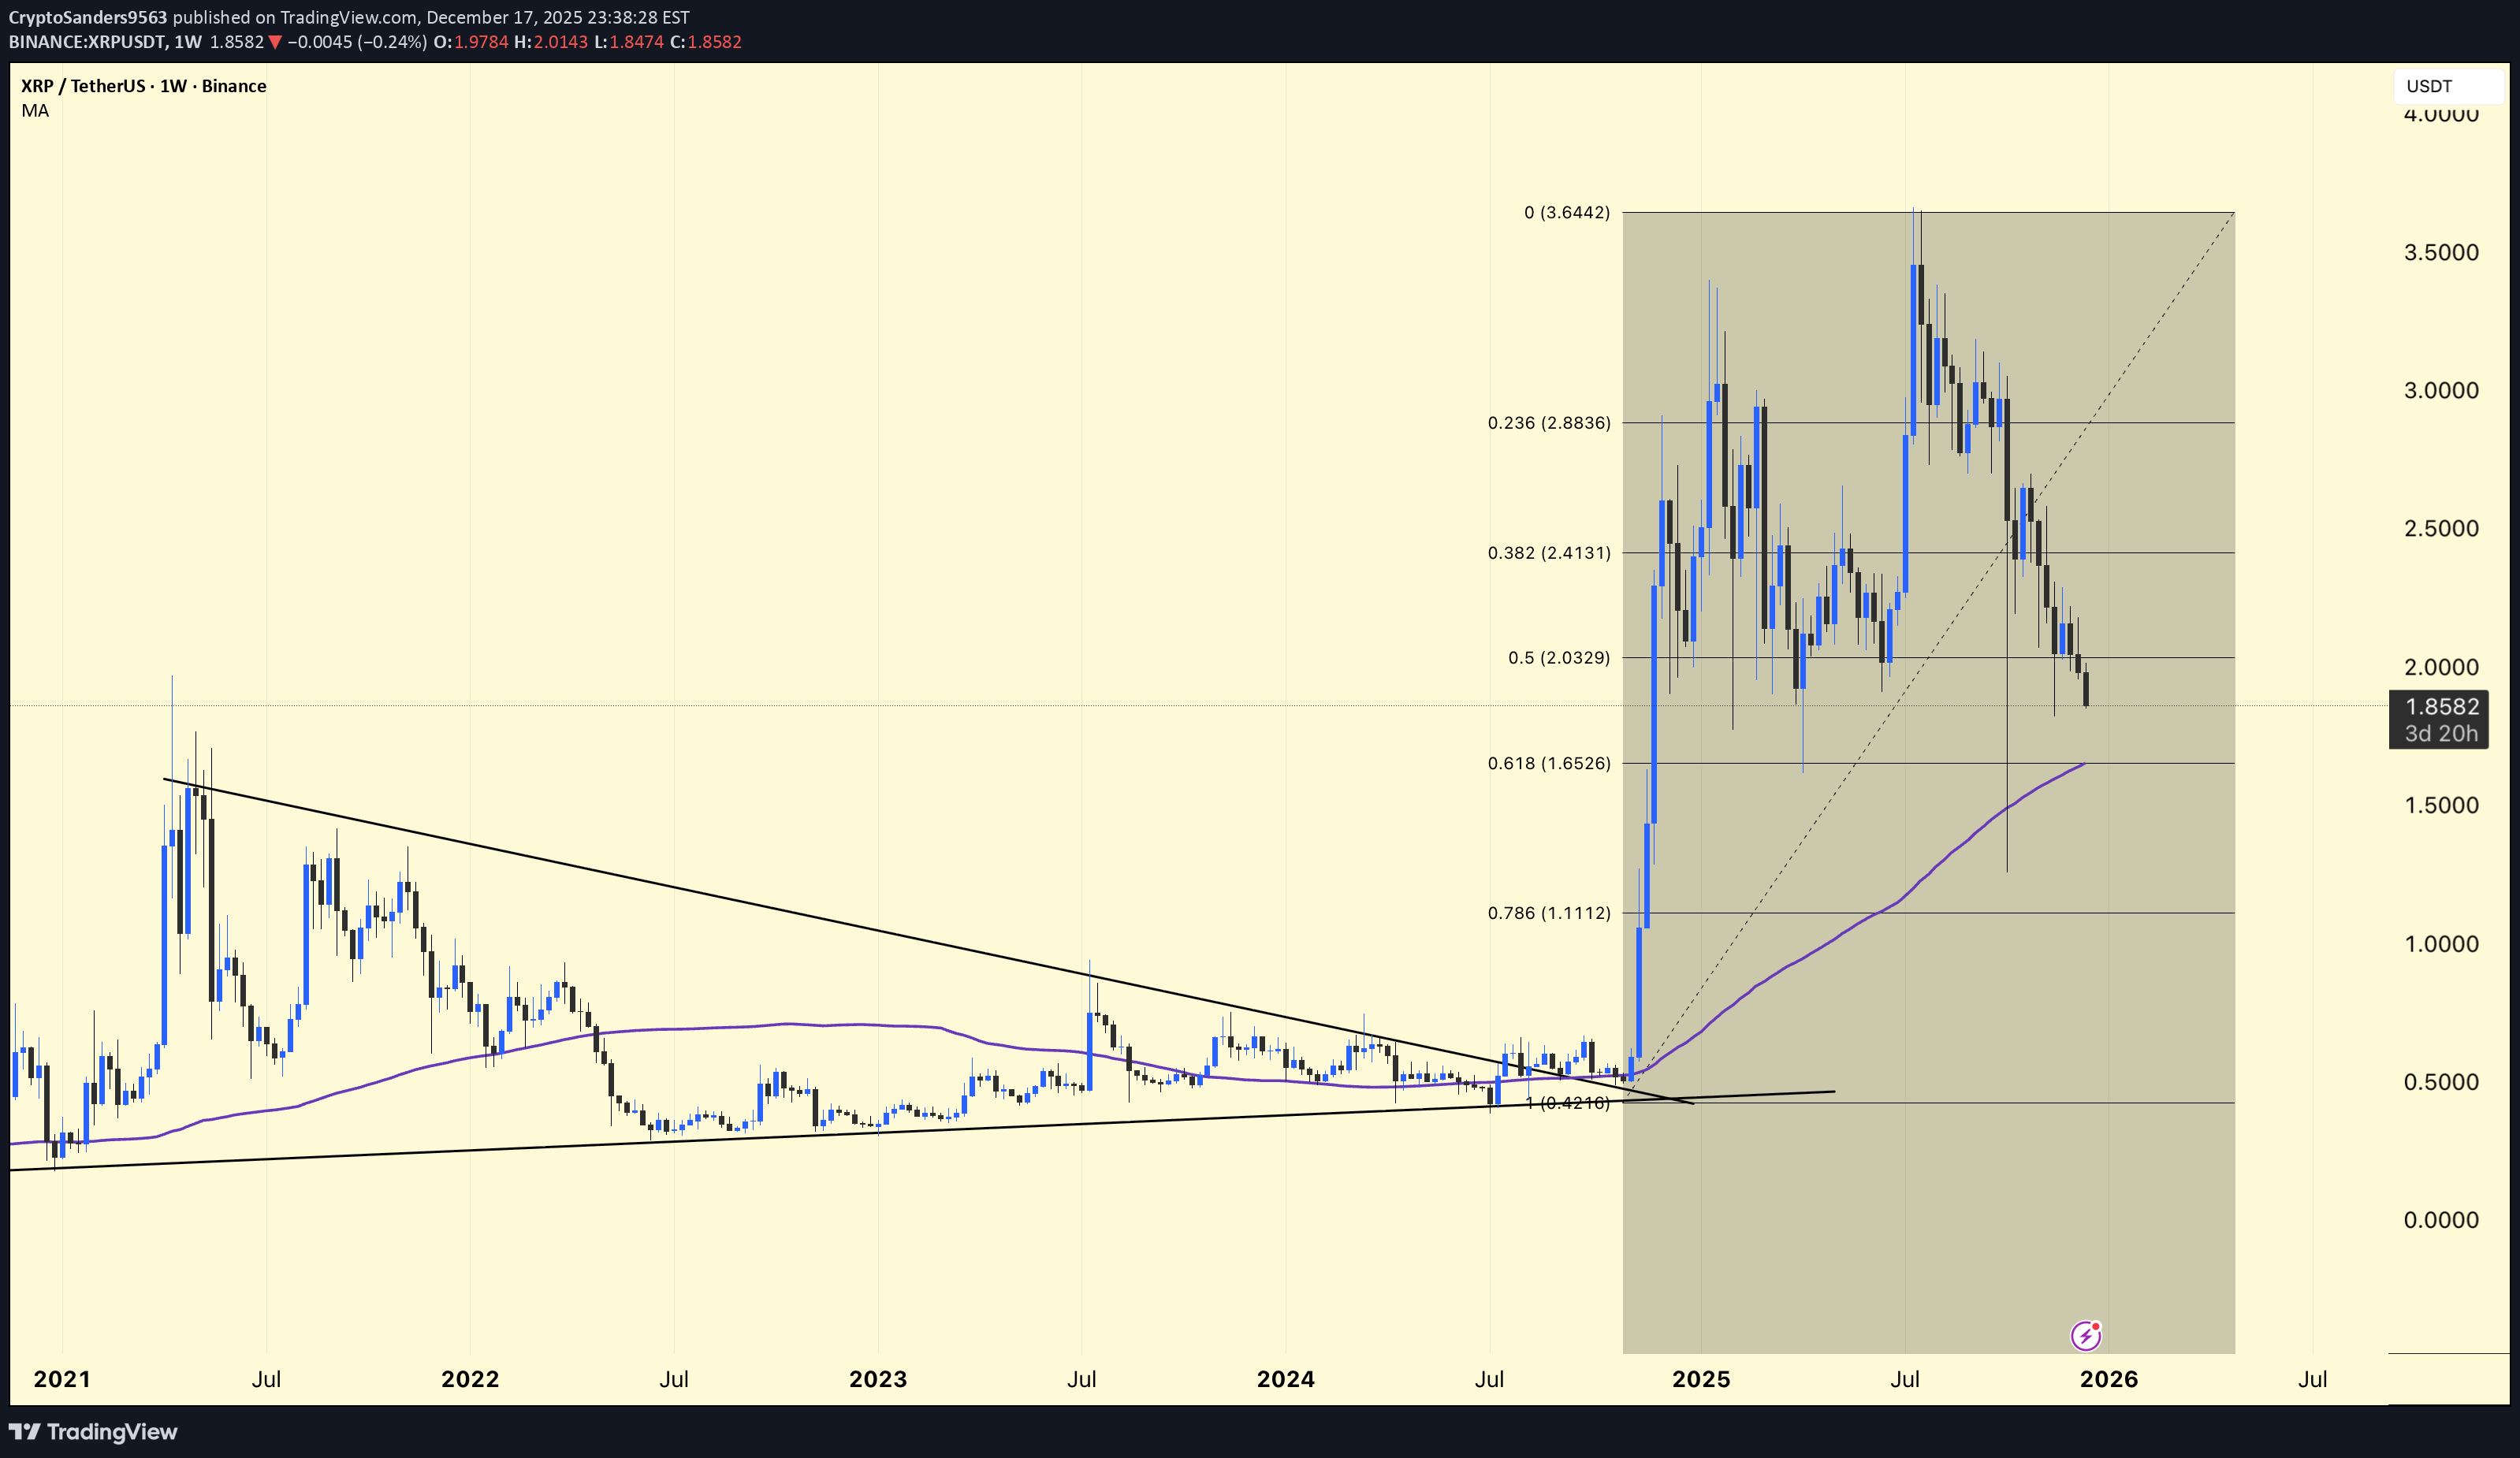
XRP/USDT – Chart Analysis (Weekly) XRP has broken out of a multi-year downtrend line → confirming a major trend reversal Strong impulsive rally after prolonged accumulation The current price action is a healthy corrective pullback, not a bearish reversal As long as the higher support zones hold, the structure remains bullish. Fibonacci Analysis. (Fibonacci drawn from macro low → to recent high) 0.236 – 2.88 → Strong rejection zone (local top) 0.382 – 2.41 → Supply / Resistance 0.5 – 2.03 → Mid-range level 0.618 – 1.65 → Golden Support Zone 0.786 – 1.11 → Strong demand and last bullish defense The price is currently trading between 0.5 and 0.618, close to a high-probability demand zone. Moving Average Confirmation The price is still above the rising weekly MA (~1.65) The MA is acting as dynamic support In a bull cycle, the price often dips below the MA and recovers As long as the weekly closes remain near/above the MA, the bullish trend remains intact. DYOR | NFA.
CryptoSanders9563
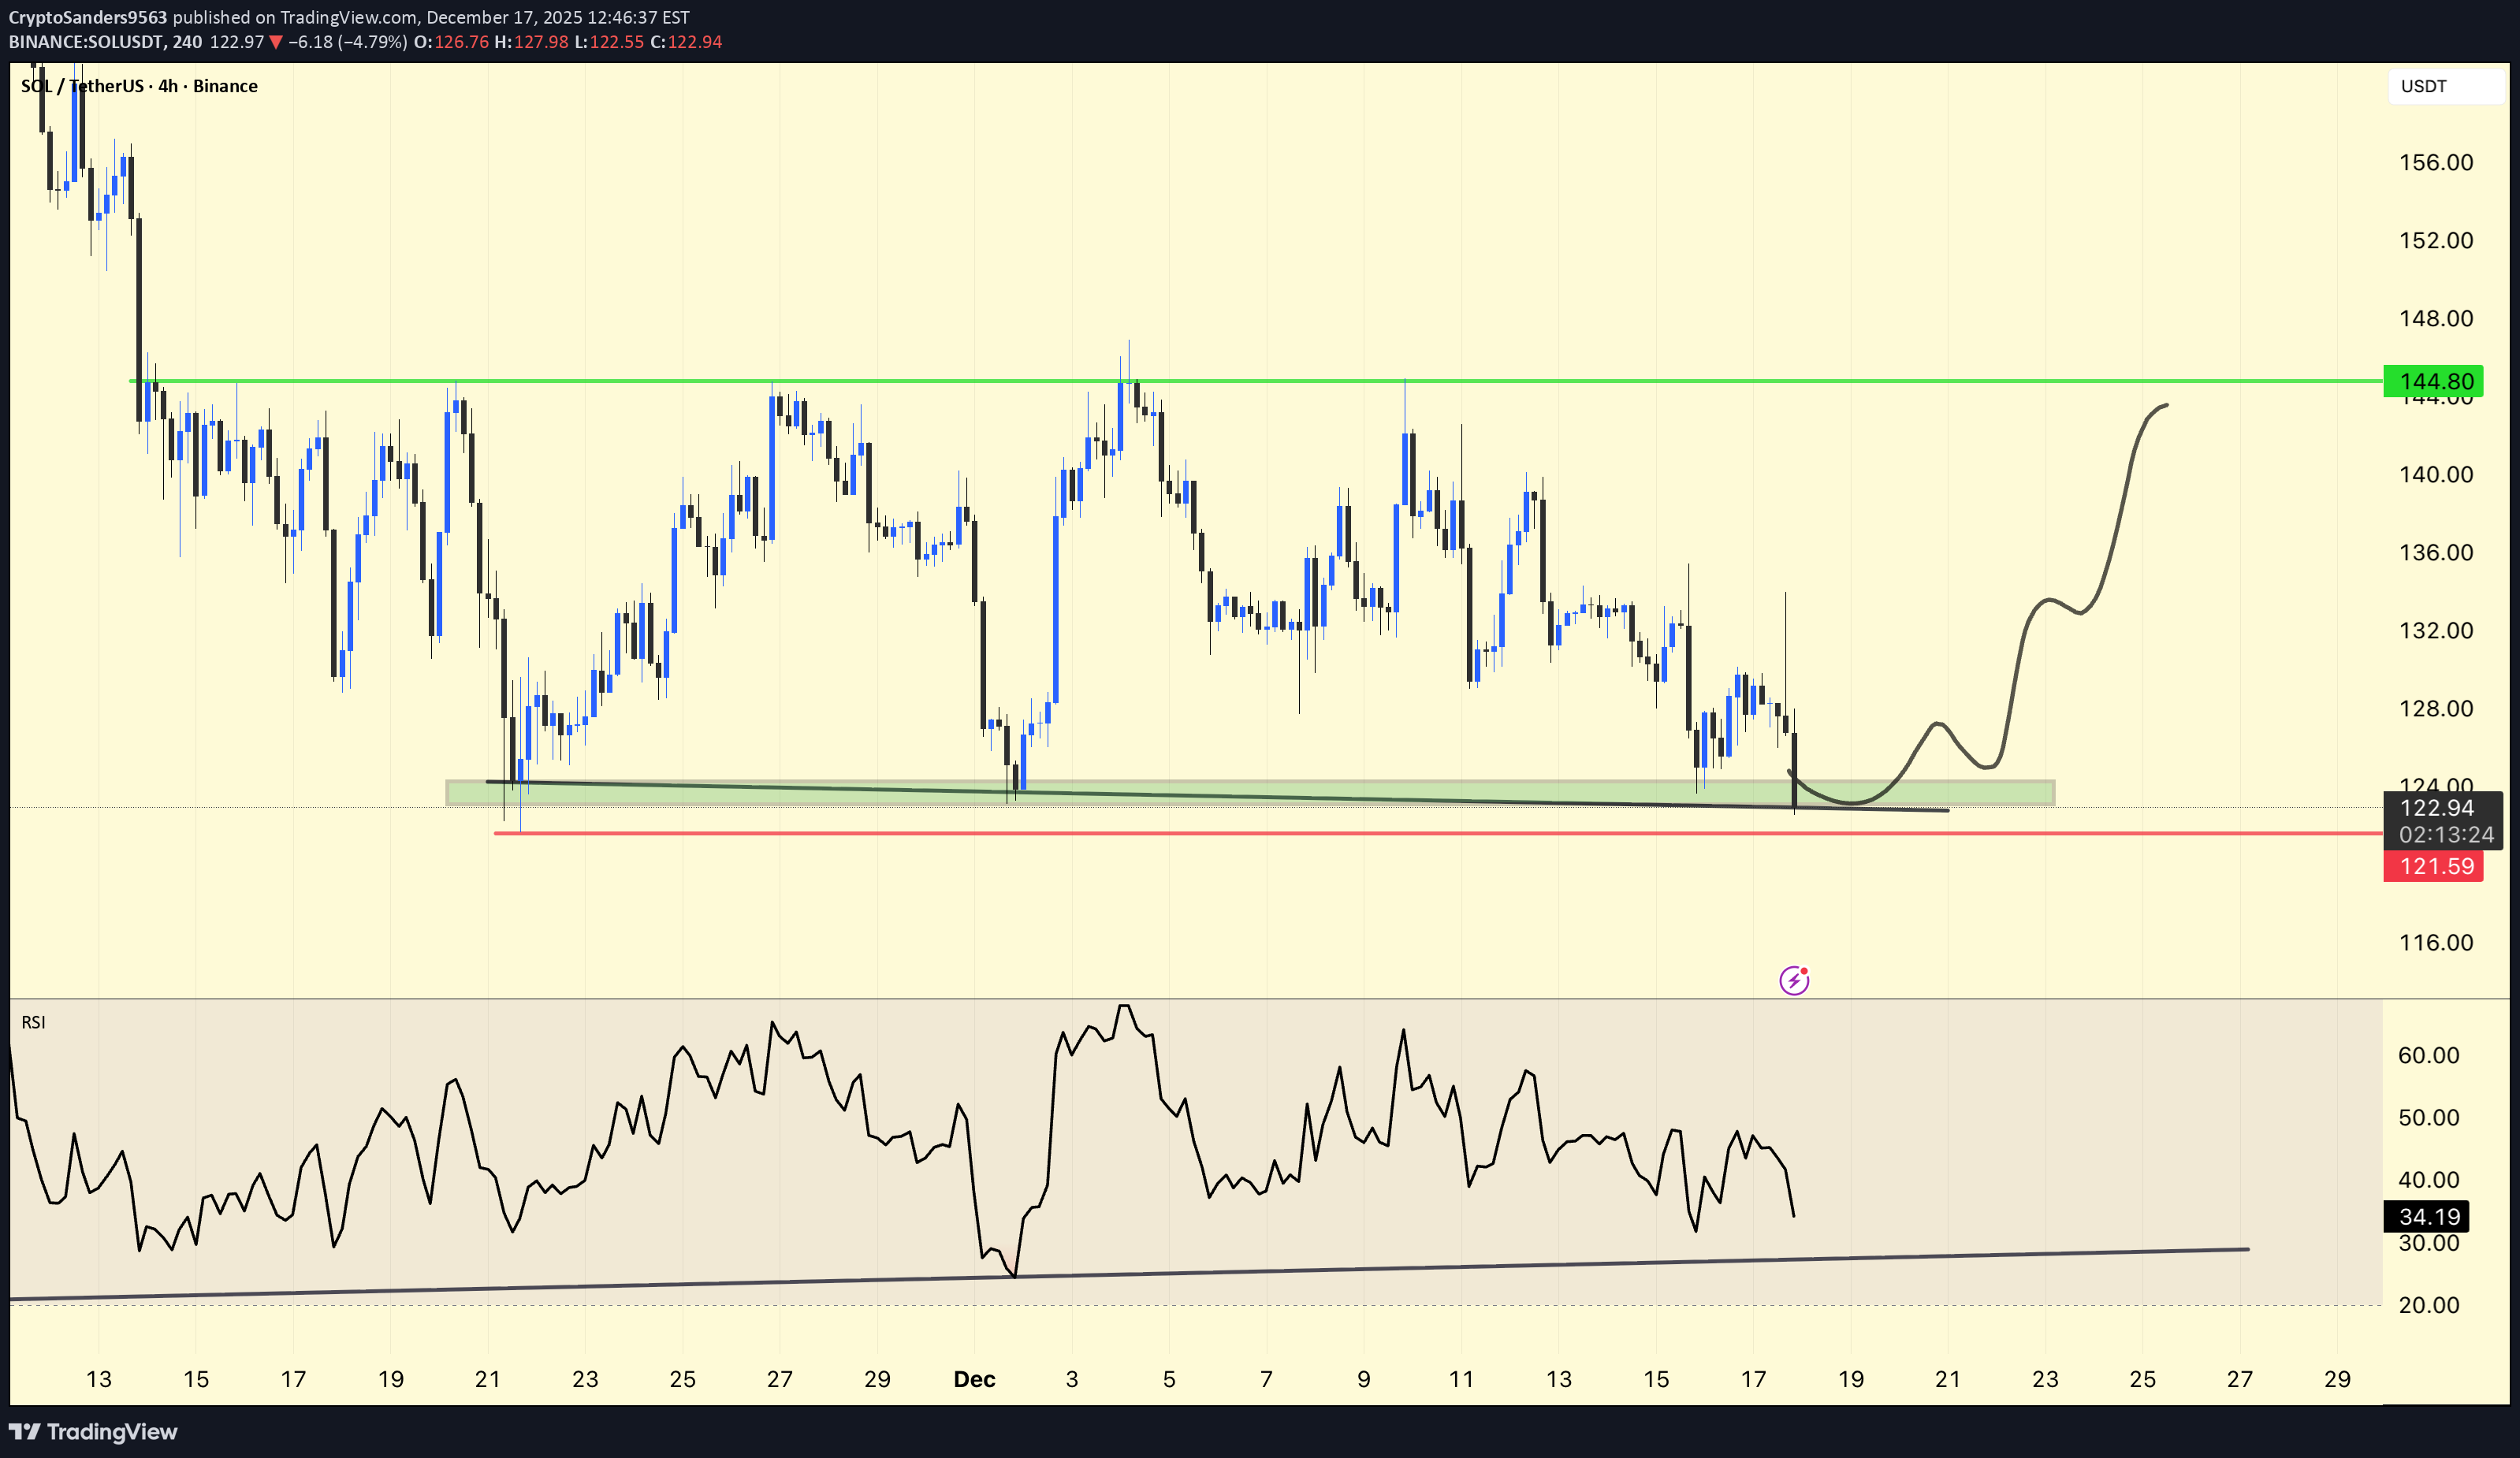
SOLUSDT – Long Trade Setup and Analysis | 4H) SOL is currently trading within a high-probability demand zone (123–121) that has been tested multiple times. Price compression at this base suggests that sellers are exhausted, and an upward reaction is likely. Trade Plan Entry Zone: 123 – 121 Stop-Loss: Below 121 (Daily close preferred) Targets: T1: 132 – 135 T2: 140 – 145 (Major resistance and range high) Technical Analysis Strong Horizontal Support: Multiple reactions confirm that buyers are active. RSI ~35: Near oversold territory → increases the probability of a bounce. Liquidity Sweep: Wick reversal below support indicates a stop-hunt before the reversal. Structure: Downside momentum is slowing; base formation is visible. DYOR | NFA.
CryptoSanders9563
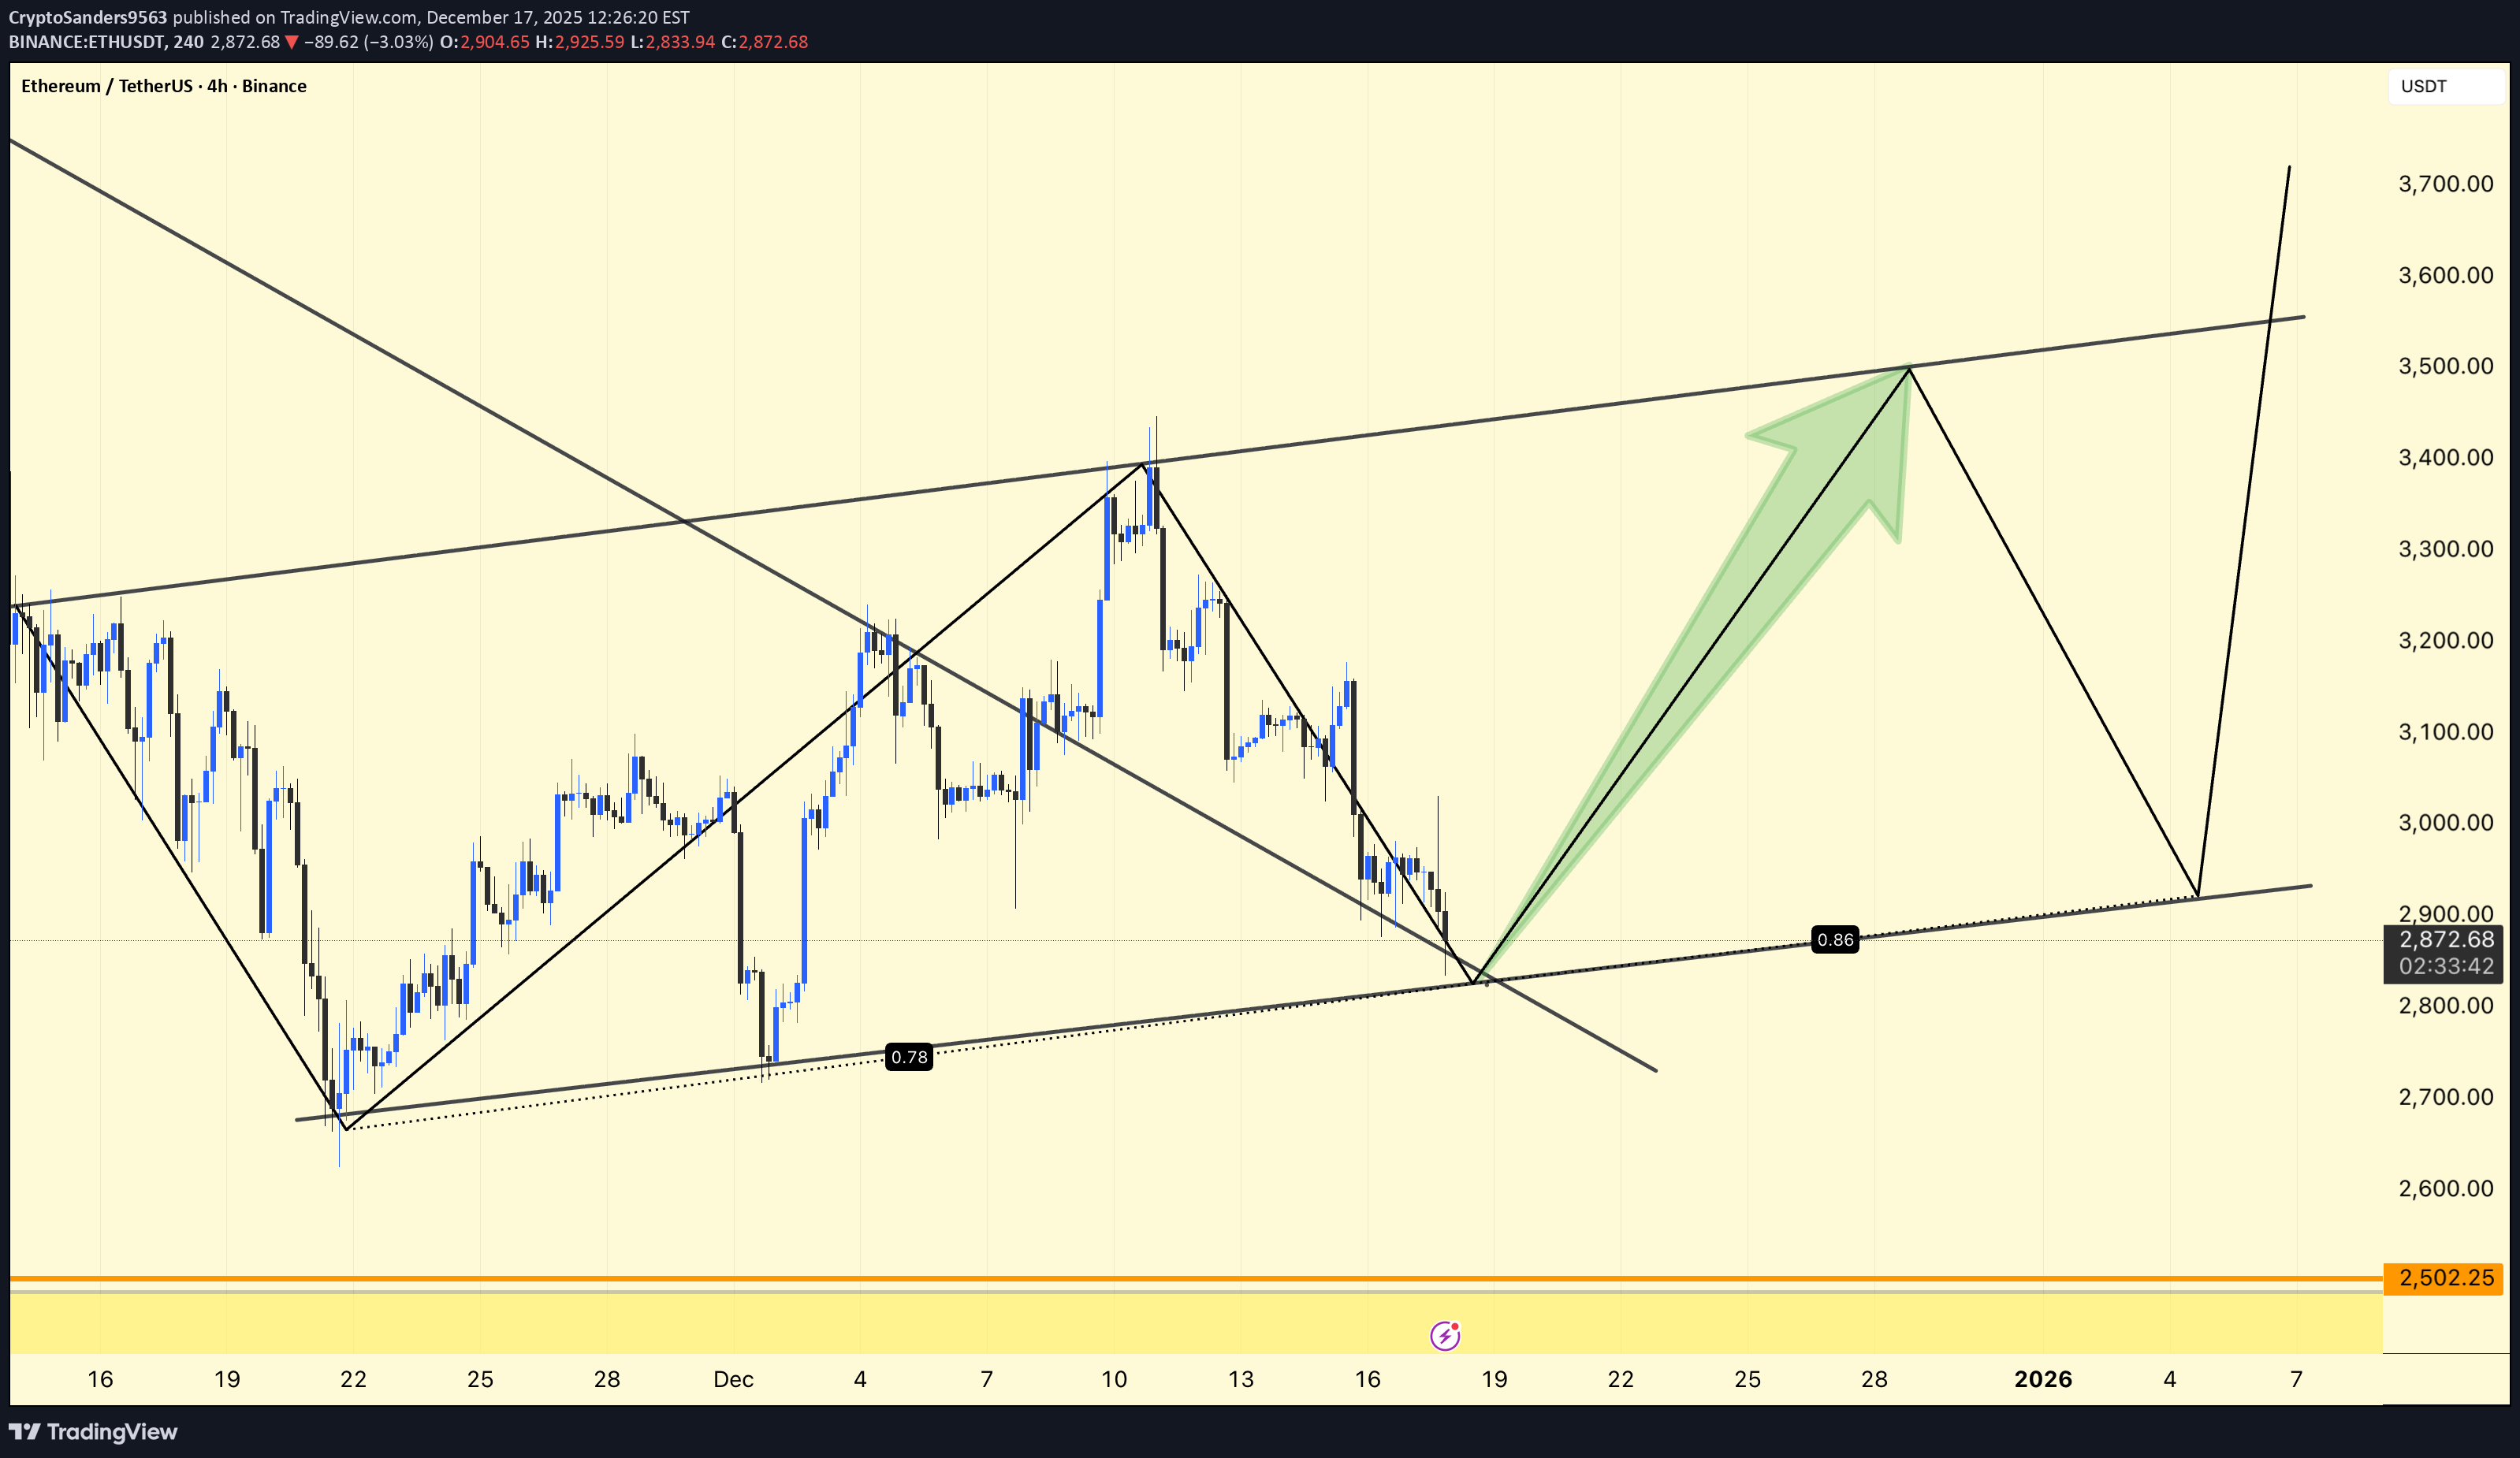
ETHUSDT - Chart Update (4H) ETH has reacted perfectly to the brokerage trendline, forming a potential reversal zone. If support holds in the lower range, a V-shaped recovery is possible. Support: 2.85K–2.9K (Must hold) Upside potential: Break and hold above 3.1K → 3.5K Key Resistance: 3.55K–3.6K Trendline Zone As long as 2.85K holds, the bullish scenario remains valid. A move above this level would confirm further upside. Higher risk, higher reward zone - Awaiting confirmation. DYOR | NFA.
CryptoSanders9563
BTCUSDT – Chart Update (4H) BTC is respecting the rising trendline but facing strong resistance near 87.5K–88K. The current structure suggests a weak bounce, with sellers still active at resistance. Below 87.5K: Risk of pullback towards 85.5K → 84.5K support Above 88K (hold): Trend continuation towards 90K+ For now, this is a make-or-break zone — wait for confirmation before bias. DYOR | NFA.
CryptoSanders9563
ETHUSDT – Small Update ETH is squeezing near the trendline support. A breakout above 3.0–3.1K can trigger a bullish move, while a breakdown may push the price toward 2.5K. DYOR | NFA.
CryptoSanders9563
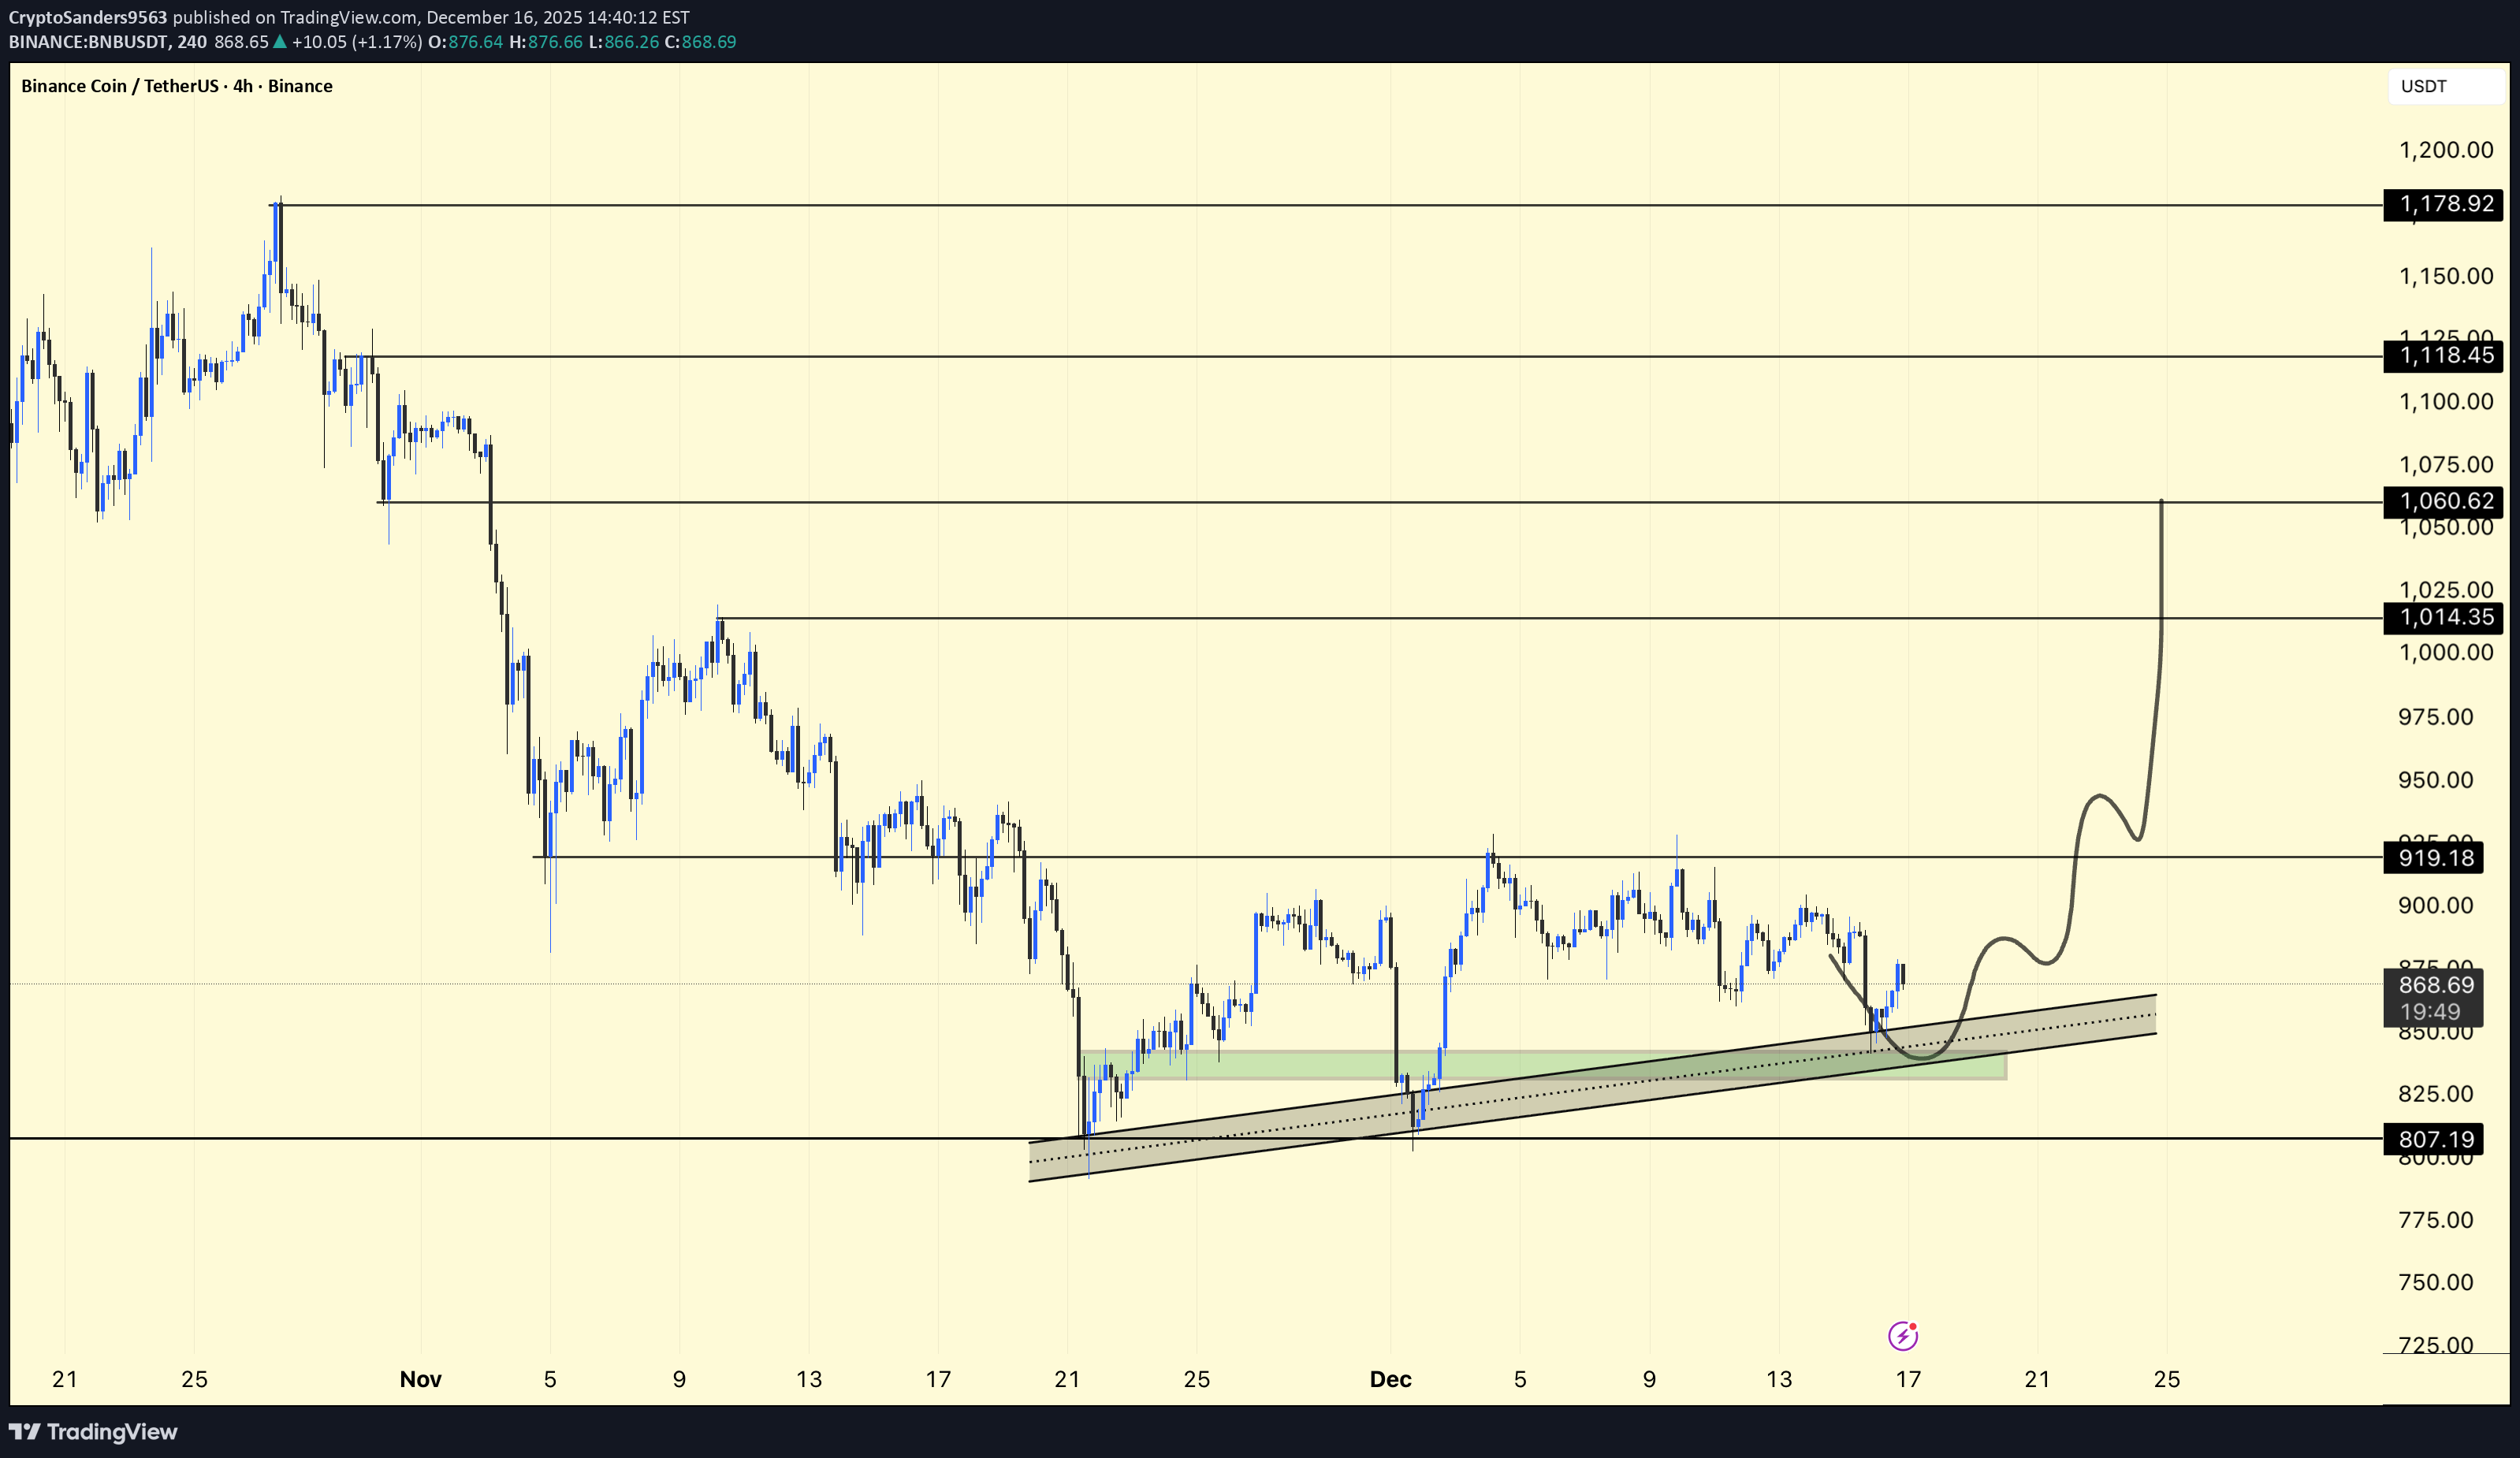
BNB is holding above the rising support zone. As long as price stays above $850–860, upside toward $920 → $1,000+ remains possible; a break below support may lead to a deeper pullback. DYOR | NFA.
CryptoSanders9563
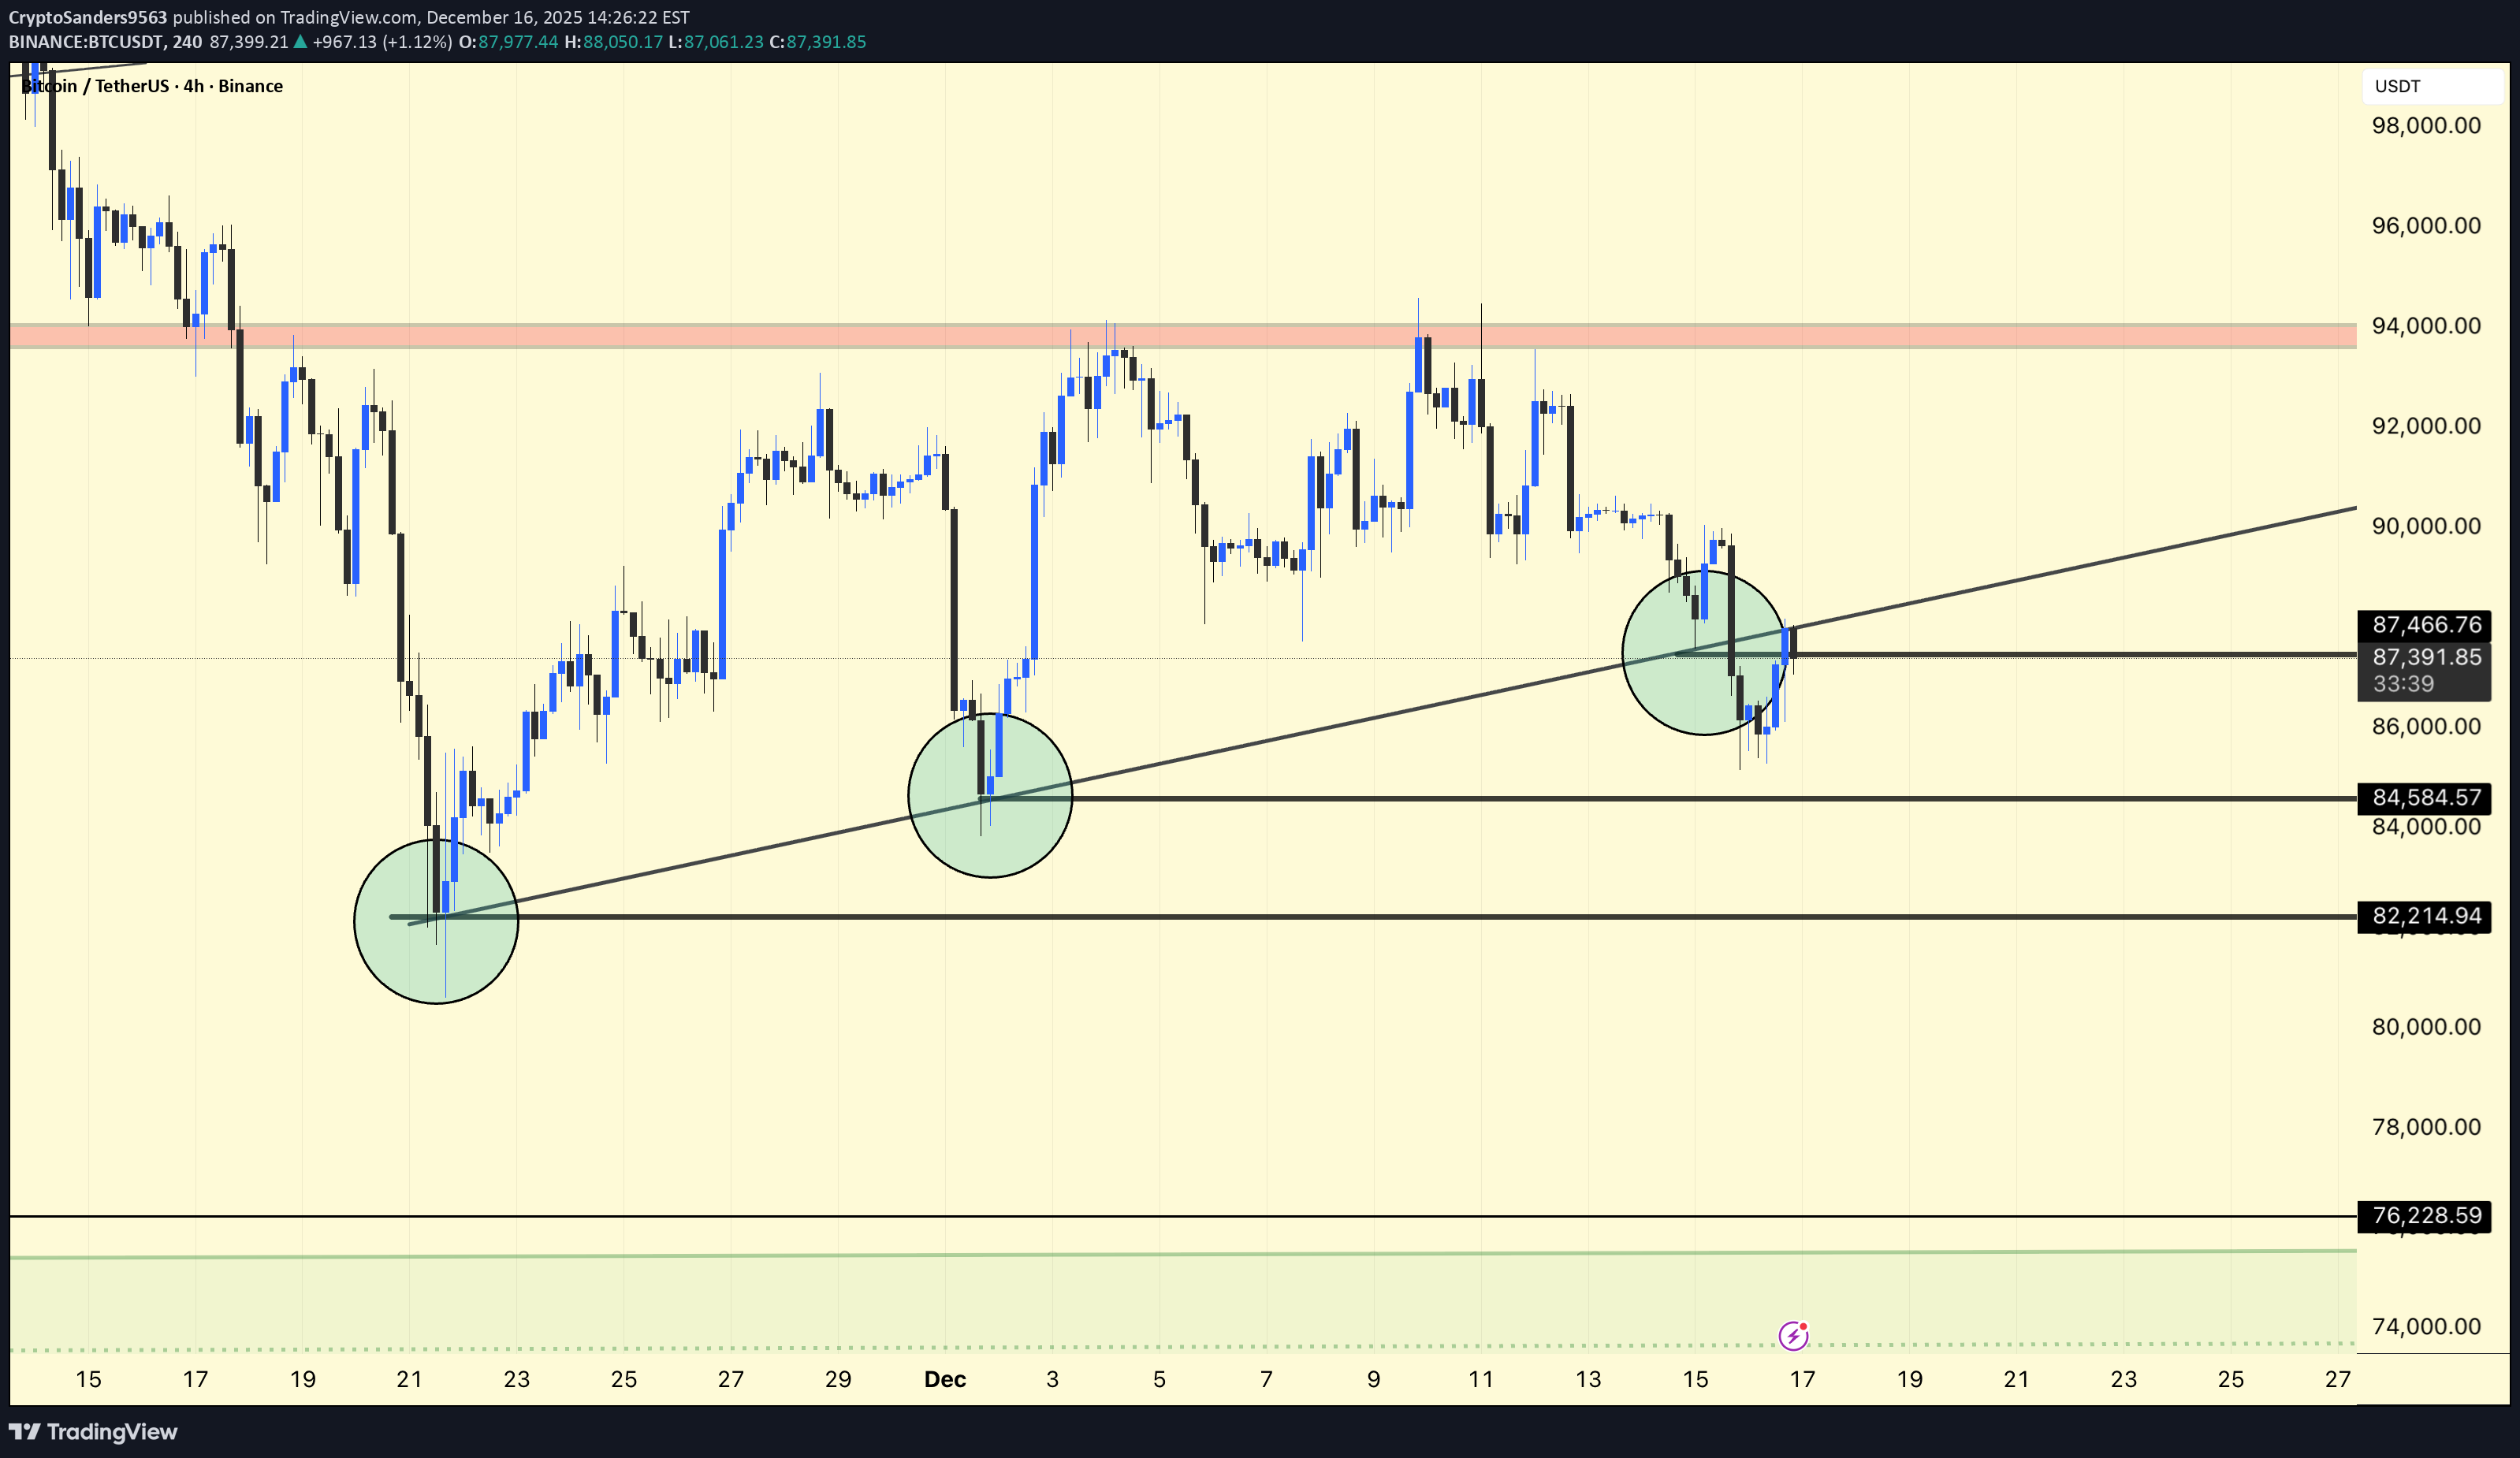
Price is reacting at the rising trendline support. Holding above 84.5K keeps the bullish structure intact; a breakdown may bring further downside. DYOR | NFA.
Disclaimer
Any content and materials included in Finbeet's website and official communication channels are a compilation of personal opinions and analyses and are not binding. They do not constitute any recommendation for buying, selling, entering or exiting the stock market and cryptocurrency market. Also, all news and analyses included in the website and channels are merely republished information from official and unofficial domestic and foreign sources, and it is obvious that users of the said content are responsible for following up and ensuring the authenticity and accuracy of the materials. Therefore, while disclaiming responsibility, it is declared that the responsibility for any decision-making, action, and potential profit and loss in the capital market and cryptocurrency market lies with the trader.