
DAY11
@t_DAY11

What symbols does the trader recommend buying?
Purchase History
Trader Messages
Filter
Message Type
DAY11
SOL : iF BREAK OUT DOWNSIDE ?
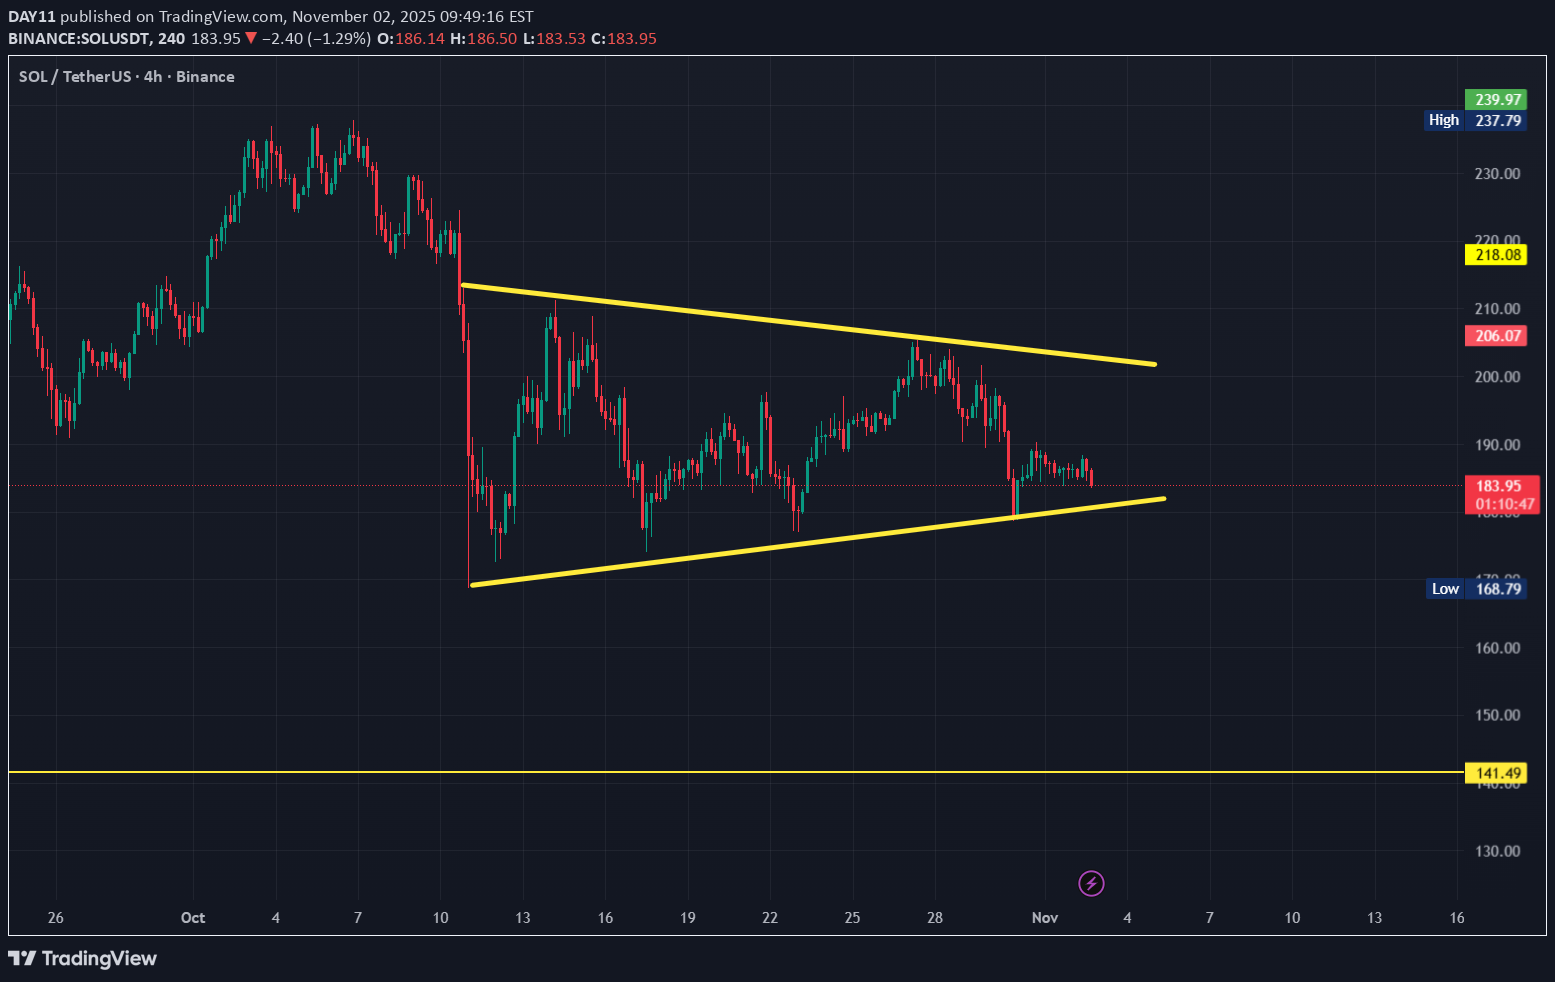
#sol SOL IF sol break out down side , I would like to an open short position from here , Short - $180 Stop Loss- $190 Take Profit - $141
DAY11
ETH: TRADE SET UP - SHORT
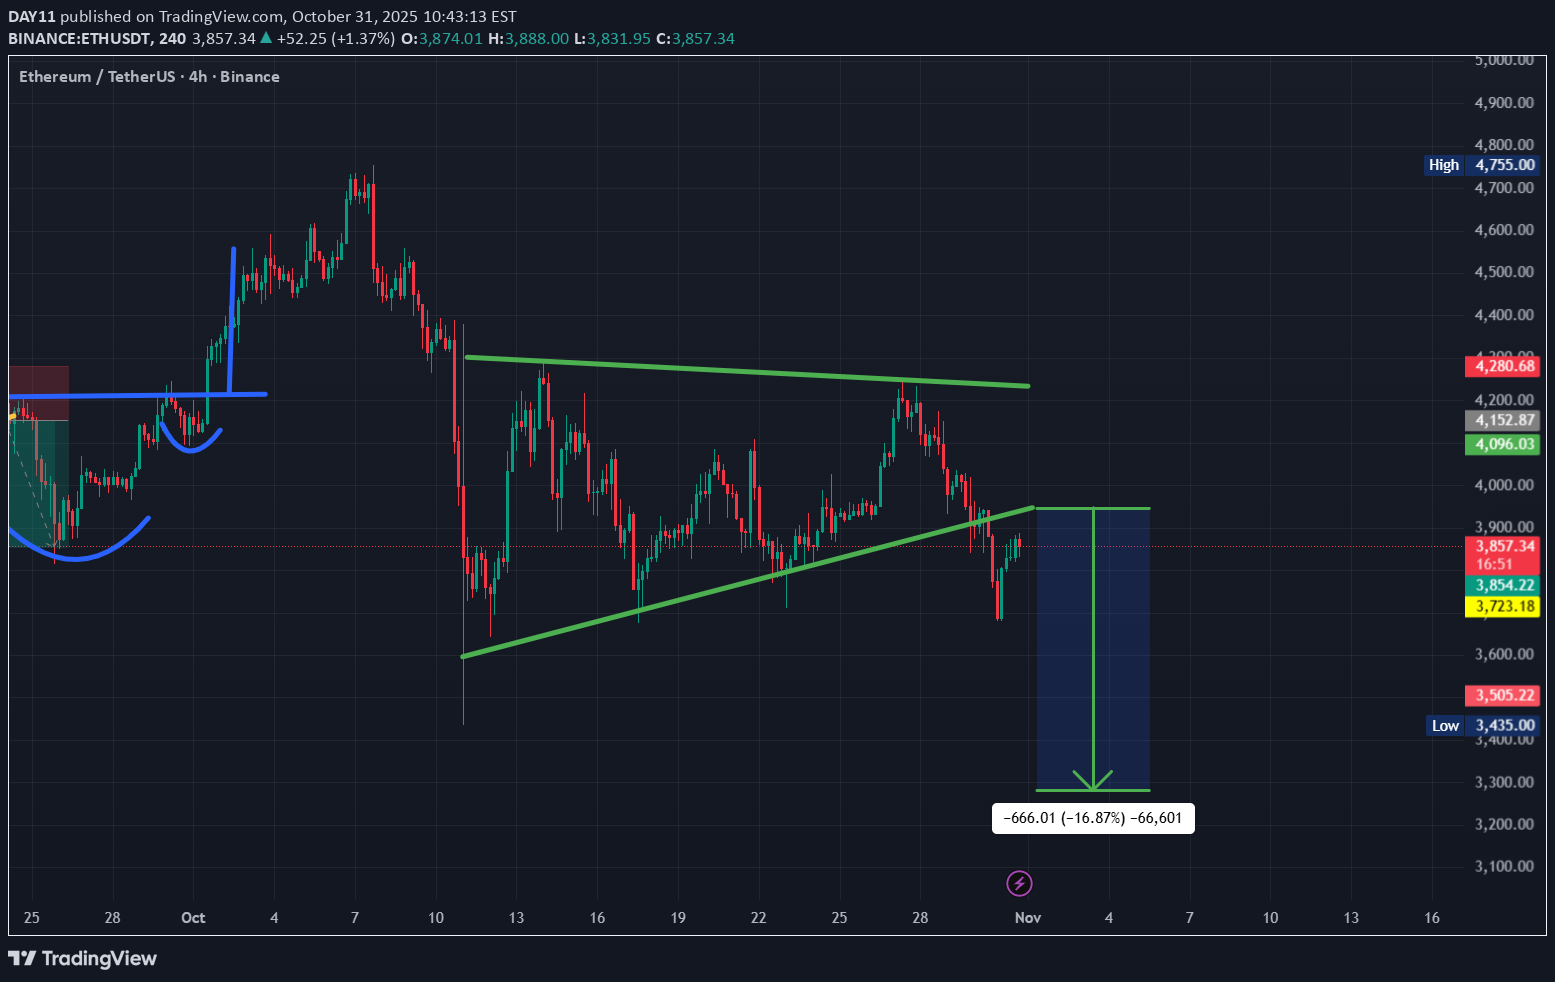
#eth ETH Trade setup - 4h time frame Short- $3900 Stop Loss- $4100 Take Profit - $3300
DAY11
SOL: BROKE OUT AND RECEIVED SUCCESSFUL CONFIRMATION
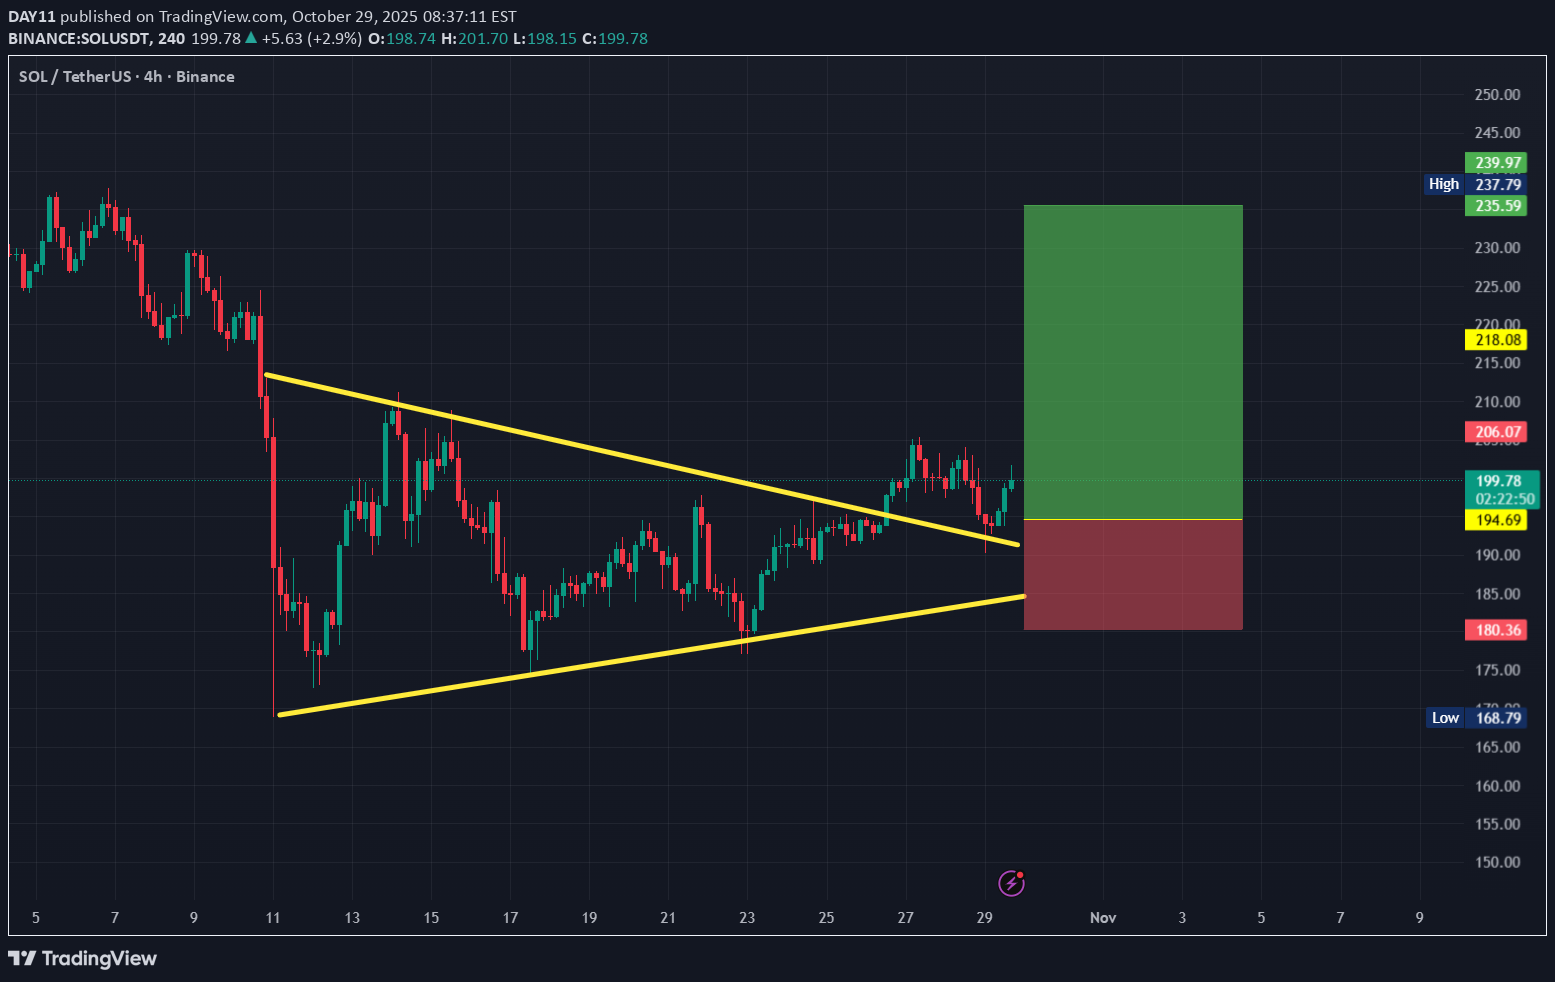
#sol SOL Lets have an opportunity, we have 4h chart and as mentioned in the title broke and confirmed . Long- $194 to $200 Stop Loss- $180 Take Profit- $235 Do Your Own research before Long Or short , Use small lev.
DAY11
SAND: SYMETRICAL TRIANGLE - TRADE SET UP
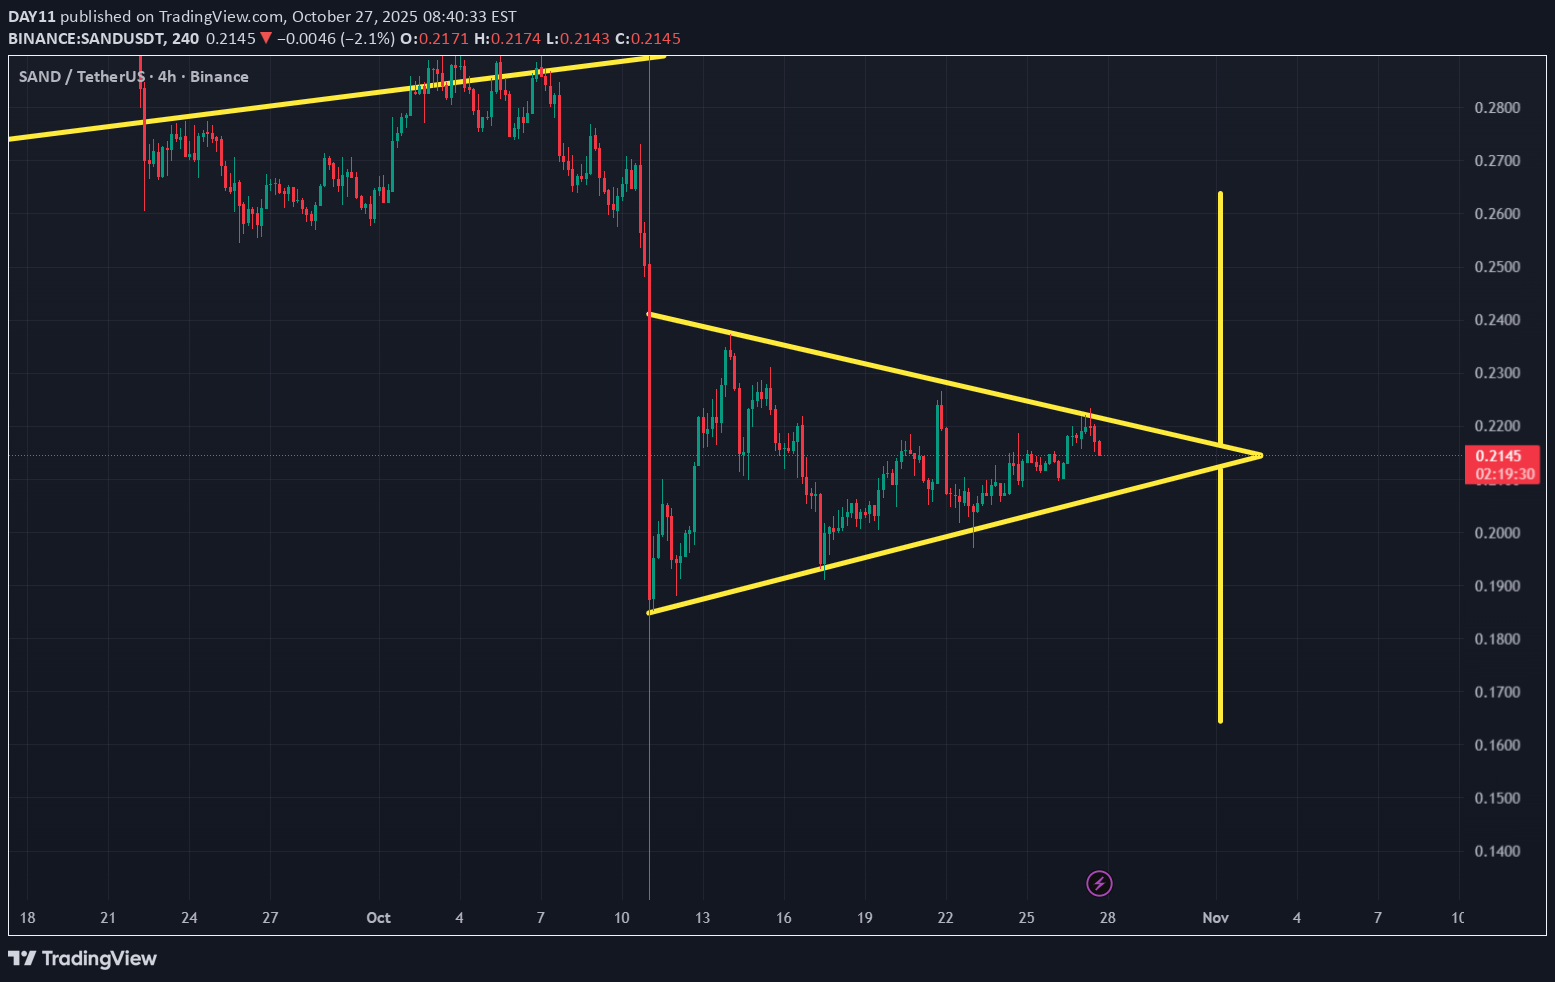
SAND Trade Set Up - 1.Wait for a Breakout and Confirmation: Do not make any trading decisions until the price closes decisively outside of the triangle. Increased Volume: A valid breakout or breakdown is usually accompanied by an increase in trading volume, confirming the price movement. Price Target: The potential price target for the move can be estimated by measuring the height of the triangle. Stop-Loss: Put a stop-loss Long- Belove the line (support) or Short-Above the line (Resistance) depend on break out . Do Your Own Research before taking any action. Updates will soon....until don't forget to follow
DAY11
BITCOIN : DOES FORMING DOUBBLE BOTTOM?

#btc BTC Lets talk about bitcoin , Here 4h time frame chart . Currently BTC is trading above the support at $106747. Above given time frame BTC is forming double bottom , its not complete yet , Once a complete this pattern and get confirmation its great an opportunity to open long position from the neckline ($13700 ) . Trade set up Risky trade - Long - $110k Stop Loss- $106k Take Profit1- $112k Take Profit 2-$115k Take Profit 3-$112k Do Your Own Research before diving into. Not a financial advice.Take Profit3- $121k Type mistake
DAY11
ETH: BREAK OUT ANY TIME NOW !

#eth ETH is forming symmetrical triangle pattern in the 4h time frame . Lets go straight into chart , Lower highs are connecting a line , which is resistance and Higher Lows are connecting a line , which is support , As the two trendlines move closer, they are forming a triangular shape, indicating breakout either up or down side . This is consolidation period . Trade Set Up- LONG- $4065 Stop Loss- $3800 Take Profit- $4733 Do Your Own Research before diving into , Not a Financial Advise . Wait a while for break out and its Confirmation to the confirmed entry .
DAY11
XAU: DROPPING - DOUBBLE TOP BROKE OUT

#XAU XAU In the 1h time frame XAU made double top , which is broke out , confirmation is pending, Don't entry until the don't get confirmation . Short- $4200 Stop Loss- $4277 Take Profit - $4047
DAY11
NEAR: BROADNING WEDGE PATTERN

#near NEAR NEAR is forming broadening wedge pattern in the 4h time frame . You may call Symmetric broadening wedge pattern. A broadening wedge pattern is a range where the price is holding between two trend lines that are moving a broad way . Broadening wedges can be either bullish or bearish depending on how they form within an existing trend. The trendline gives a clue in the pattern itself that suggest whether the market is likely to continue the same trend or reverse. The upper line is resistance and the lower line is support. The price makes higher highs at the top and lower lows at the bottom. This pattern not break out yet , Keep a eye on break out . Don't take entry until the break out and confirmation not happens . Do Your Own Research before Diving , Not a Financial Advice .
DAY11
LTC: BROKE OUT SYMETRICA TRIANGLE

#LTC LTC Lets go straight into chart , This is 4h chart . LTC made symmetrical triangle pattern in the given time frame and broke out towards the downside . Short - $94 Stop Loss- $98 Take Profit - $84
DAY11
GRASS: LONG TERM TRADE SET UP

$grass Grass is forming symmetrical triangle pattern in the daily chart . Long- $0.53 Stop Loss- $0.1477 Take Profit 1- $1.5 Take Profit 2- $2.51 Take Profit 3- $3.47 Take profit 4- $4.77
Disclaimer
Any content and materials included in Finbeet's website and official communication channels are a compilation of personal opinions and analyses and are not binding. They do not constitute any recommendation for buying, selling, entering or exiting the stock market and cryptocurrency market. Also, all news and analyses included in the website and channels are merely republished information from official and unofficial domestic and foreign sources, and it is obvious that users of the said content are responsible for following up and ensuring the authenticity and accuracy of the materials. Therefore, while disclaiming responsibility, it is declared that the responsibility for any decision-making, action, and potential profit and loss in the capital market and cryptocurrency market lies with the trader.