
MMBTtrader
@t_MMBTtrader

What symbols does the trader recommend buying?
Purchase History
Trader Messages
Filter
Message Type
MMBTtrader
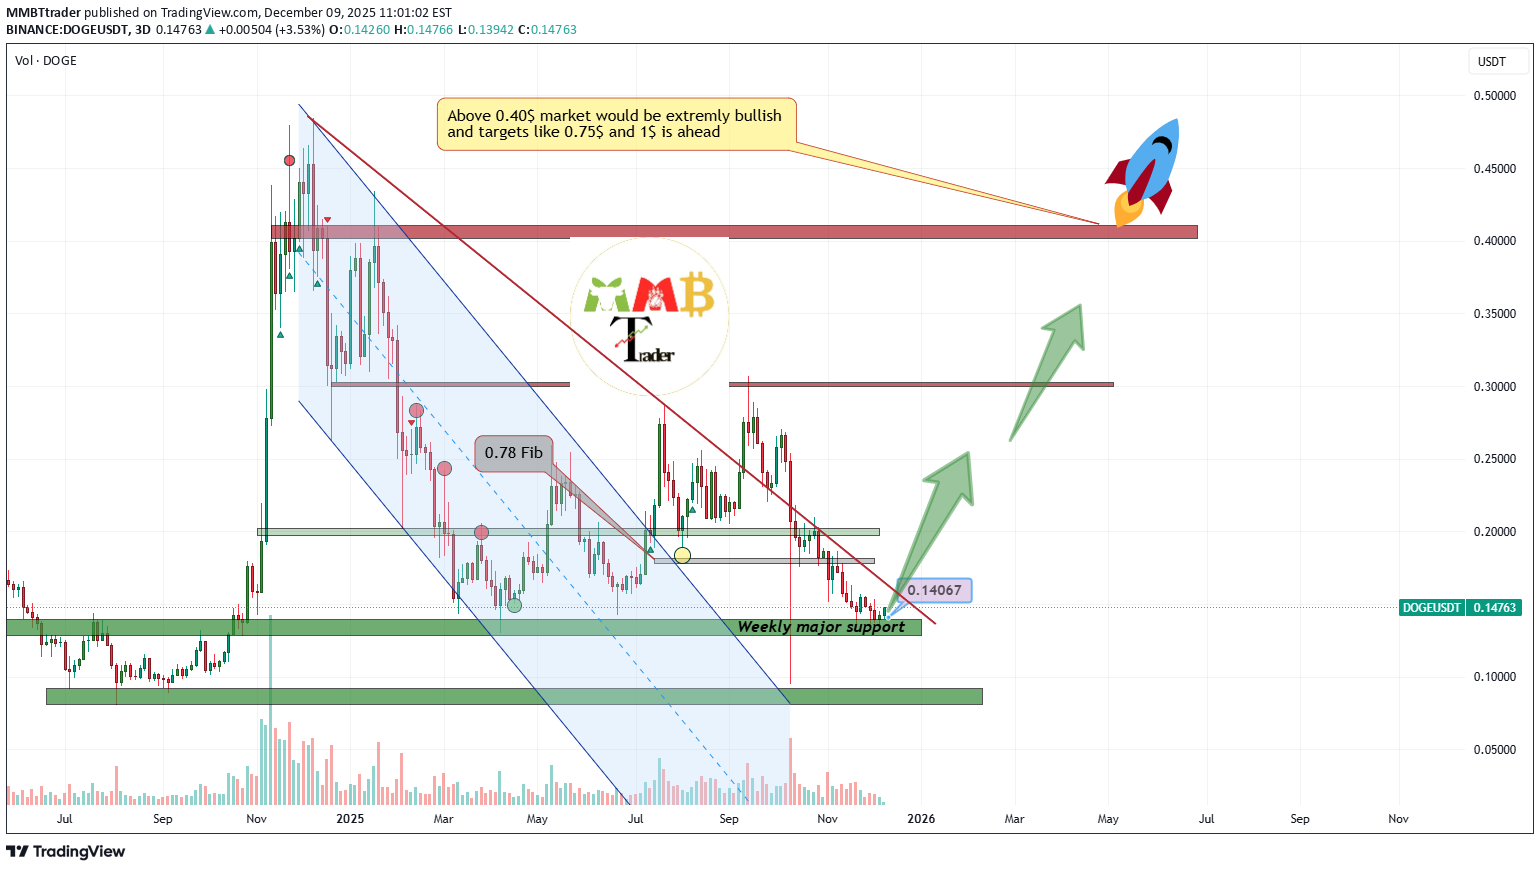
DOGE is currently consolidating within a defined range near the major support zone of $0.08 to $0.12. This range-bound action suggests a period of accumulation, and a breakout above the descending trendline—particularly with a decisive move past the $0.15 resistance—would signal the likely resumption of bullish momentum.
In such a scenario, measured upward projections point toward initial targets near $0.22, followed by a secondary objective around $0.29, contingent upon sustained buying pressure and volume confirmation following the breakout.
DISCLAIMER: ((trade based on your own decision))
<
MMBTtrader
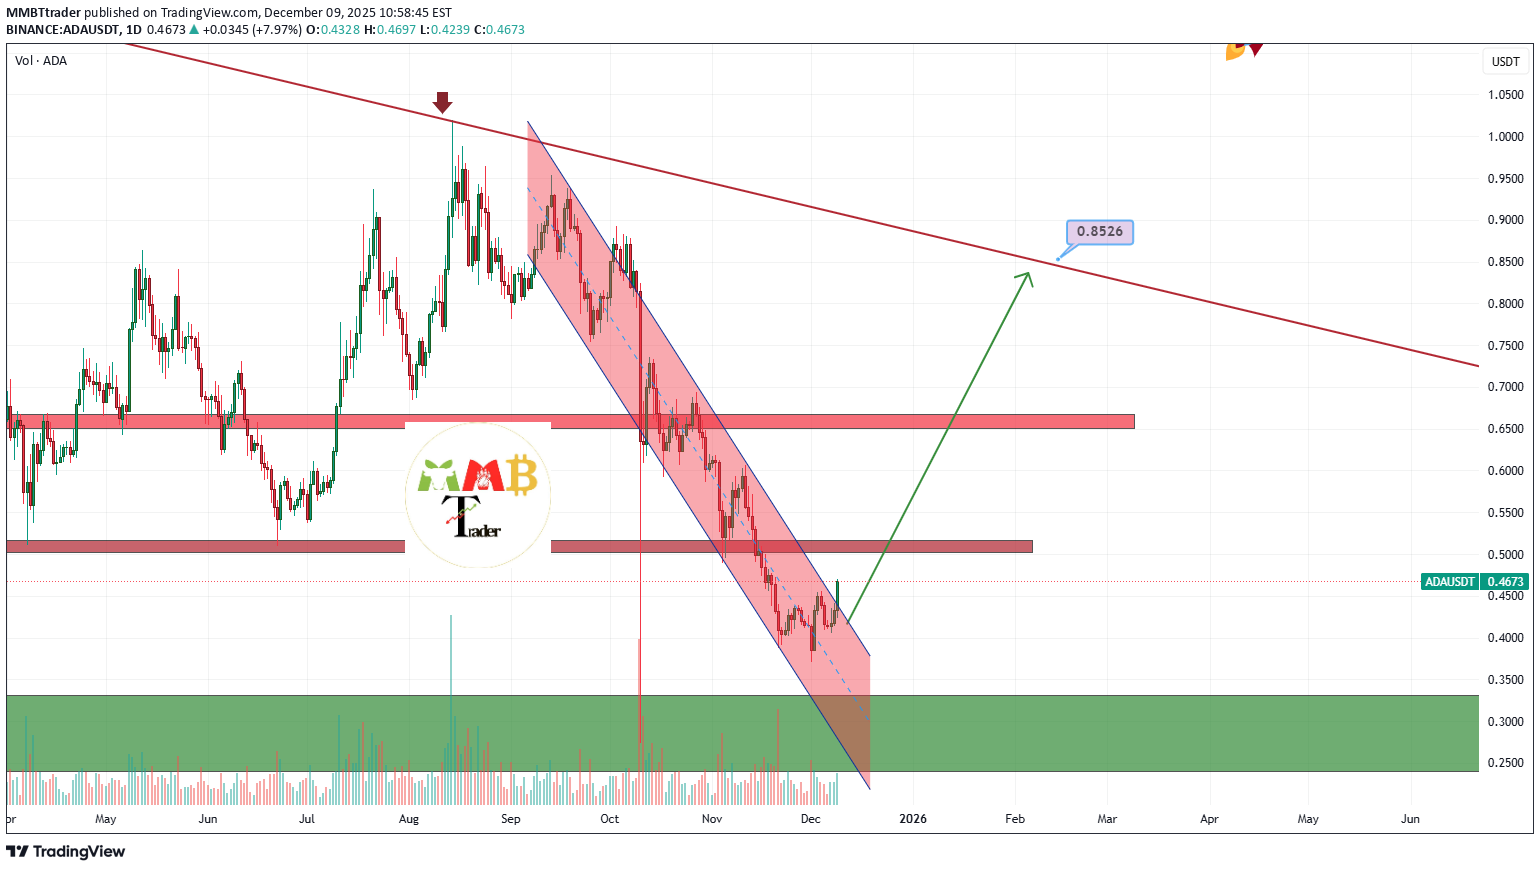
As observed on the chart, ADA has executed a decisive breakout above a major resistance zone, confirmed by a strong bullish candle accompanied by significantly high trading volume. This combination of price action and volume indicates substantial buying pressure and validates the breakout's strength. Consequently, the technical structure now supports a continuation of the upward momentum, with the next primary target projected at the $0.60 level.
DISCLAIMER: ((trade based on your own decision))
<
MMBTtrader
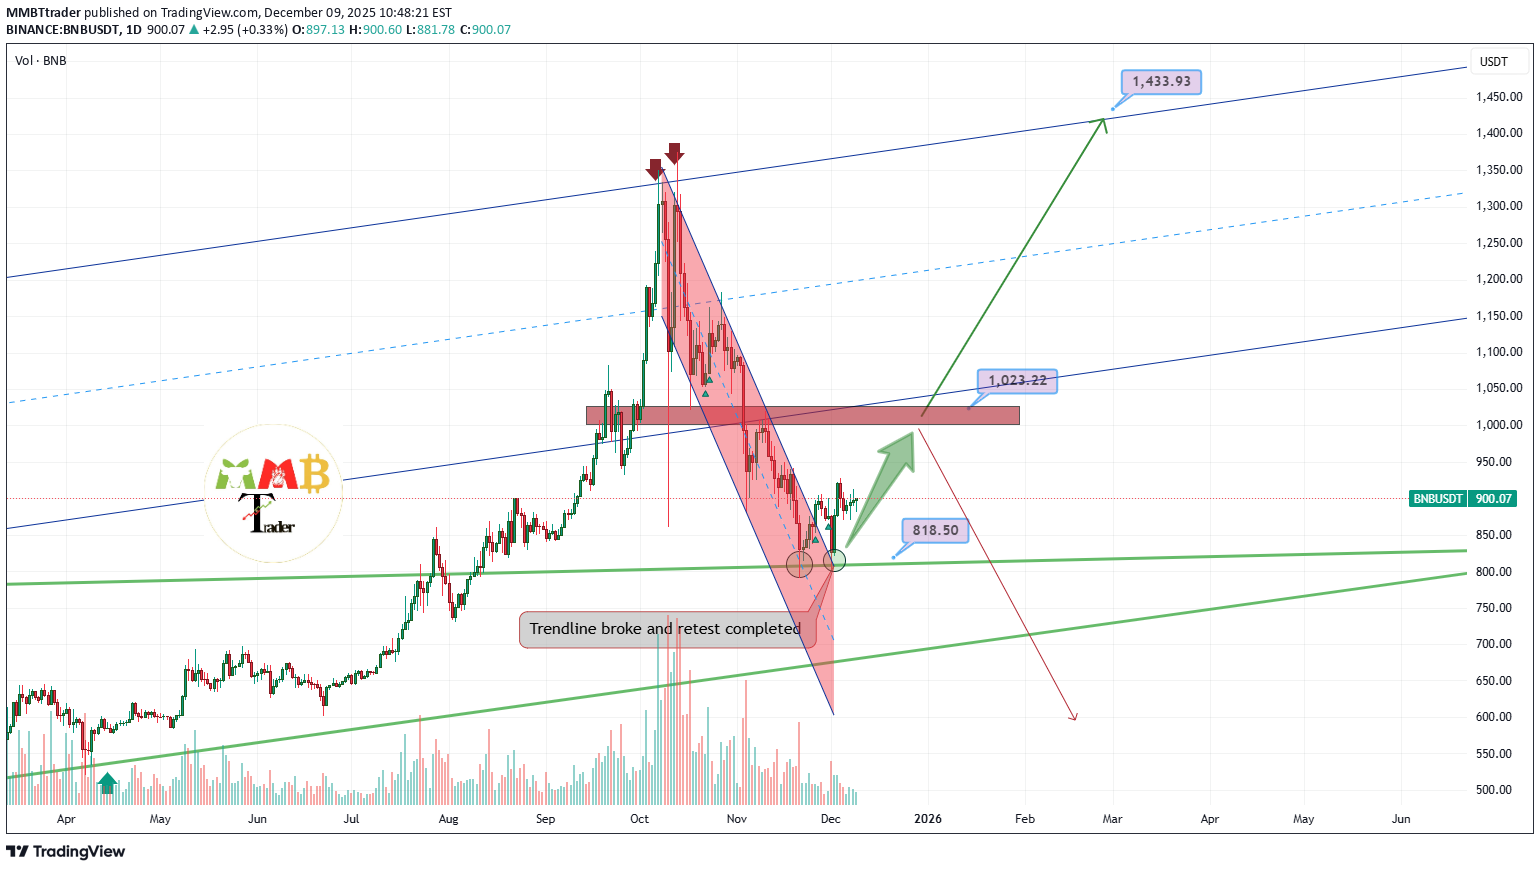
As observed on the chart, BNBUSDT has executed a decisive breakout above its descending channel, indicating a potential trend reversal. The price is now consolidating in a range, which is typical behavior following a significant breakout as the market digests the move and builds a new support base. We anticipate the next upward impulse to begin upon an increase in trading volume, which would confirm buyer commitment and likely propel price toward higher resistance targets.
DISCLAIMER: ((trade based on your own decision))
<
MMBTtrader
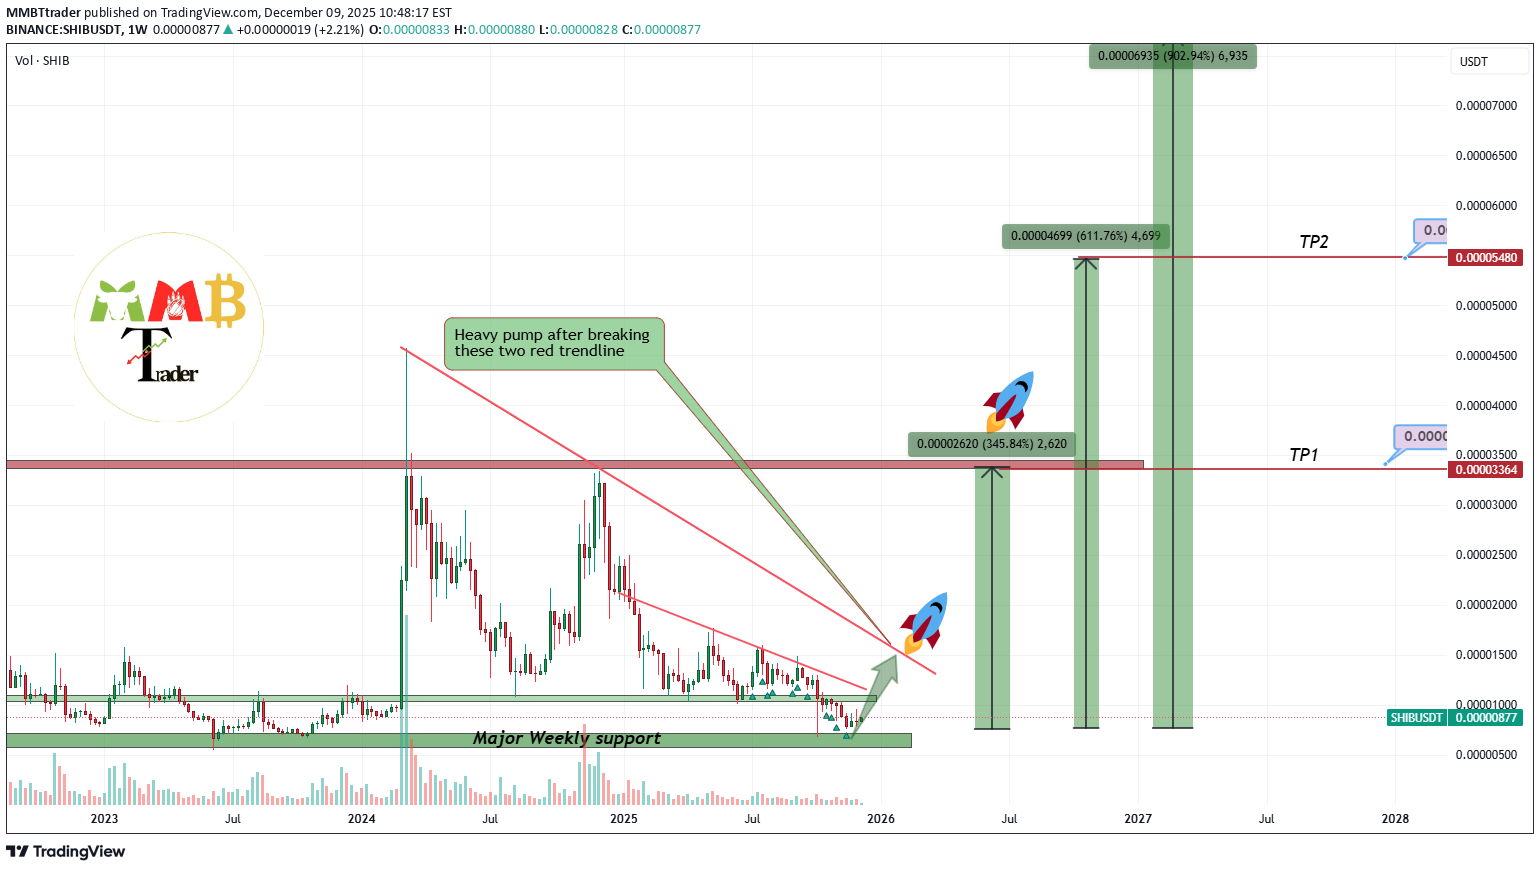
The technical structure for SHIB presents a high-potential setup, with a measured growth projection of 5x to 7x from the current price of $0.000008. However, this bullish scenario is contingent upon a decisive breakout above the two key descending trendlines, with a confirmed move beyond the $0.000014 resistance level required to validate the reversal and initiate the next upward phase.
DISCLAIMER: ((trade based on your own decision))
<
MMBTtrader
BTCUSDT Bullish channel holding strong
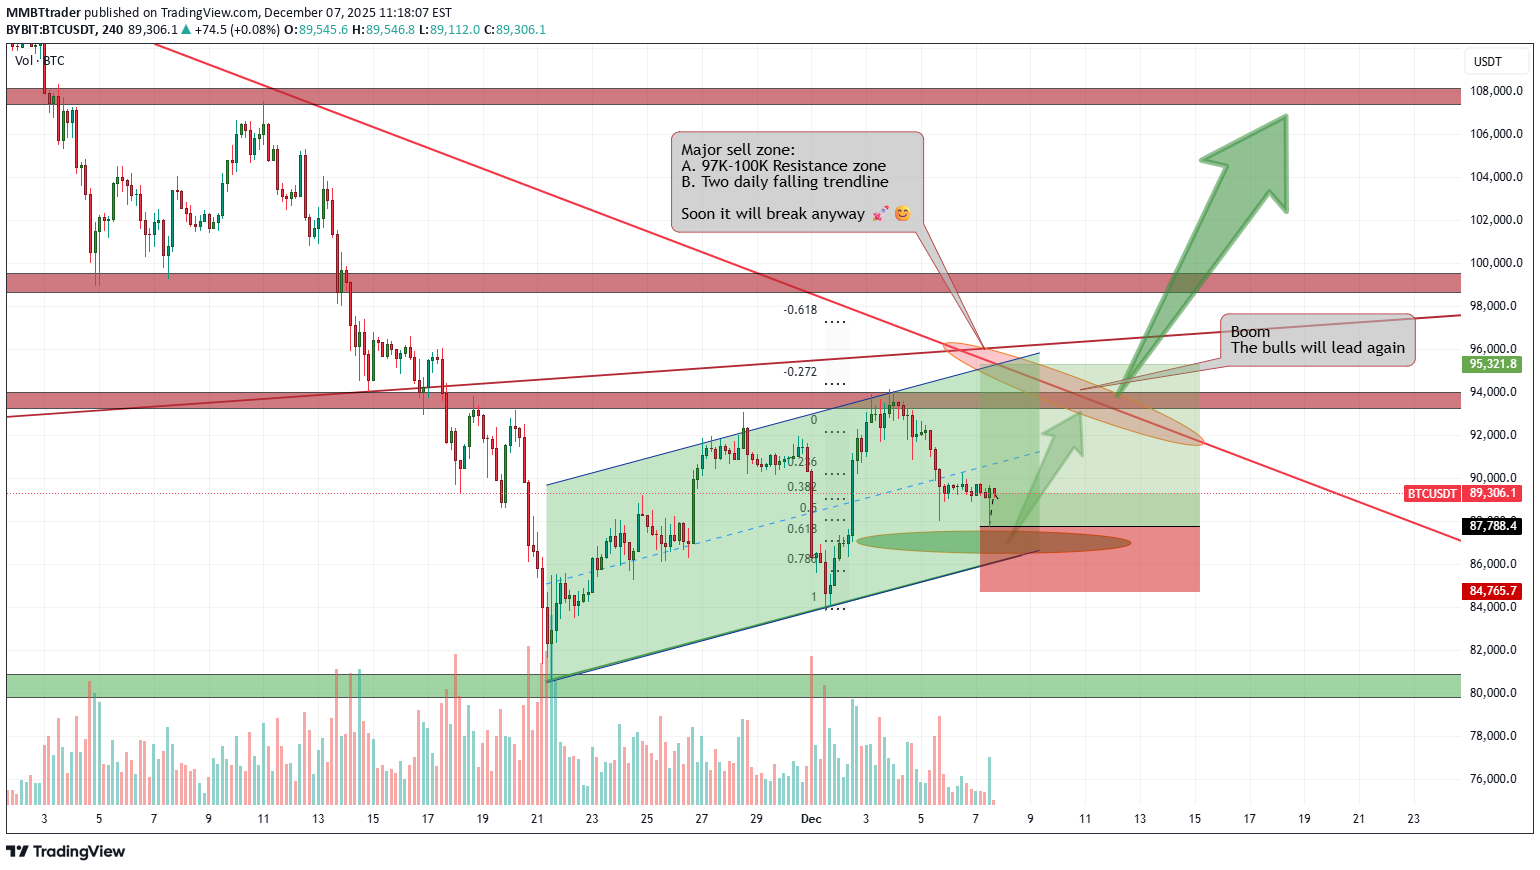
As observed on the chart, Bitcoin is trading within a newly formed ascending channel and is currently testing the lower boundary of this structure. This level represents a strategic support zone within the bullish technical framework, offering a favorable opportunity to consider initiating or adding to long positions with appropriate risk management.
Also if this channel resistance break to the upside then market is again bullish after a while.
DISCLAIMER: ((trade based on your own decision))
<
MMBTtrader
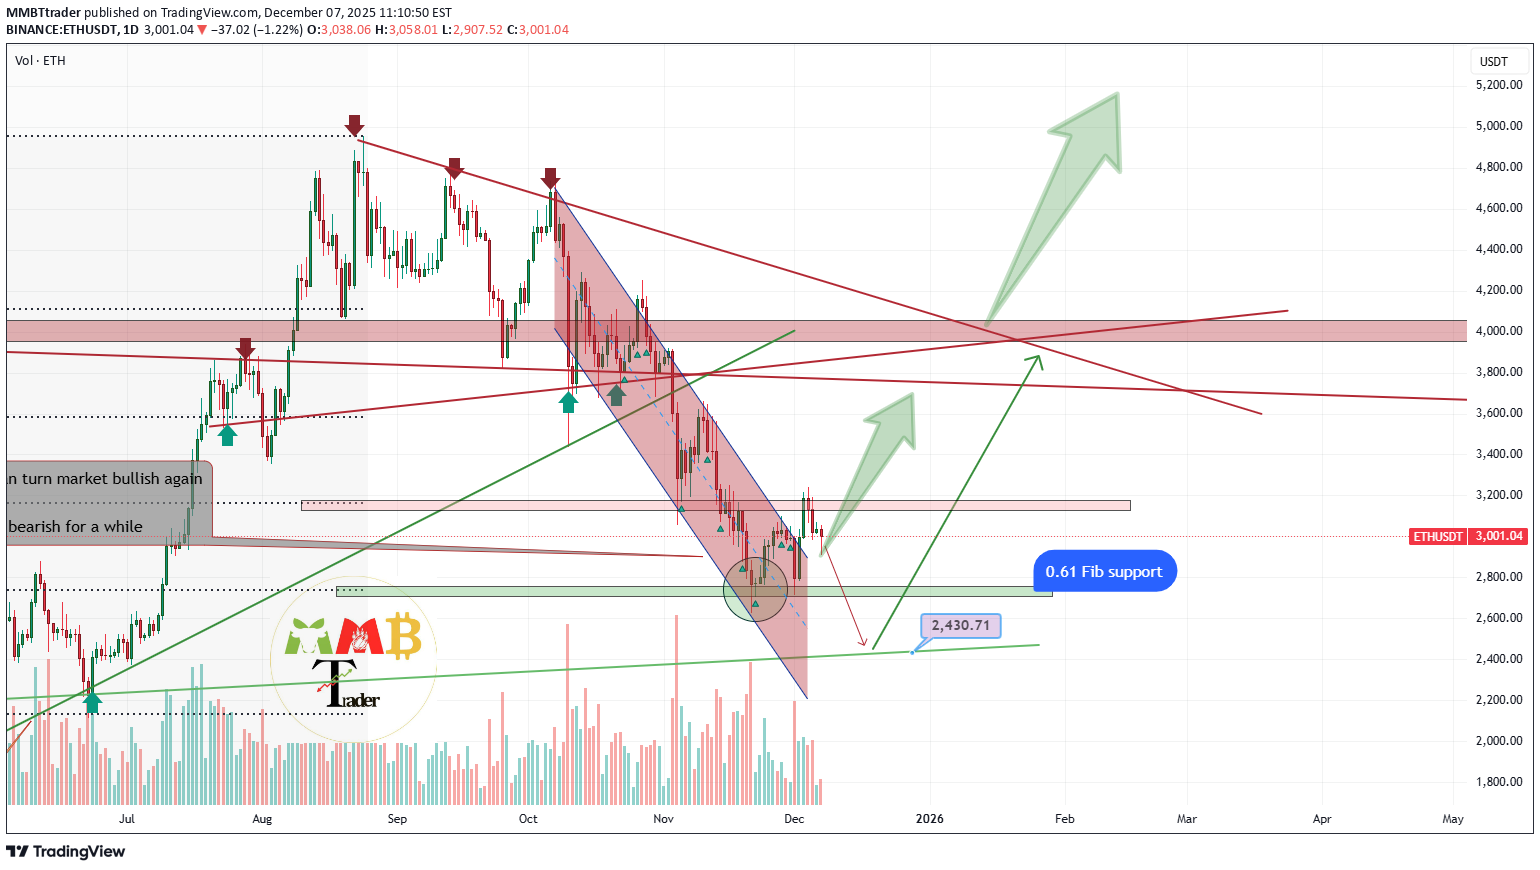
As observed on the chart, Ethereum has broken out of its previous channel structure and is currently consolidating within a defined range. This period of consolidation following a breakout is a typical technical development, often serving to build energy for the next directional move. Based on the prevailing structure, we anticipate a resumption of upward momentum following this phase of range-bound action, with the potential for a significant bullish impulse once accumulation is complete.
DISCLAIMER: ((trade based on your own decision))
<
MMBTtrader
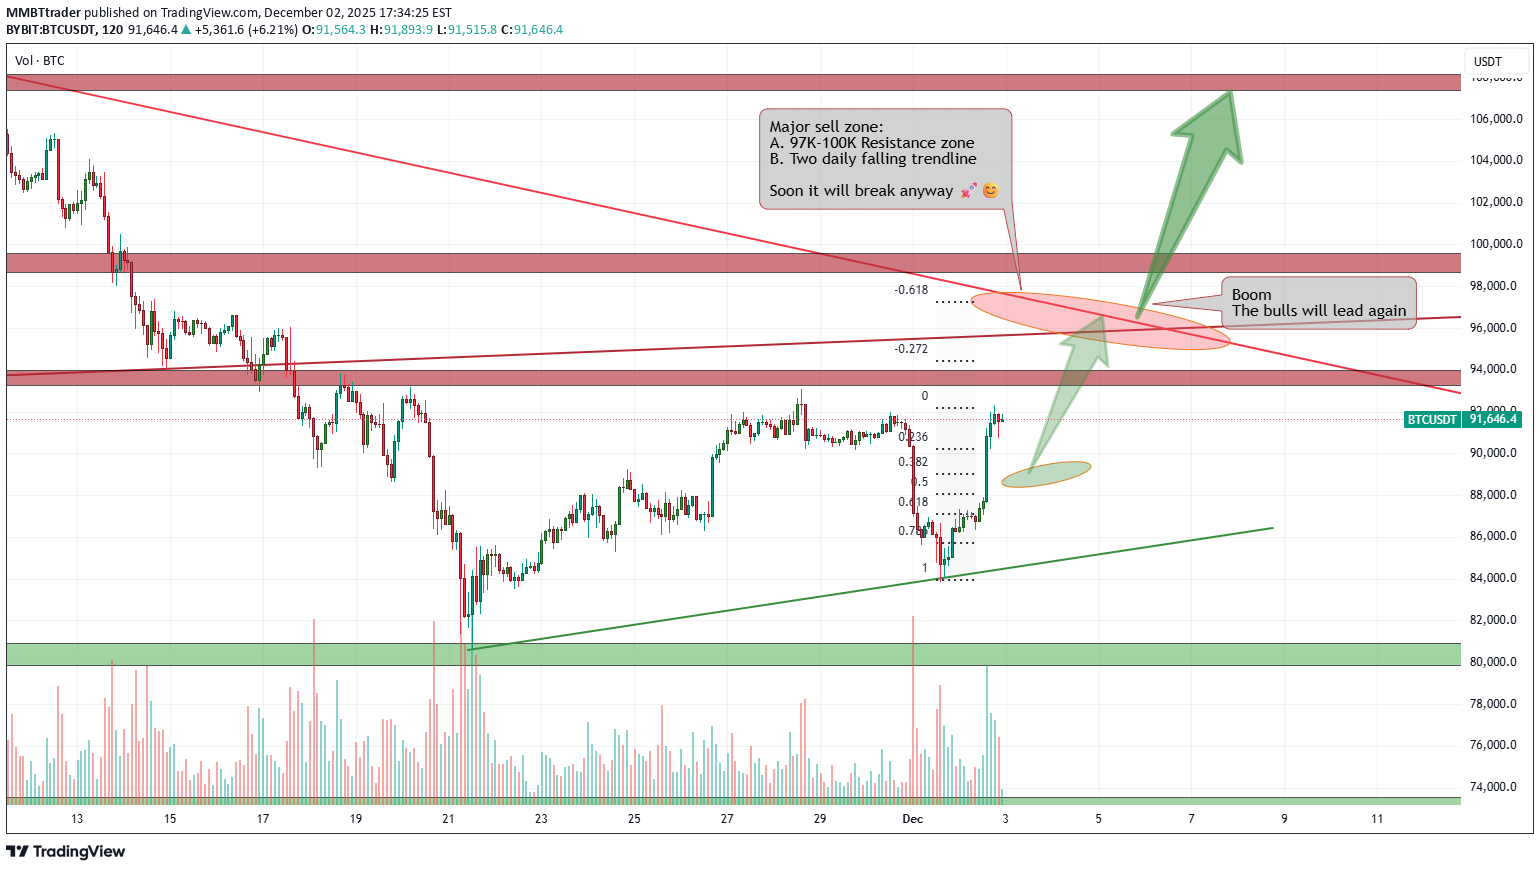
Bitcoin Head & Shoulders on 1H is pumping it above 100K$ soon
First lets take a look at that Attractive Reversal pattern which is now obvious in all tokens:
#Head_Shoulders :
The recent downward movement successfully triggered a significant number of long-position stop losses, effectively executing a 'long squeeze' and absorbing substantial sell-side liquidity. This classic market-clearing event often removes weak hands and over-leveraged positions, thereby reducing immediate overhead resistance.
With this liquidation event concluded, the market structure has notably cleared a key obstacle. The path upward now encounters less selling pressure from previously vulnerable positions. This development supports a bullish technical outlook, with the next primary targets residing at the $100,000 psychological level and beyond, as the new market structure allows for a more sustained advance.
DISCLAIMER: ((trade based on your own decision))
<
MMBTtrader
ZEC touching 0.61 Fibonacci support wait for pump
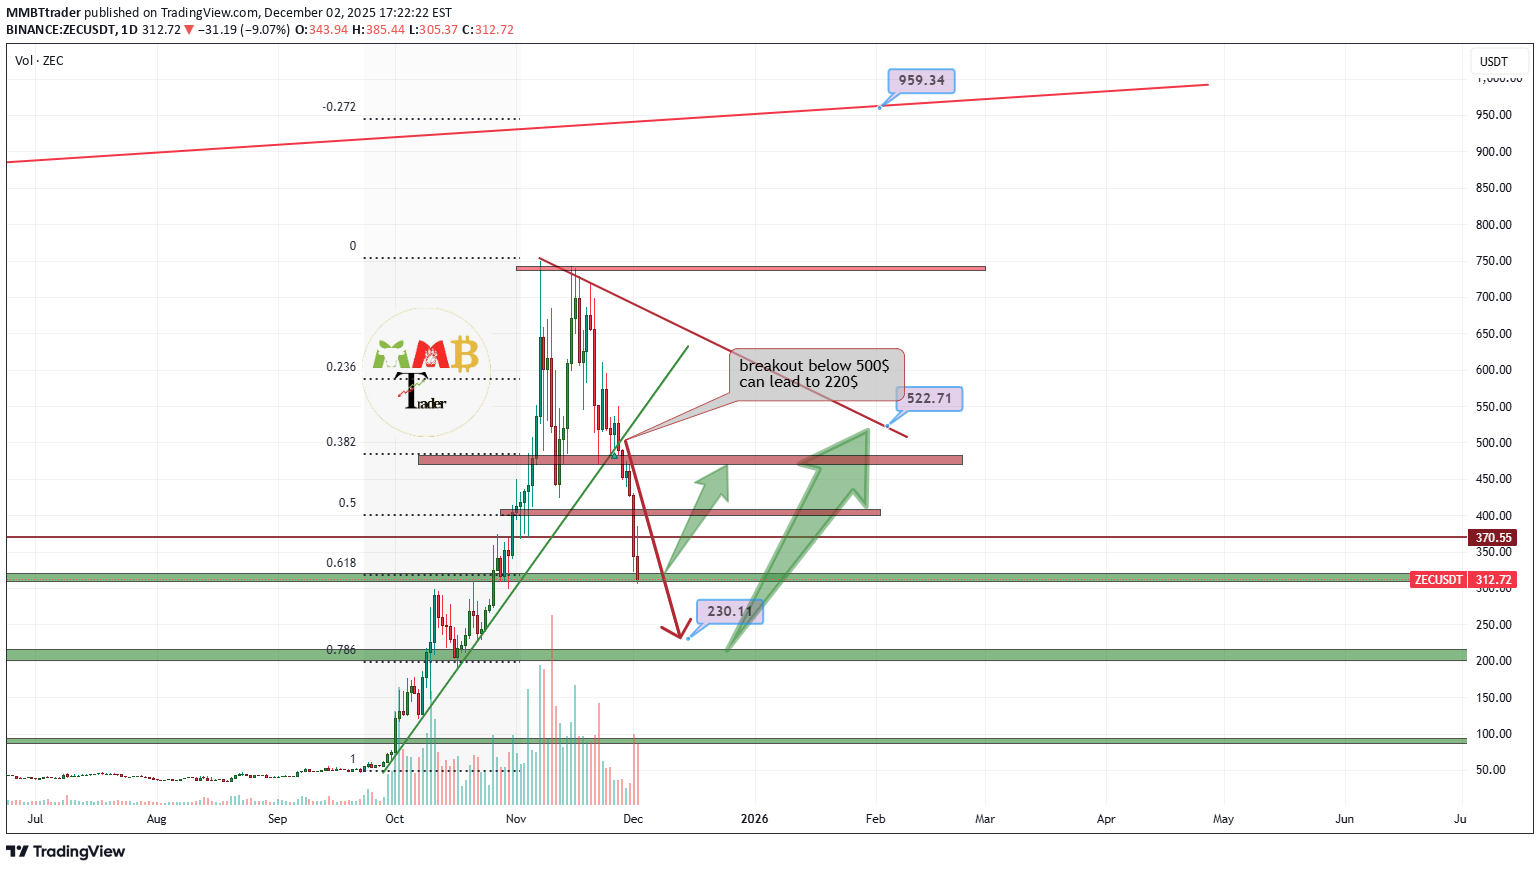
On the ZECUSDT chart, we have observed a decisive breakdown below the key $500 support level, resulting in a decline toward the $300 zone. This level now represents a critical technical confluence, aligning with both a historically significant support area and the 0.618 Fibonacci retracement level.
Given the oversold conditions and the strength of this Fibonacci-support confluence, a technical rebound toward the $500 level—now likely to act as resistance—is plausible. Such a move would be characteristic of a retest of the broken support level, which, if rejected, could result in a continuation of the downtrend. Should the $300 support fail to hold, the next significant structural support would become the primary focus.
DISCLAIMER: ((trade based on your own decision))
<
MMBTtrader
SLPUSDT DO NOT miss this 8X!!

As consistently highlighted in previous analyses, the current price zone near the all-time low of $0.0008 represents what we assess to be a long-term accumulation area for SLPUSDT. This level is further supported by the token’s extended basing structure and historically oversold conditions.
A decisive breakout above the prevailing channel resistance would signal the completion of this accumulation phase and likely initiate a strong bullish impulse. Given the depth and duration of the historical basing pattern, a measured upside projection suggests the potential for a 10x appreciation from current levels, aligning with the scale of momentum typically observed after prolonged consolidation in low-market-cap assets.
DISCLAIMER: ((trade based on your own decision))
<
MMBTtrader
ETHUSDT Major breakout and pump may happen soon
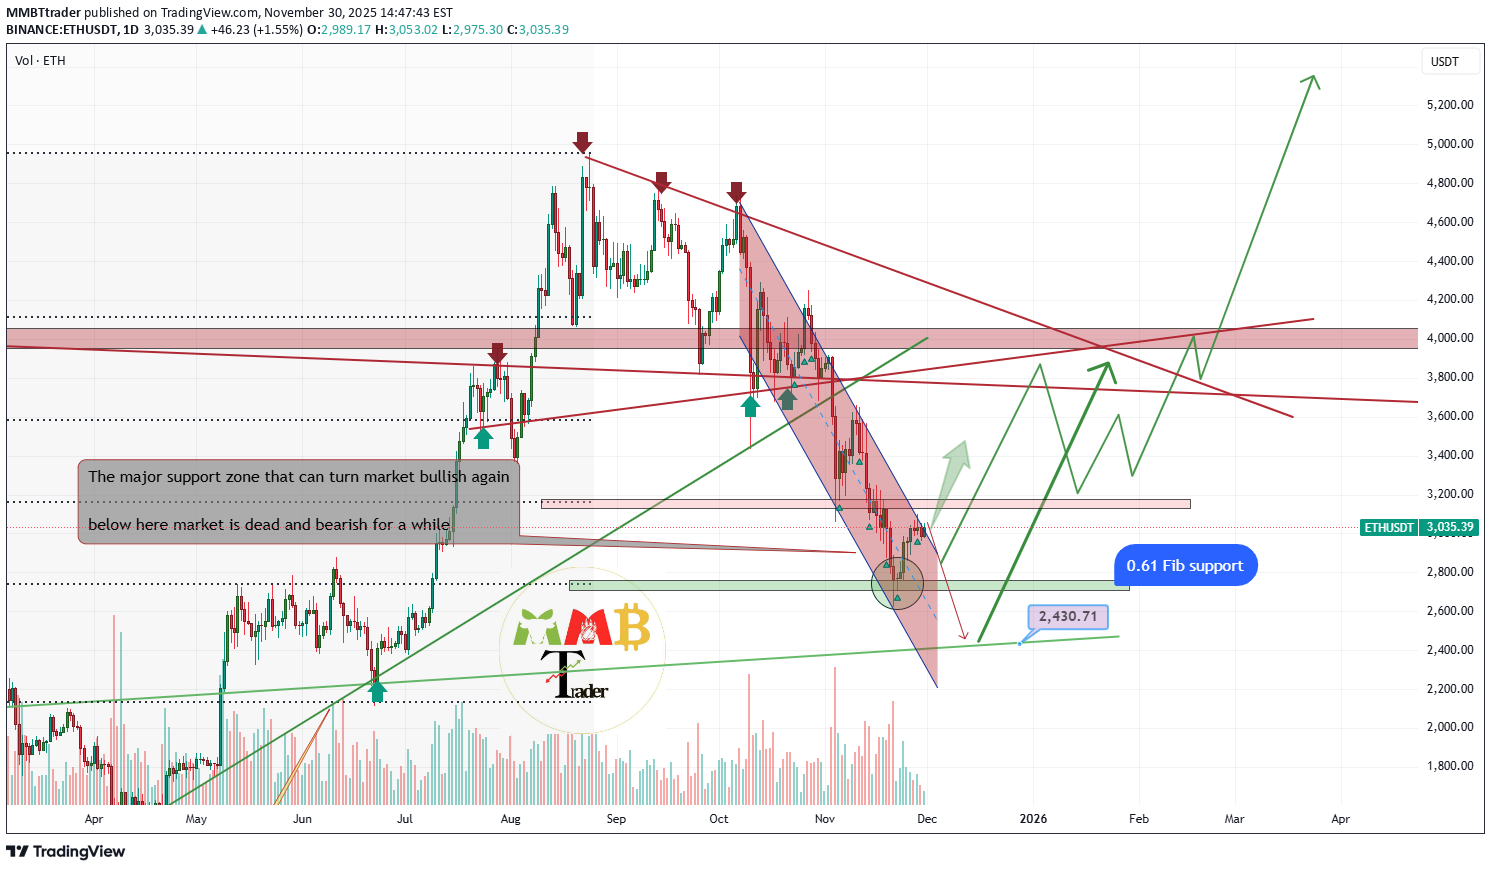
A decisive breakout above the $3,100 level for Ethereum would represent a significant technical milestone, potentially heralding the beginning of a new bullish phase. Such a move, particularly if validated by sustained volume and a daily close above this key resistance, could initiate a strong upward impulse with an initial technical target near the $5,000 zone, aligning with measured move projections from the recent consolidation structure.
It is important to emphasize that a confirmed breakout of the prevailing channel resistance is a prerequisite for this bullish scenario to unfold. Based on current technical structure and momentum indicators, we assess the probability of such a breakout occurring in the near term at approximately 70%, though traders should await clear confirmation before positioning for extended upward movement.
DISCLAIMER: ((trade based on your own decision))
<
Disclaimer
Any content and materials included in Finbeet's website and official communication channels are a compilation of personal opinions and analyses and are not binding. They do not constitute any recommendation for buying, selling, entering or exiting the stock market and cryptocurrency market. Also, all news and analyses included in the website and channels are merely republished information from official and unofficial domestic and foreign sources, and it is obvious that users of the said content are responsible for following up and ensuring the authenticity and accuracy of the materials. Therefore, while disclaiming responsibility, it is declared that the responsibility for any decision-making, action, and potential profit and loss in the capital market and cryptocurrency market lies with the trader.