
Moriss365
@t_Moriss365

What symbols does the trader recommend buying?
Purchase History
Trader Messages
Filter
Message Type
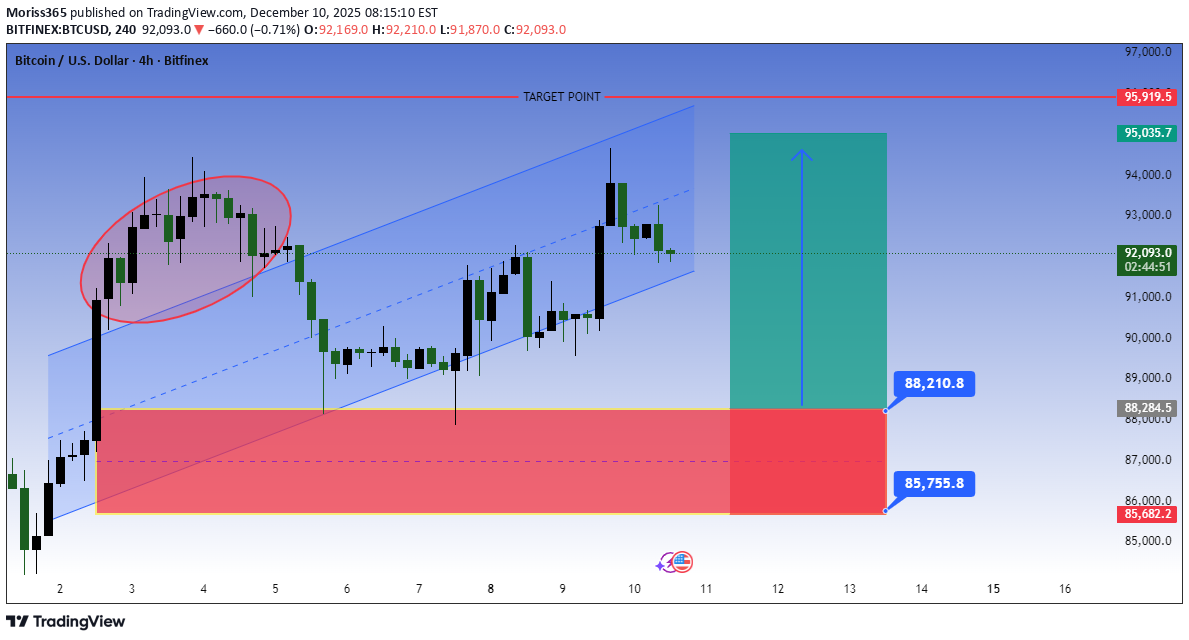
1. Price Movement: The candlestick pattern indicates an ascending trend channel (blue lines) with a recent breakout above the upper channel line (circled area), suggesting bullish momentum. 2. Target Point: A red horizontal line marks a target at 95,919.5, implying the expected upside if the bullish move continues. 3. Support Zone: A red shaded rectangle highlights a demand zone between 85,755.8 and 88,210.8, acting as a key support level. 4. Green Rectangle: Represents a potential profit zone extending from approximately 88,210.8 to the target 95,919.5, indicating an expected price surge. 5. Current Price: BTC/USD is trading around 92,089 (as of 02:50:26), sitting above the support and aiming for the target. 6. Analysis Implication: The setup suggests a bullish continuation after the breakout, with traders likely watching for sustained movement above the channel to confirm the upward run toward the target, while keeping an eye on the support zone for any reversal🚀📈
“BTCUSD 1H — Range Support Buy Targeting Range High Liquidity
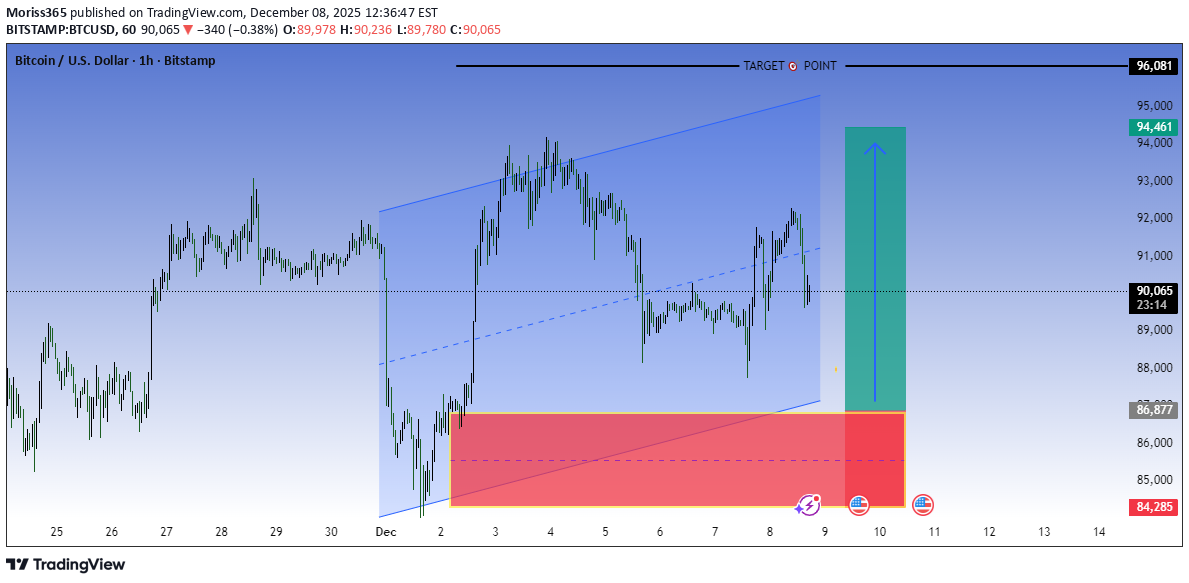
1. Market Structure (1H BTCUSD) Overall structure: Still range-bound / corrective, not a clean trend. Price is trading inside a rising channel but momentum has weakened. We recently rejected from the upper mid-range, not from the absolute highs — that matters. Interpretation: This is consolidation after a strong move, not distribution yet — but buyers are no longer aggressive. --- 2. Key Zones (Very Important) 🔴 Demand / Support Zone (Red Box) Roughly 85,000 – 86,800 Multiple reactions here → high-quality demand Liquidity + prior structure low + channel support If price enters this zone and holds: → High-probability bounce / long setup If this zone breaks cleanly (1H close below): → Structure fails → expect accelerated sell-off --- ⚫ Resistanc… “BTCUSD 1H — Range Support Buy Targeting Range High Liquidity”
Disclaimer
Any content and materials included in Finbeet's website and official communication channels are a compilation of personal opinions and analyses and are not binding. They do not constitute any recommendation for buying, selling, entering or exiting the stock market and cryptocurrency market. Also, all news and analyses included in the website and channels are merely republished information from official and unofficial domestic and foreign sources, and it is obvious that users of the said content are responsible for following up and ensuring the authenticity and accuracy of the materials. Therefore, while disclaiming responsibility, it is declared that the responsibility for any decision-making, action, and potential profit and loss in the capital market and cryptocurrency market lies with the trader.