
OnchainNewsBlog
@t_OnchainNewsBlog

What symbols does the trader recommend buying?
Purchase History
Trader Messages
Filter
Message Type
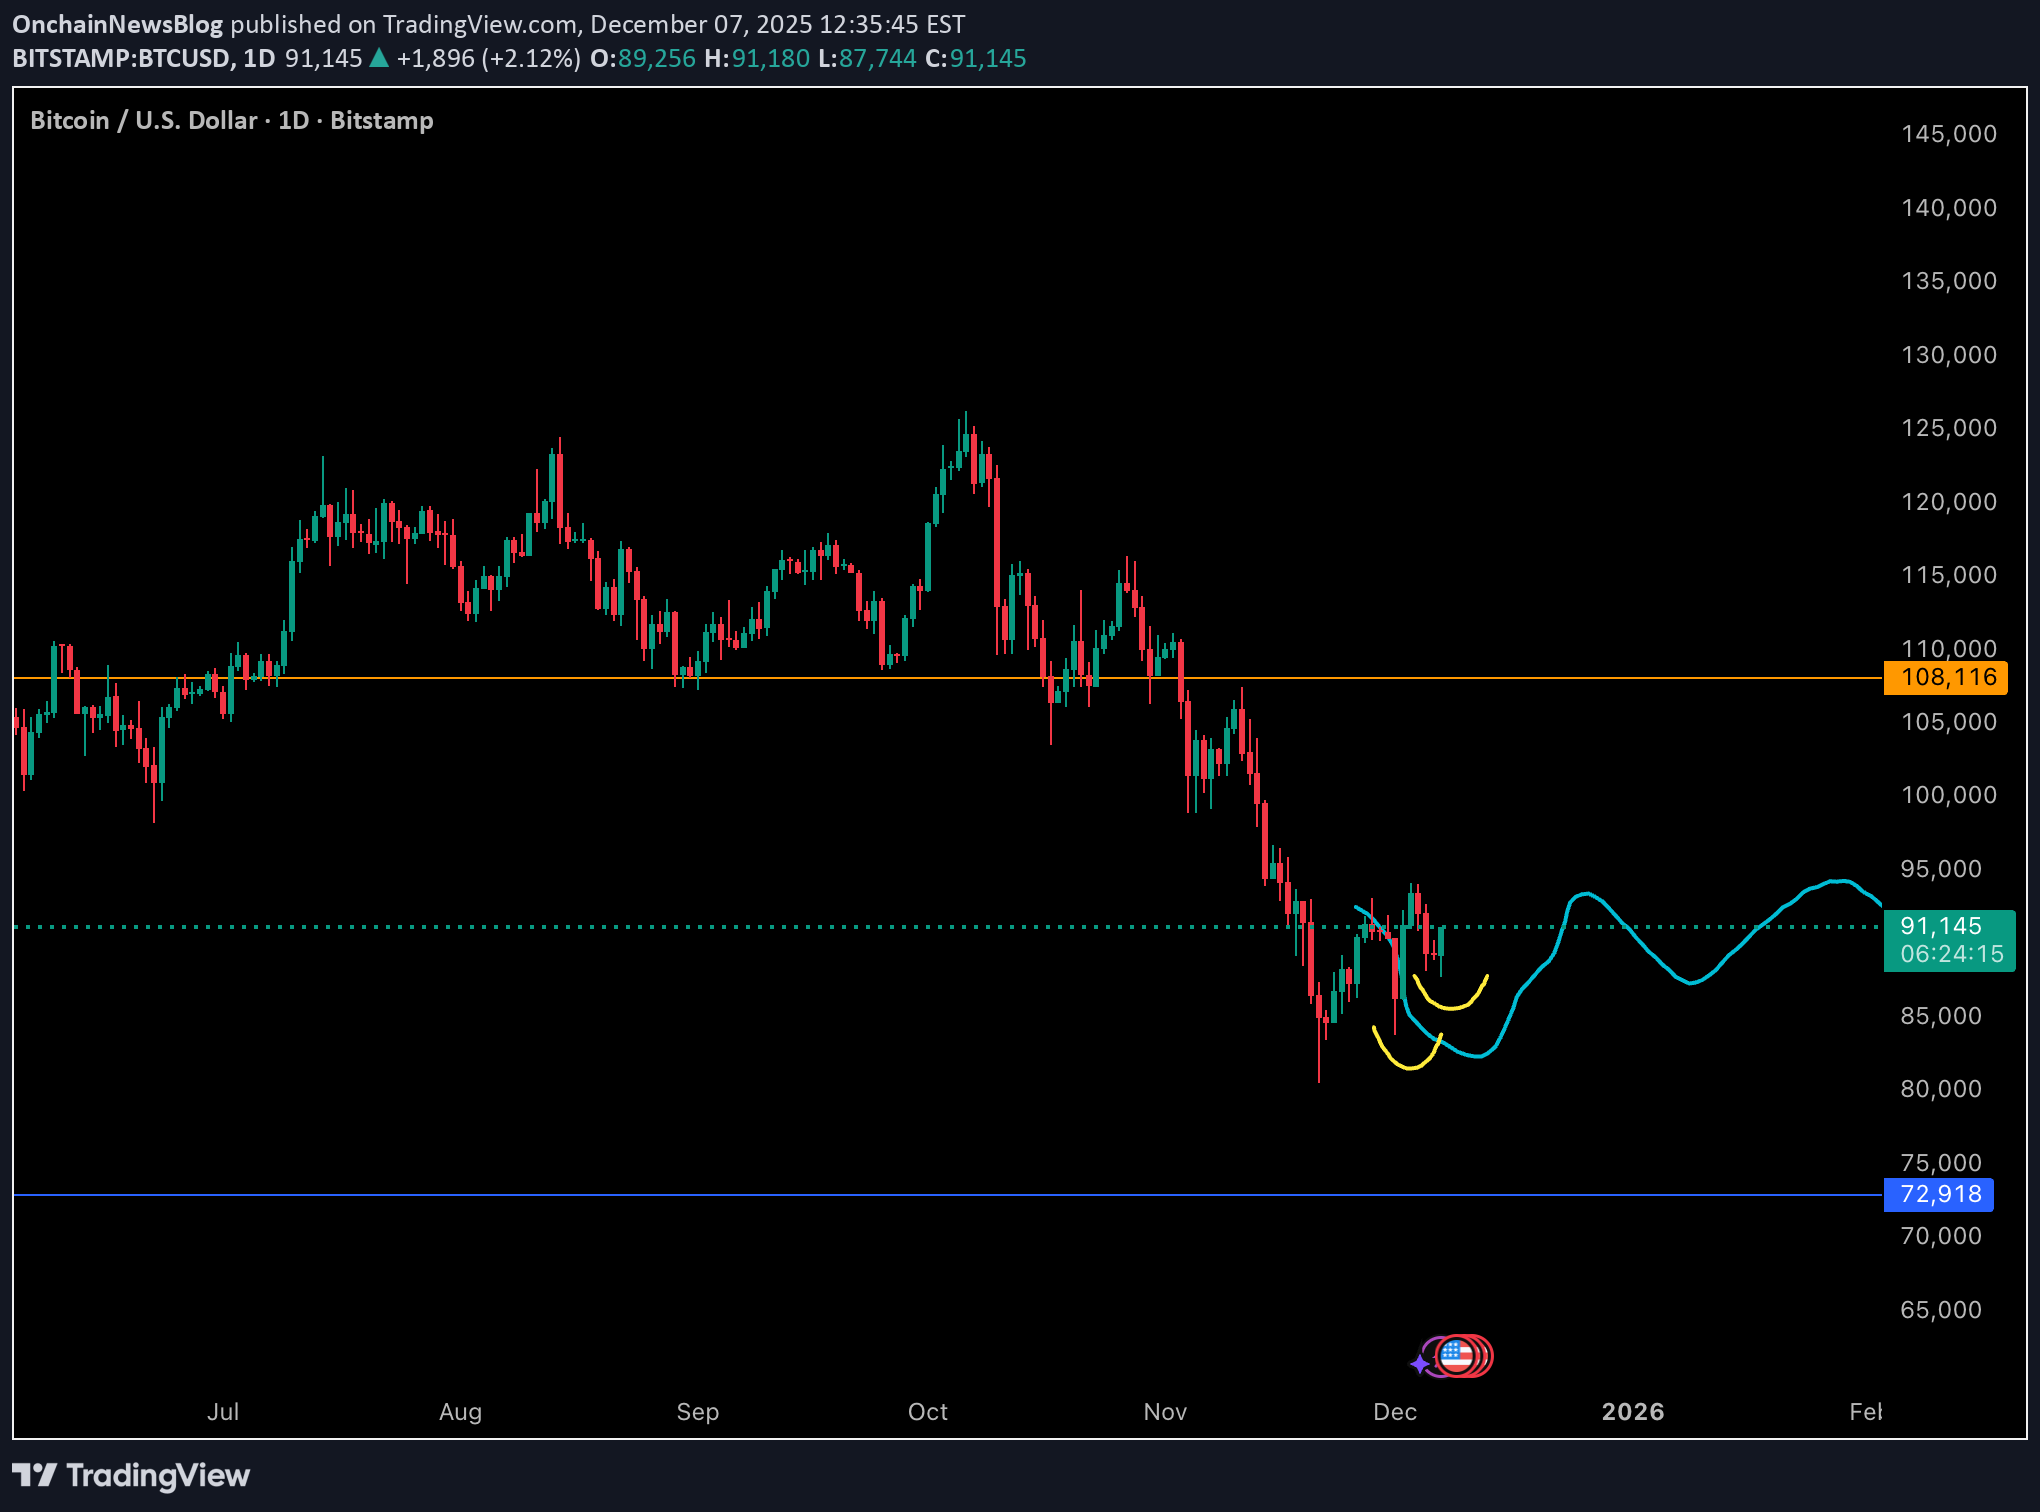
BTC continues to follow the exact pathway laid out by the chop line. Despite the volatility, price action is developing in a very constructive manner. We’ve now carved out another higher low, which reinforces the shift from trending downside into early base-building. This is classic bullish behavior inside a consolidation phase: - sellers push into support - buyers step in earlier each time - higher lows start stacking - momentum gradually tilts upward The yellow curves highlight where demand continues to show up. Each reaction is smoother, less aggressive, and more controlled, which typically reflects accumulation rather than panic-driven selling. As long as BTC respects this rising structure, the market is quietly strengthening beneath the surface. The chop isn’t noise - it’s the transition pattern you want to see before a larger reversal leg kicks in. BTC is bullish through the chop, and the structure is tracking perfectly with the projected path.
ZEC Update: The Expected Chop Is Finally Showing Up
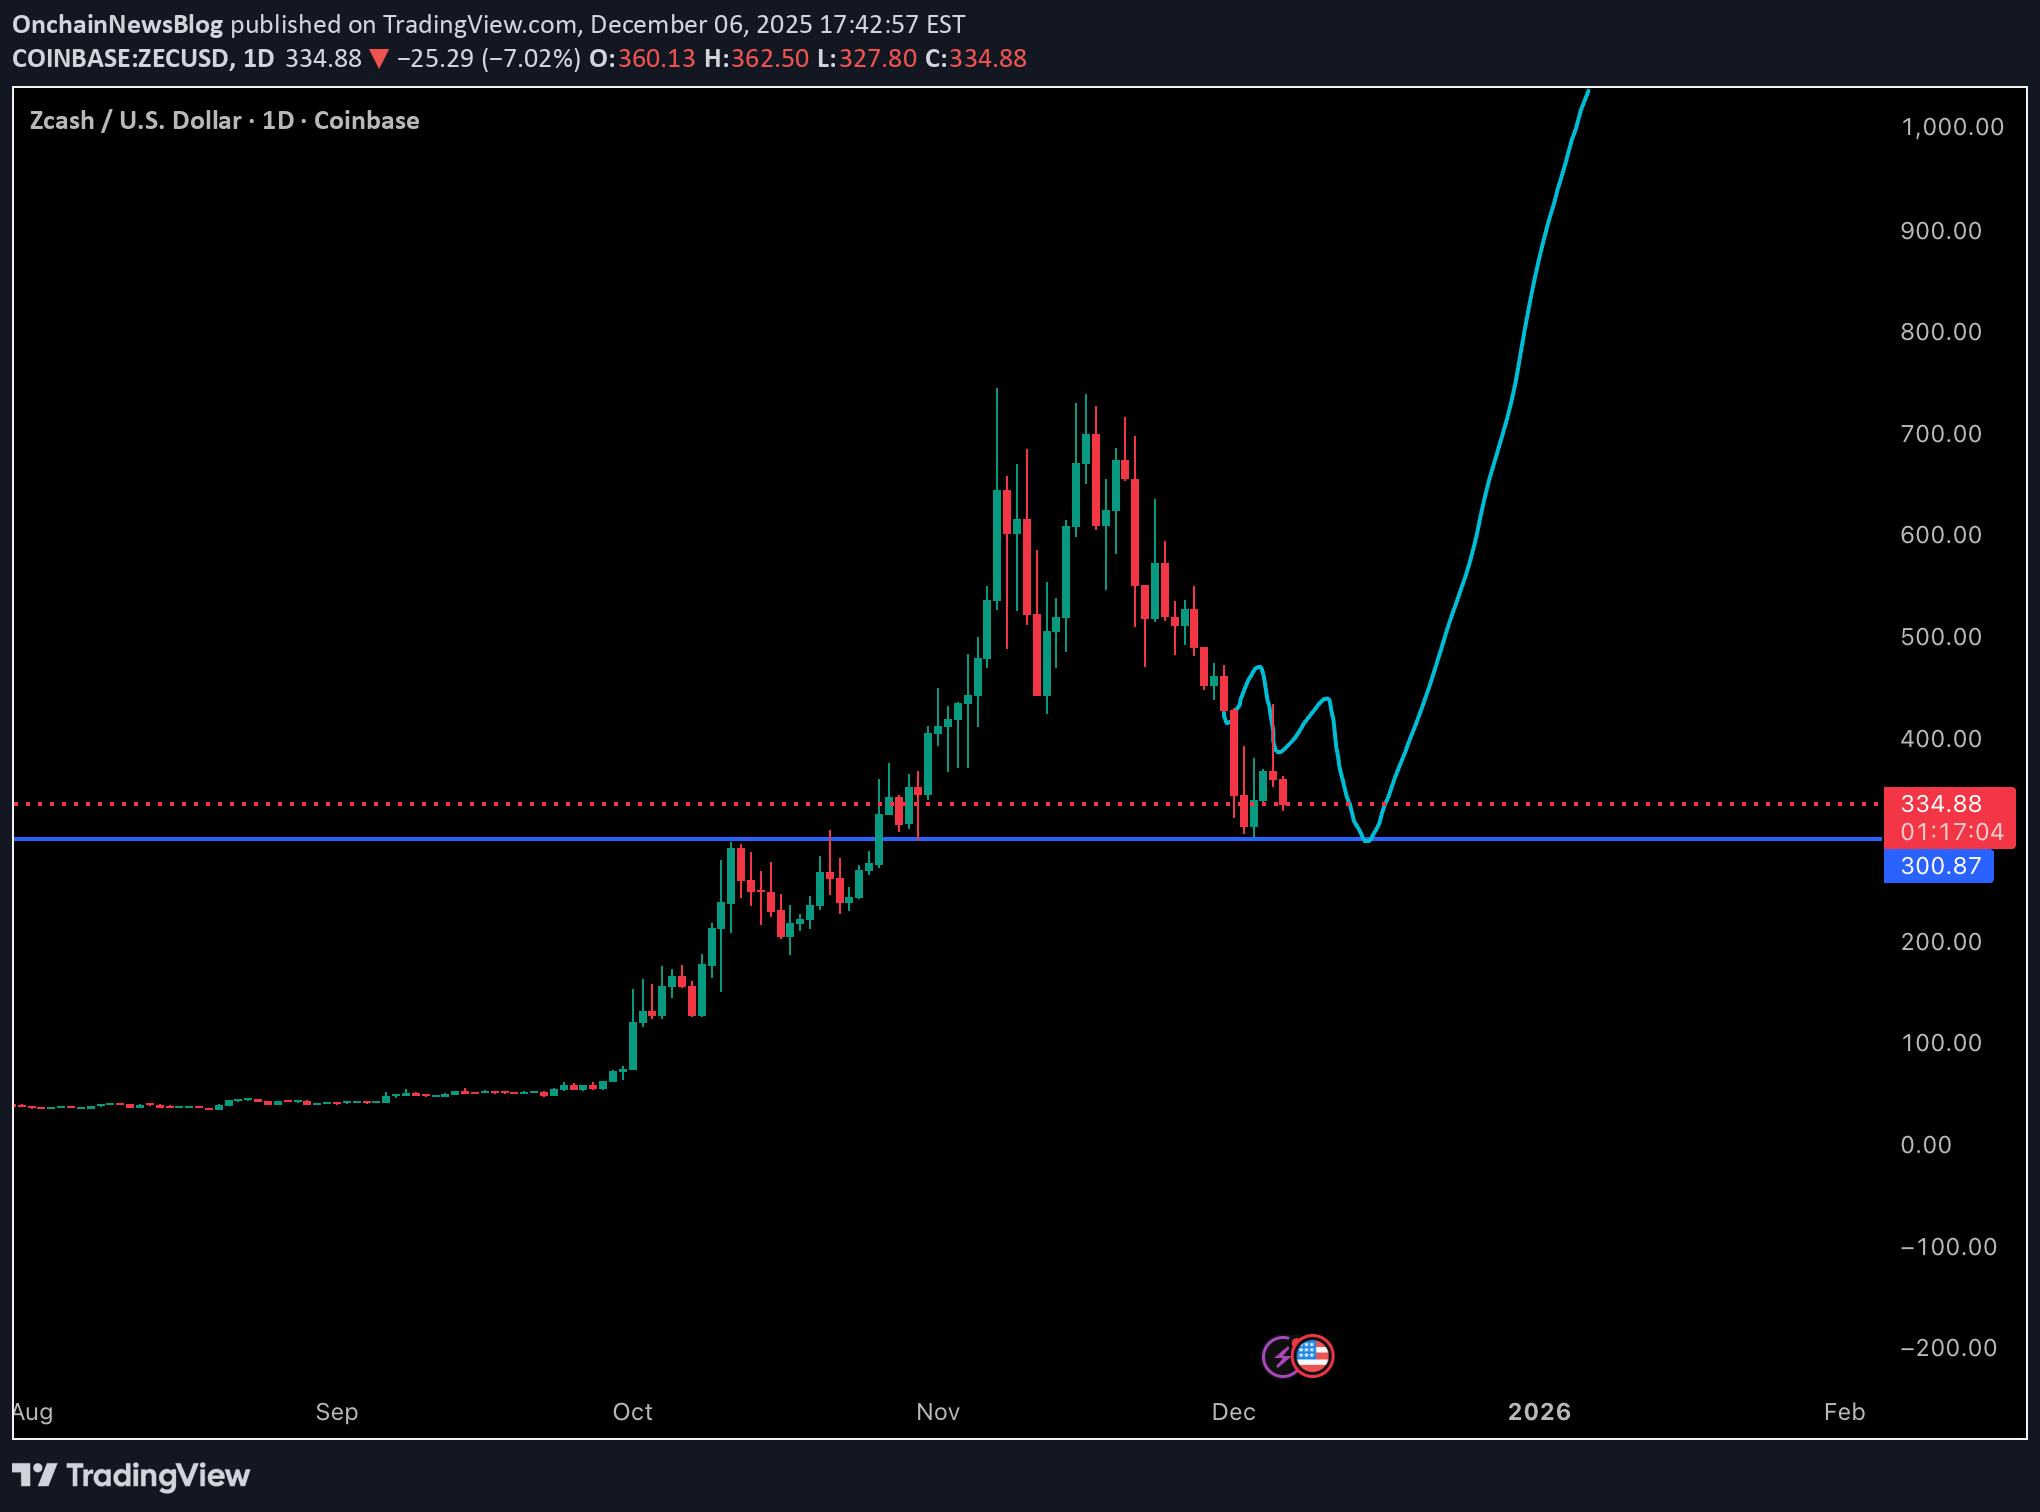
ZEC Update: The Expected Chop Is Finally Showing Up ZEC is now giving us the slower, choppier price action that I originally expected before the clean tag of 300. After that sharp bounce, price is rotating back down toward the same support zone, and this controlled drift is completely normal when a market is trying to build a base. What I’m watching now is simple: - ideally we form a higher low somewhere above the previous wick (around the 300 region) - a bounce from roughly 310ish would signal strengthening structure - then a push into a higher high would confirm the reversal forming on the daily chart This kind of back-and-forth is exactly how an accumulation zone builds. The violent reaction at 300 showed strong demand, but a trending reversal usually takes time and multiple attempts. As long as ZEC keeps defending the 300 level and begins carving out higher lows, the structure continues to lean bullish. Monitoring closely for the next leg of the reversal.
ZEC Reaction Update: Clean Tag of 300 and a Violent Bounce
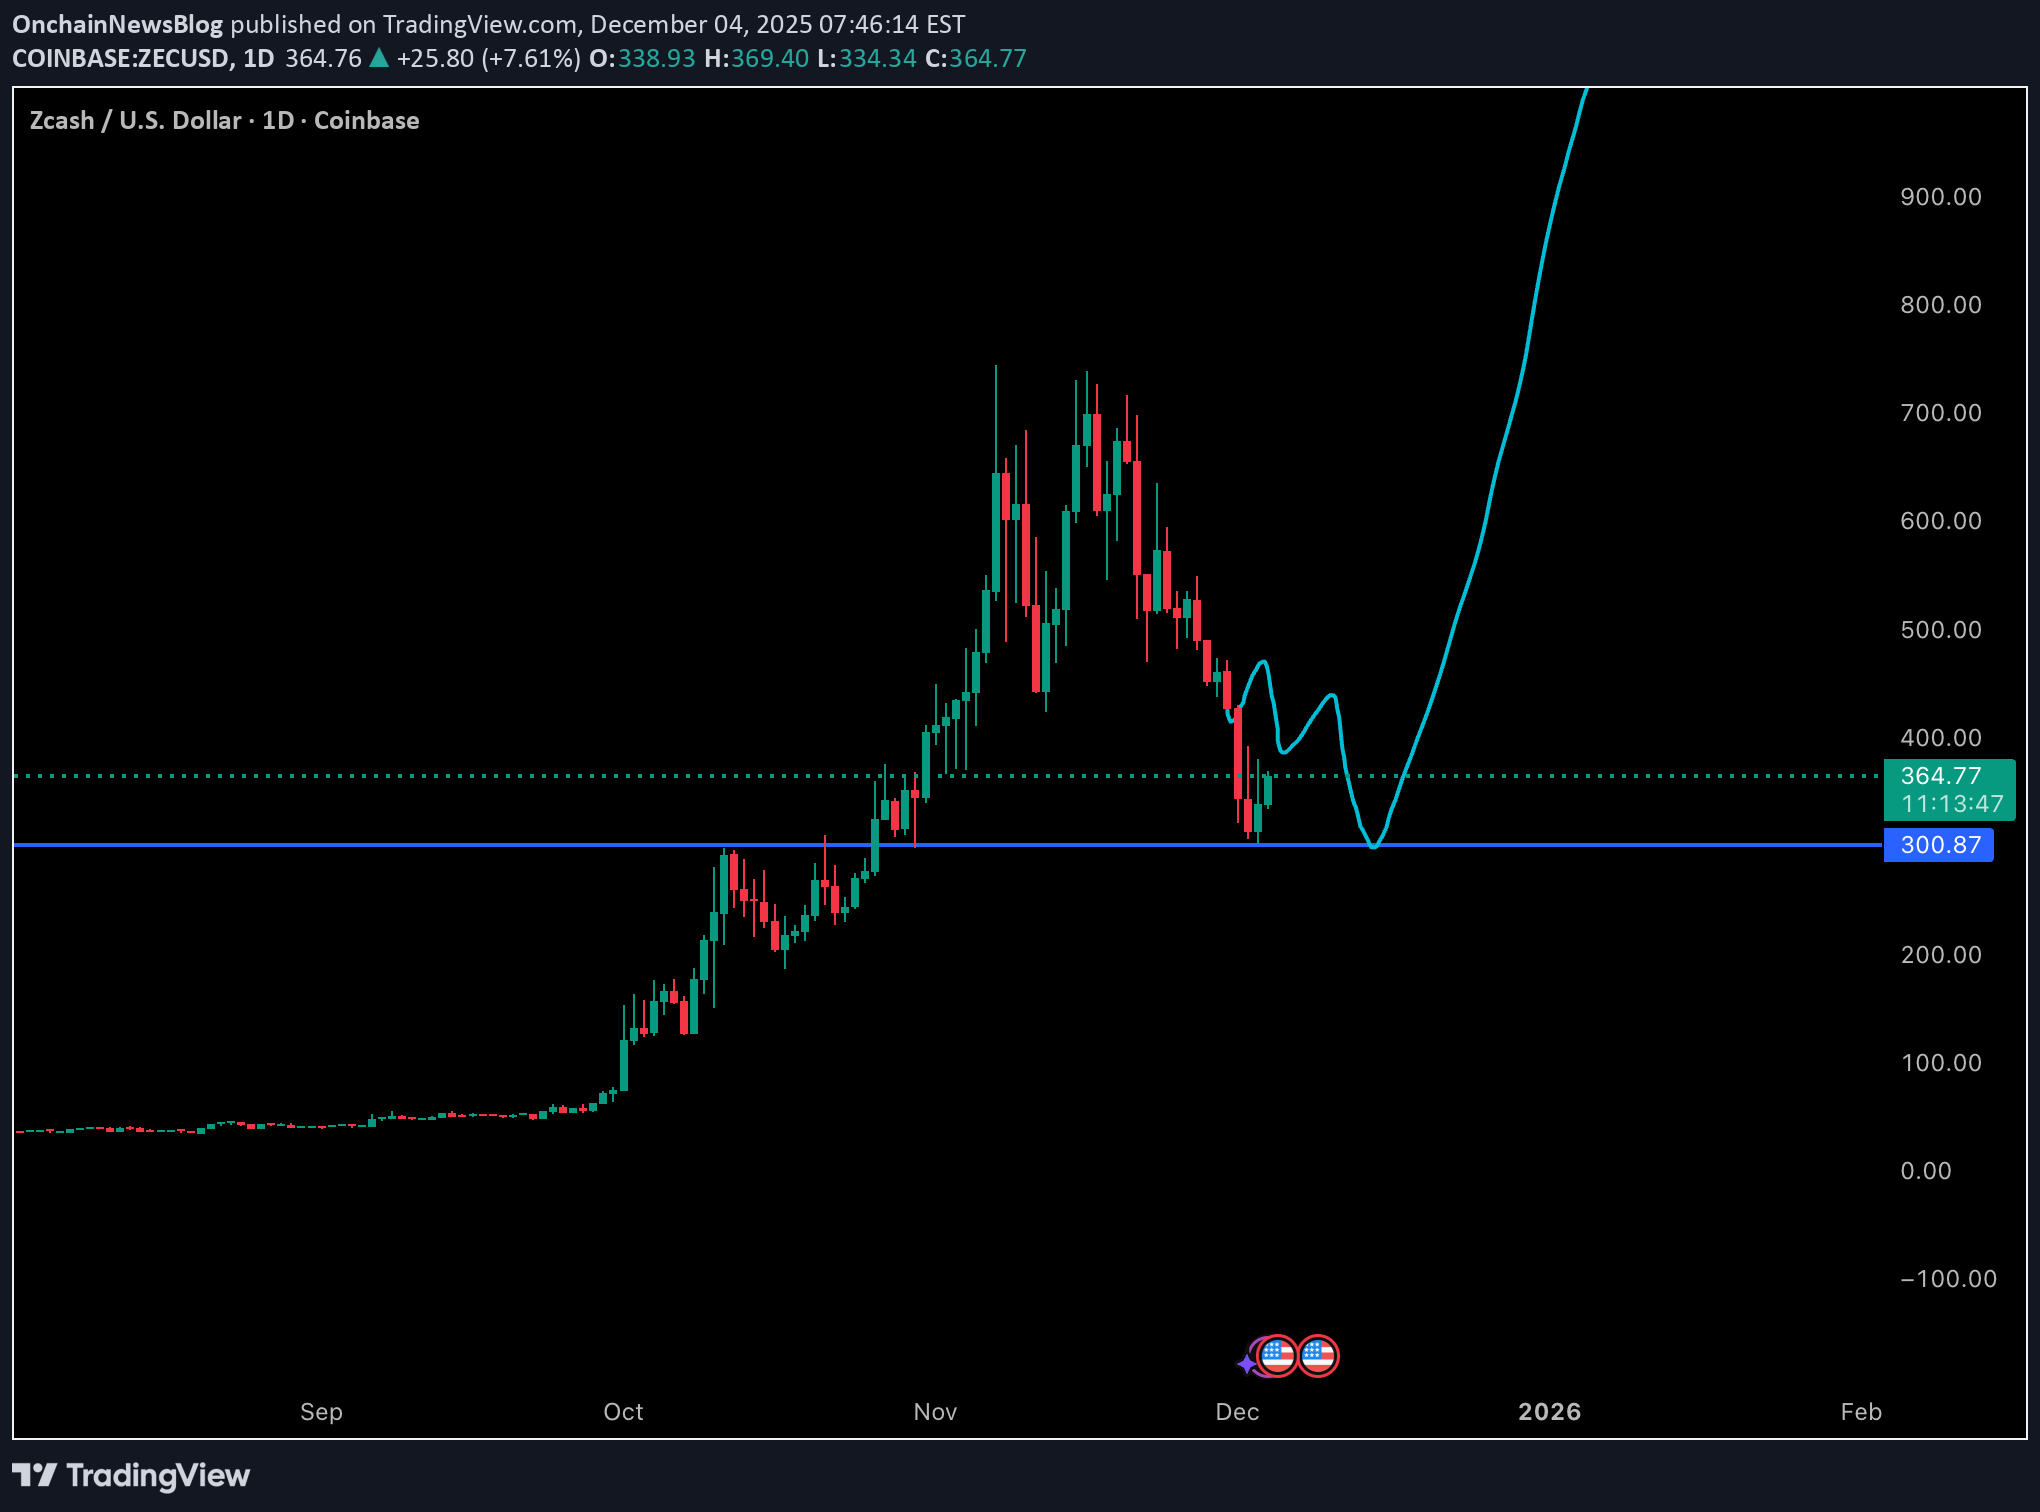
ZEC just delivered the exact reaction we were looking for at the 300 level. I kept the original teal projection on the chart for reference since the broader structure is still playing out, but price moved faster than expected. I anticipated a bit more chop and a slower drift into support, yet ZEC went straight down into the 300 zone and instantly snapped back with a strong, aggressive bounce. This type of behavior reinforces how significant that 300 level is. Buyers were waiting there with size, and the immediate reversal shows clear demand absorption and a potential shift in short term momentum. Even though the path was steeper than projected, the core idea remains intact: 300 is major support, and the reaction confirms it. Now we watch to see whether ZEC can build structure above this bounce and start forming higher lows. For now, the key takeaway is simple: the market respected the level perfectly, and the response was far more decisive than expected.
BTC Follow-Up: Bullish Structure Playing Out Exactly as Expected
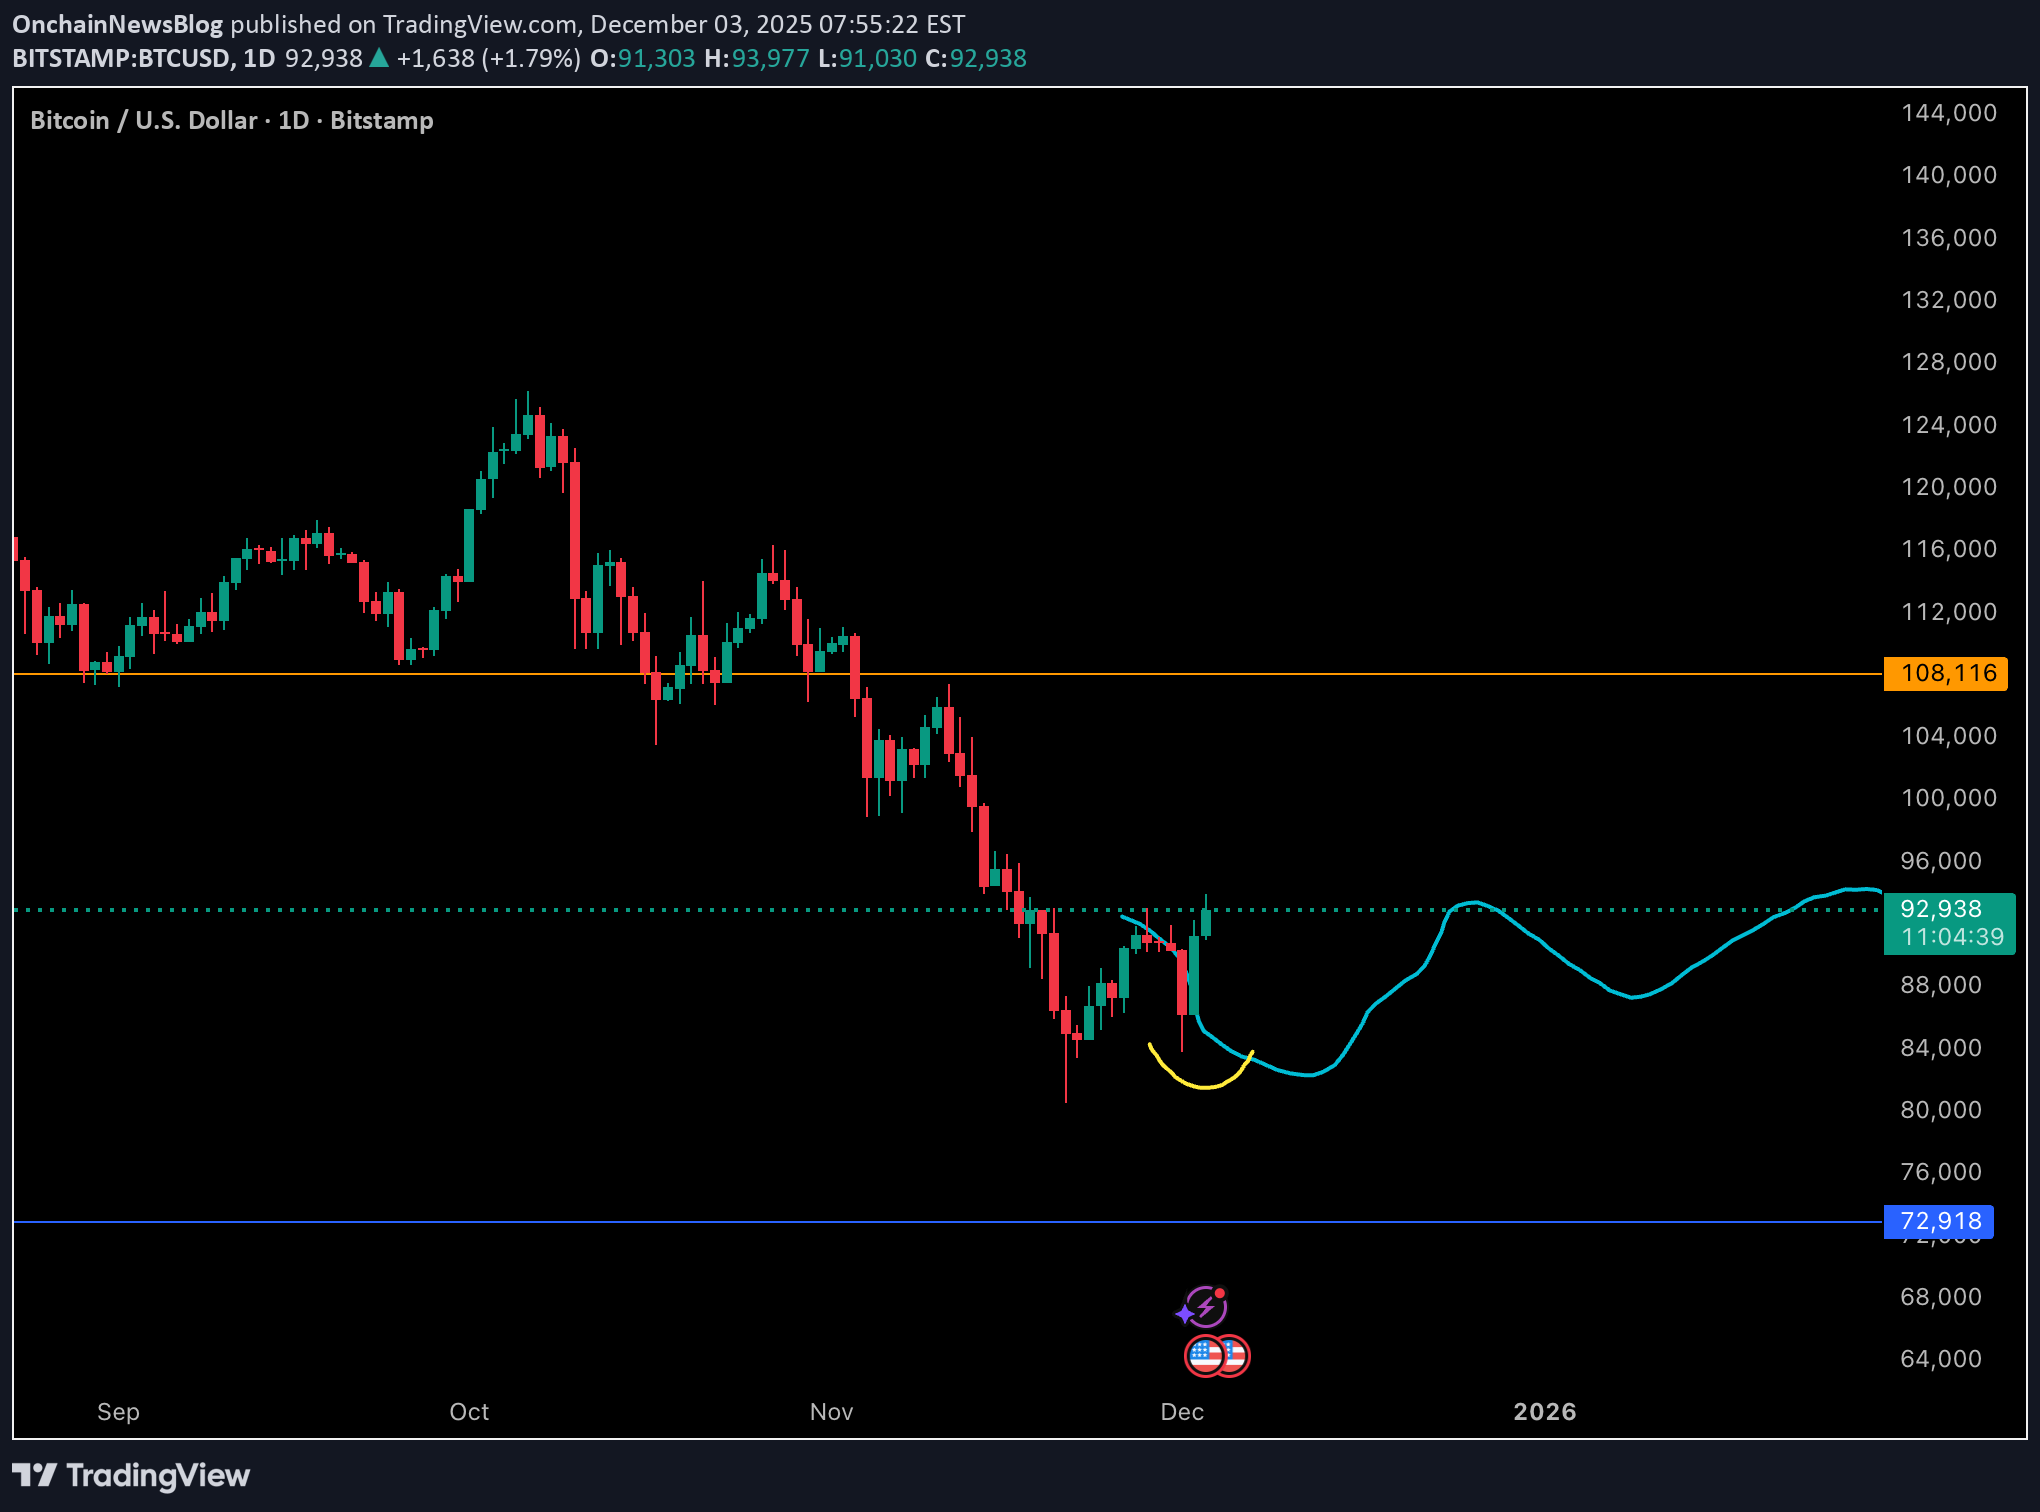
The reaction we highlighted earlier has now followed through beautifully. BTC held the higher low, respected the demand zone, and has pushed upward with clear momentum. This is exactly the kind of constructive price action that confirms the initial bullish read. Sellers attempted continuation, but the market absorbed the pressure and reversed decisively. That higher low was the structural shift we needed to see, and BTC is now building out a cleaner series of rising lows and controlled retracements. This is how early trend reversals form: not with one explosive candle, but with consistent defense of higher levels and steady reclaiming of lost ground. Price is now trading back above short term resistance and showing signs of strength on each dip. As long as BTC continues to print higher lows, this developing structure leans bullish and supports the idea that the market has transitioned from liquidation-driven selling into accumulation. Overall, this is a constructive follow through and reinforces the idea that the recent dump was a reset rather than a breakdown. The chart is behaving well. Bulls have momentum building.
BTC Showing Bullish Structure After the Dump - Dec 2 Update
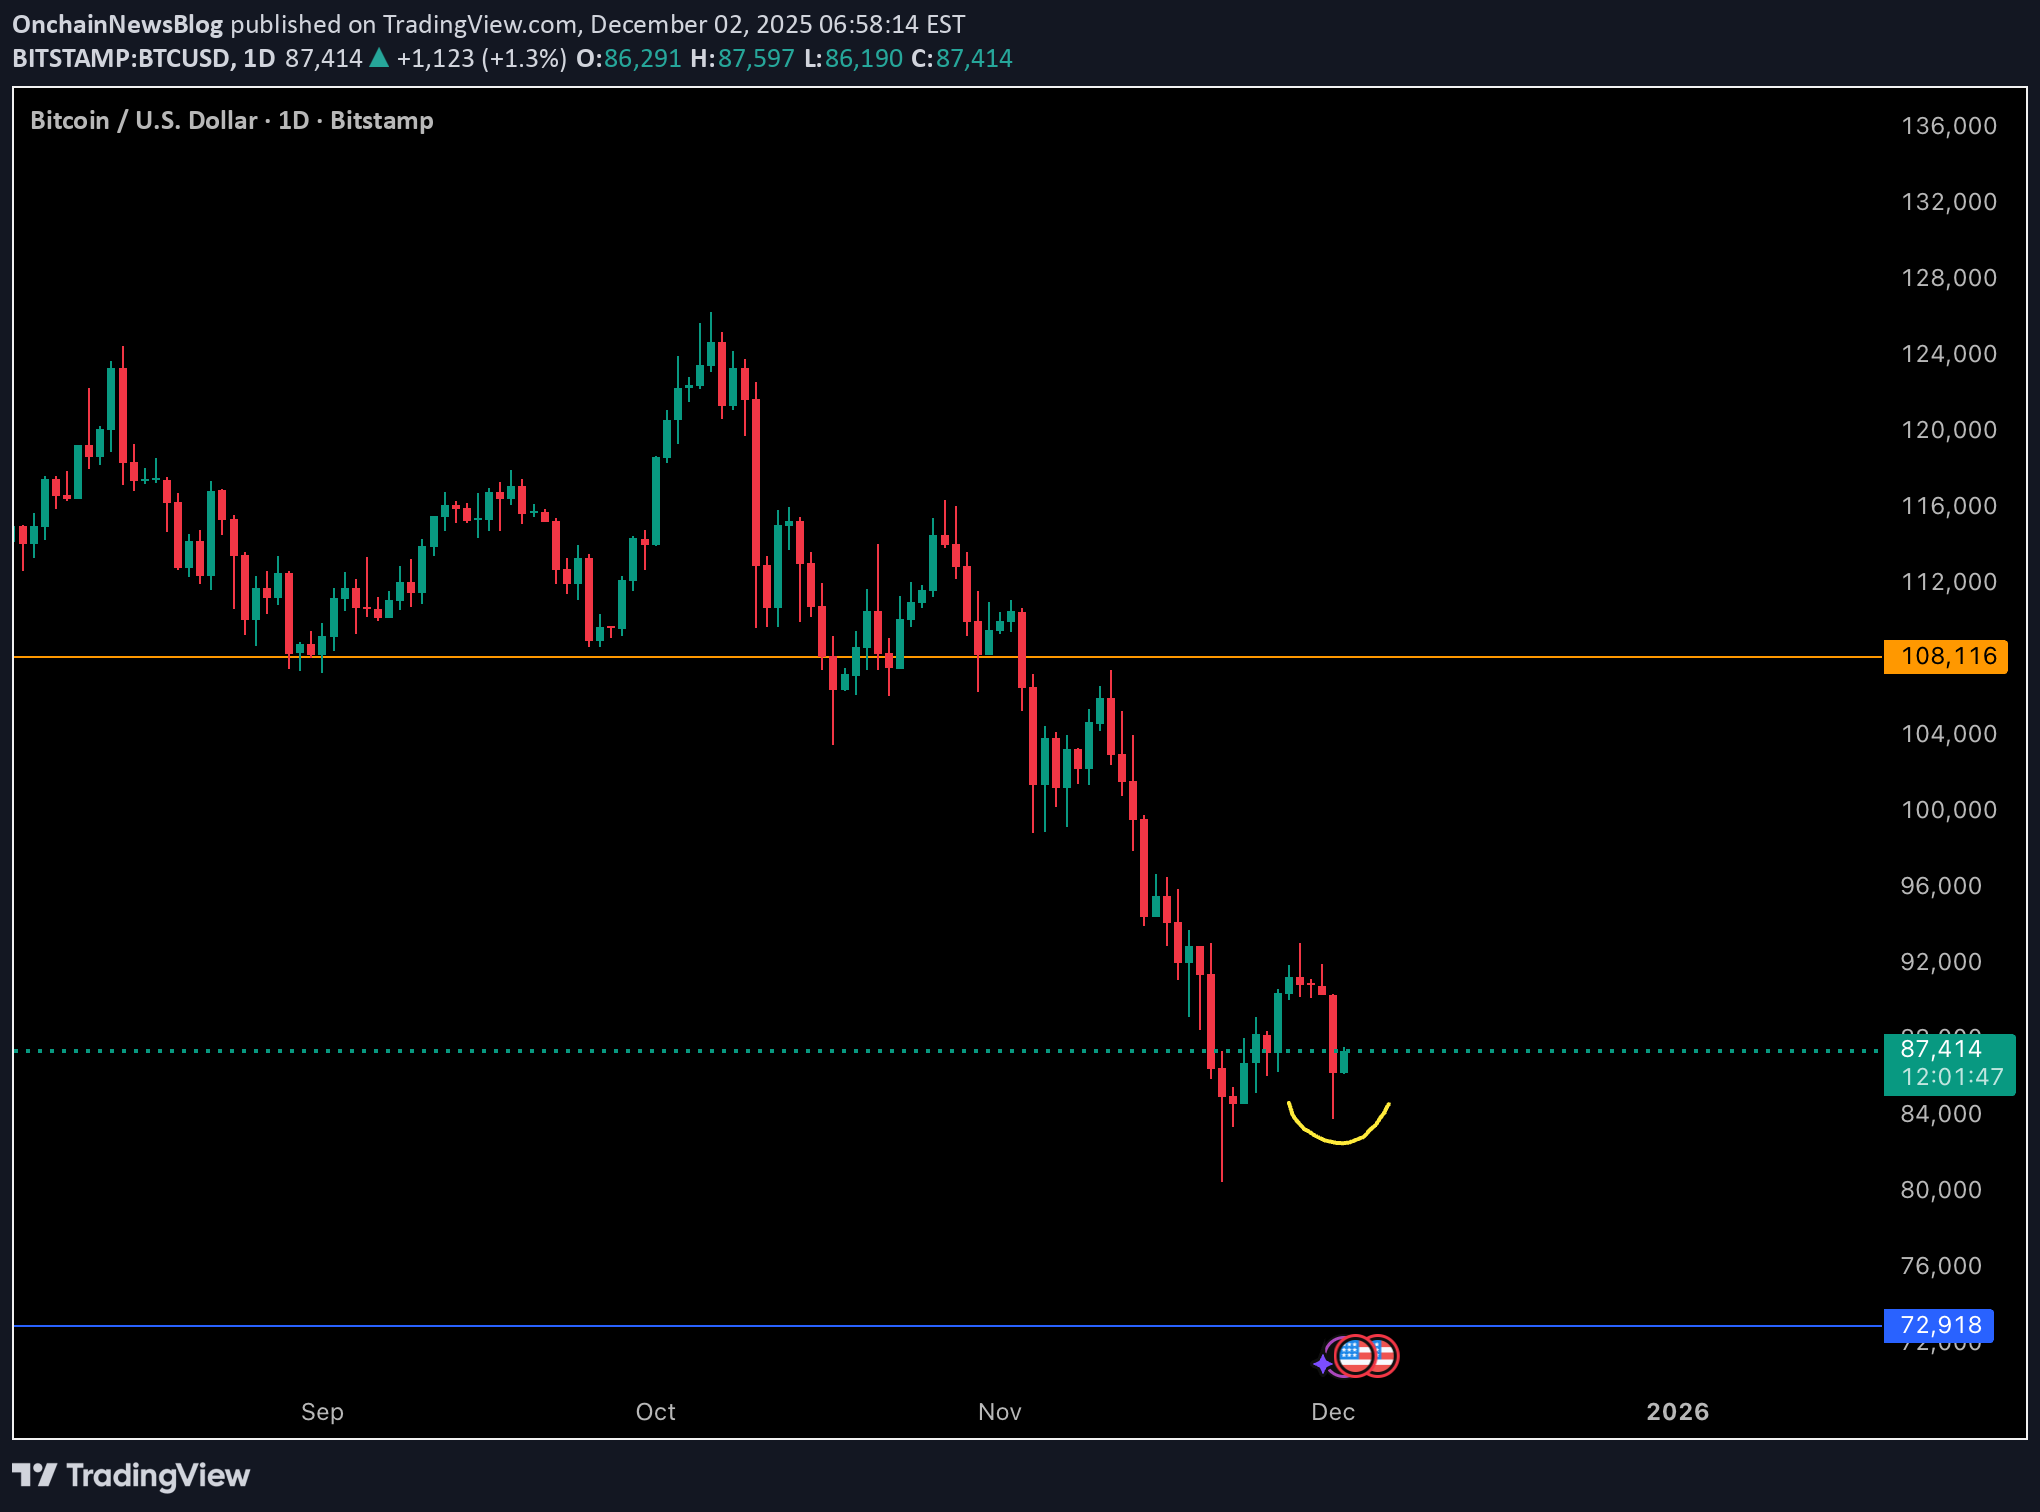
BTC’s latest reaction is quietly strong and more bullish than it may look at first glance. After the sharp drop, price immediately found demand and has now put in a clear higher low relative to the recent capitulation wick. That yellow-curved region on the chart highlights a key shift in behavior: sellers pushed hard, but buyers stepped in earlier than before, defending higher levels and preventing a retest of the prior lows. This is the first meaningful sign of structure forming after weeks of one-sided downside. A higher low is often the earliest signal that the market is transitioning from liquidation-driven selling into accumulation. It shows that bidders are becoming more aggressive, absorbing supply before it can revisit deeper support. On top of that, BTC is holding above the local support band that previously acted as resistance. Flipping that area into support and then defending it is a strong indication of emerging strength. The current reaction has less volatility, fewer long wicks, and more controlled candles, which typically points to absorption rather than panic. While the trend hasn’t fully reversed yet, this kind of price behavior is how bottoms and mid-cycle resets form. BTC is starting to build a constructive base, and the market is showing the first bullish structural clue it has printed in a few days.
BTC Dip Resilience: A Healthy Pullback Inside Structure - Dec 1
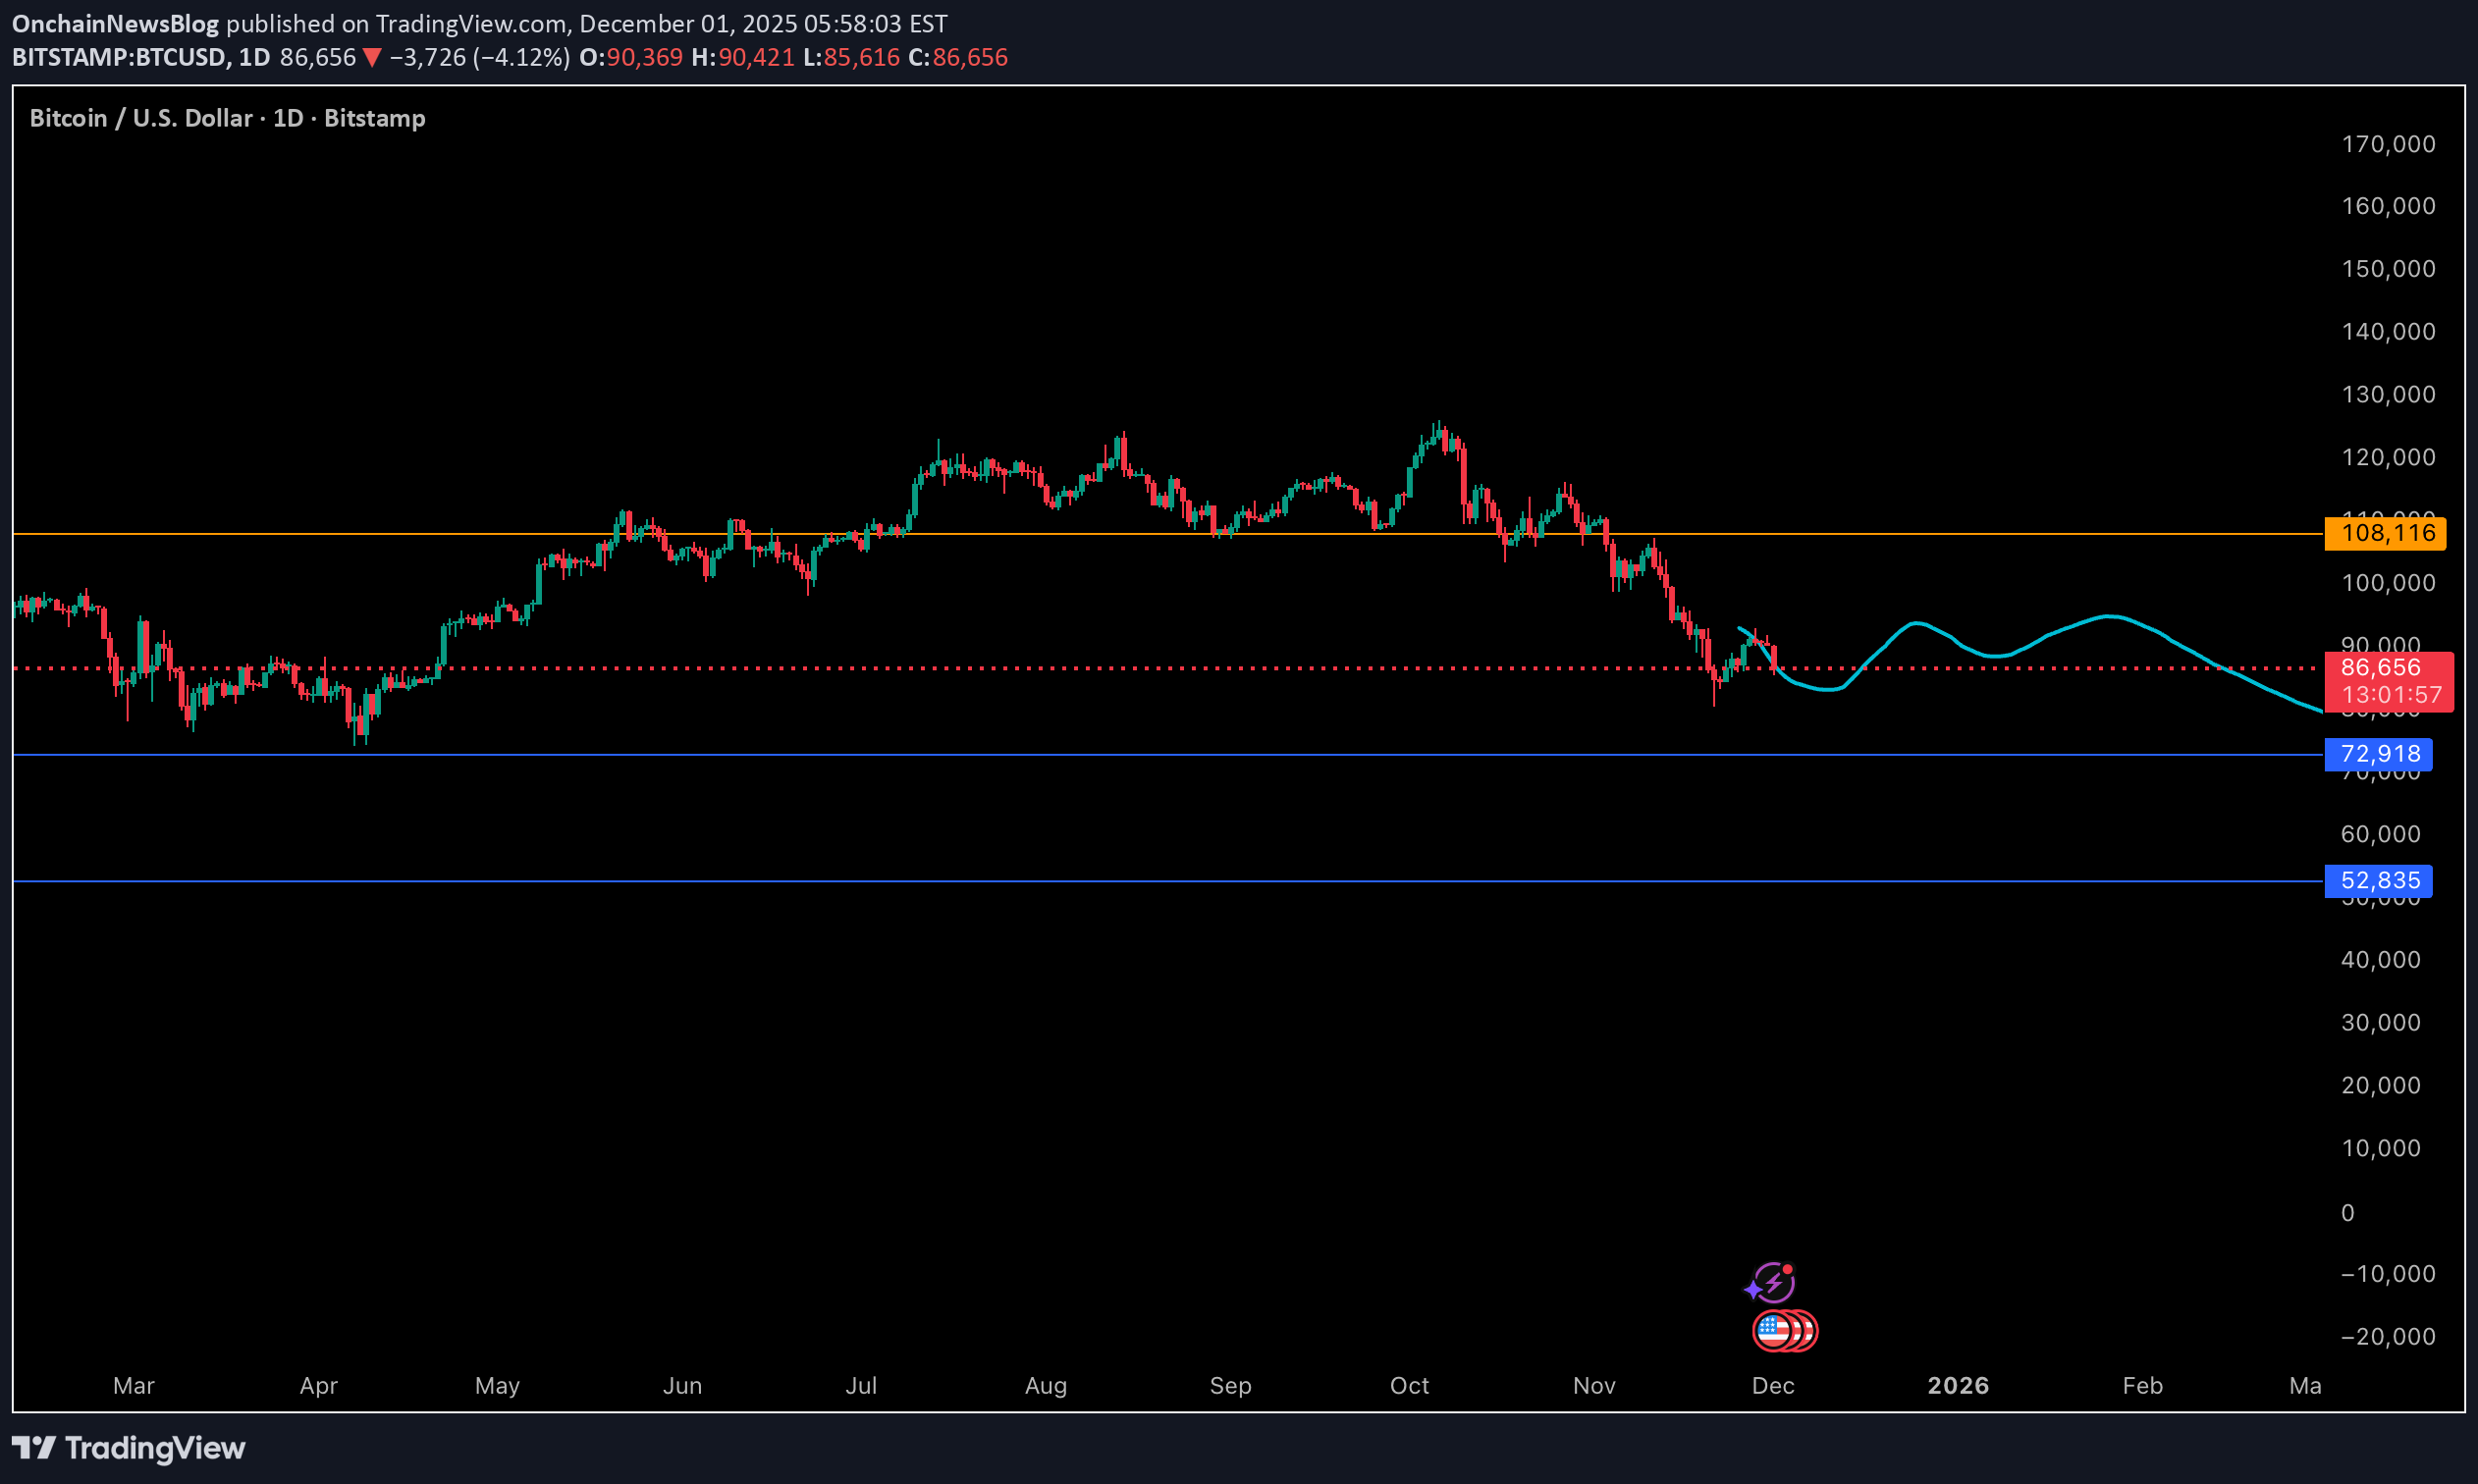
BTC is dipping again today, but the price action remains orderly and far from bearish breakdown territory. Despite the volatility, BTC continues to hold above the previous cluster of local lows, preserving its higher timeframe structure. More importantly, price is still sitting comfortably within a key support band that has acted as a demand pocket throughout this entire consolidation phase. The market has not shown any signs of structural damage. Sellers pushed into support, but so far there has been no follow-through or momentum shift that would indicate trend exhaustion. Instead, the reaction looks controlled, with buyers stepping in each time price revisits this region. This kind of behavior usually reflects absorption rather than weakness. In the bigger picture, this is the type of pullback you expect during a mid-cycle correction: sharp enough to unsettle sentiment, yet technically intact and anchored by strong underlying demand. Until we see a break beneath those prior lows, the path of least resistance remains upward. Overall, the chart still leans bullish. The current dip is behaving like a constructive reset, not the start of a deeper unwind.
BTCUSD 1W - My Thoughts Going into Dec 1 2025 Week
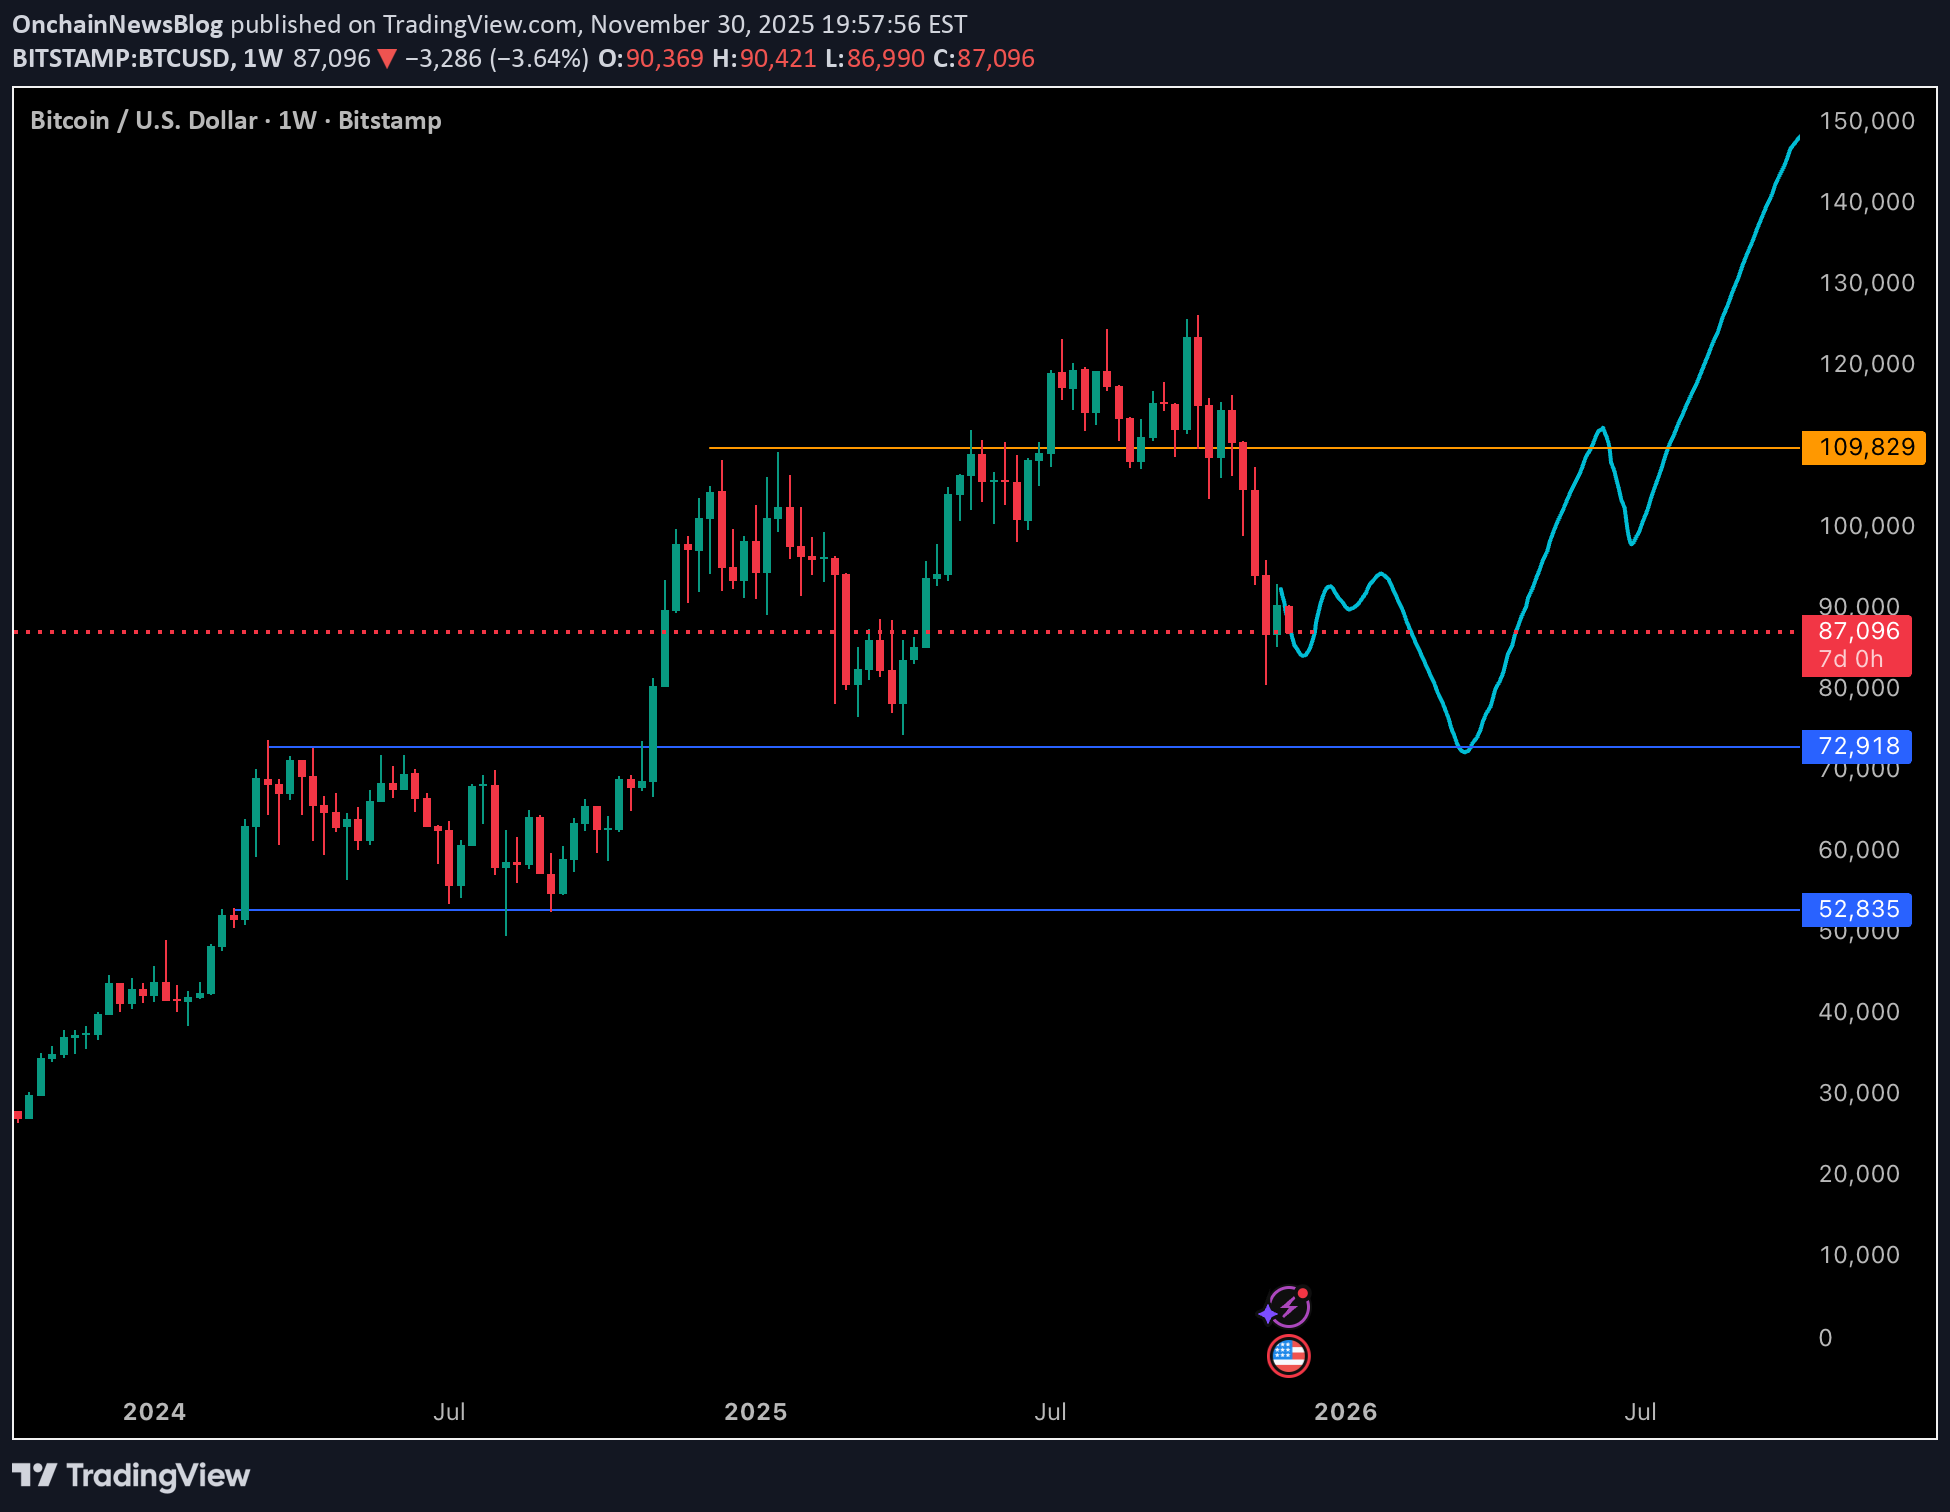
BTC heads into the first week of December in a clear corrective phase, with price likely to remain choppy as it digests the recent downside move. The mid-80k zone is acting as an interim equilibrium, but the broader structure still favors a deeper liquidity sweep toward the 70k-73k support band before any meaningful trend re-acceleration. Volatility should remain elevated, and the market is positioned to shake out weak hands during this chop. Structurally, pullbacks into key supports continue to define the higher timeframe trend, while sellers are losing momentum on each leg lower.
ZEC Update - My thoughts heading into Nov 29 2025 Weekend
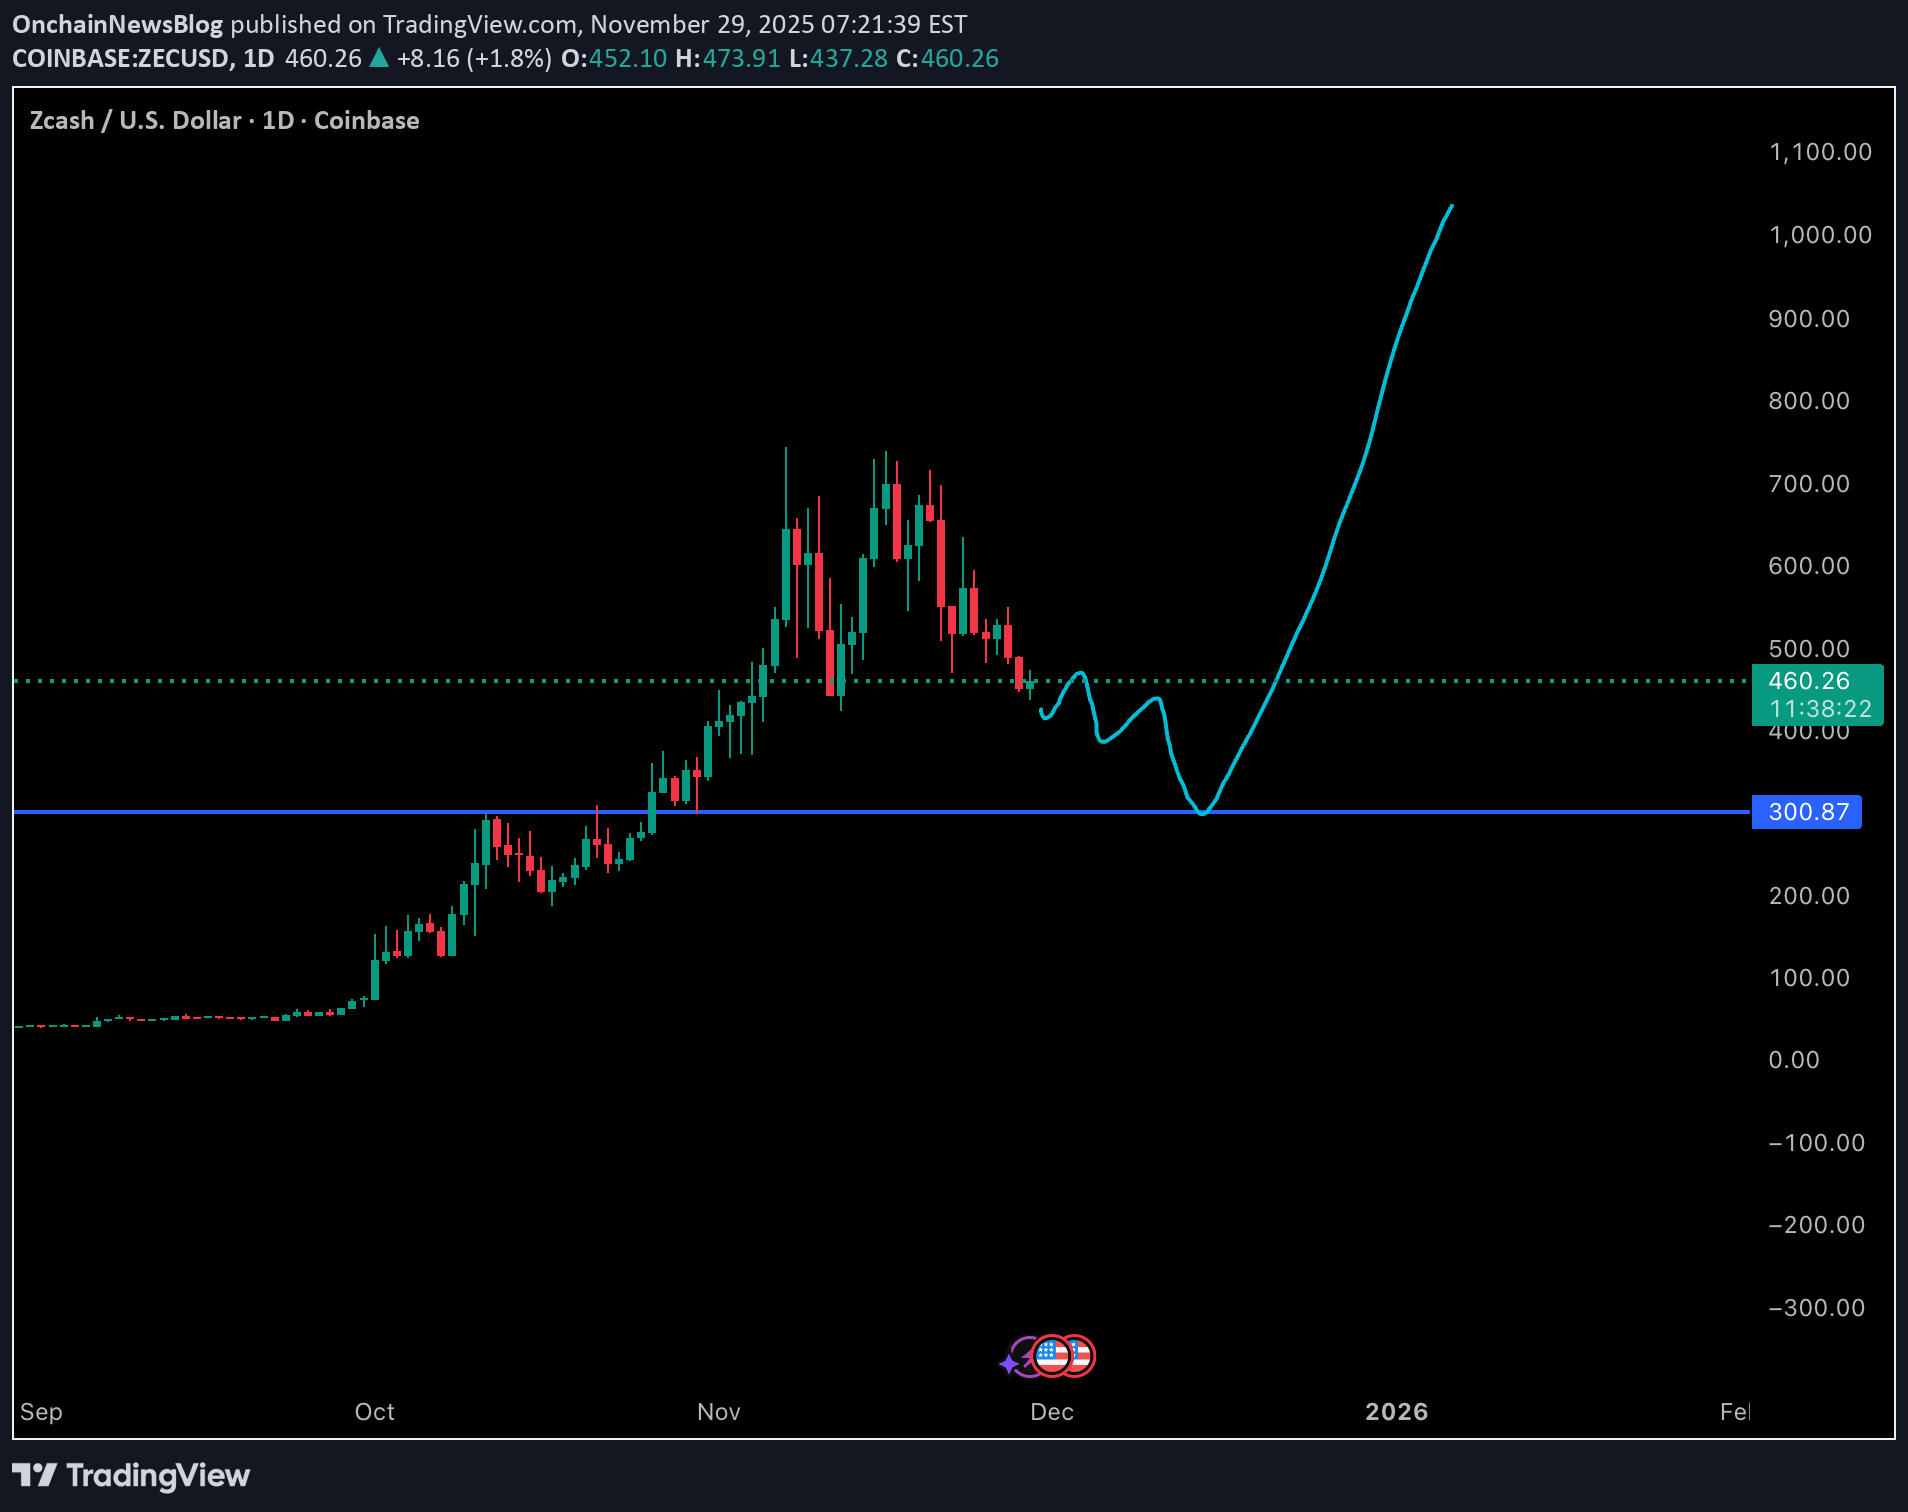
ZEC is grinding lower with momentum still favoring sellers. The structure is cleanly pointing toward the 300 zone, which lines up as the next high conviction support. Until price tags that level, ZEC likely keeps lagging and chopping in a controlled bleed. A reaction or base is most probable only once that 300 level is tested, where a stronger bounce could finally develop.
SOL UPDATE: My thoughts going into the Nov 28 2025 Weekend
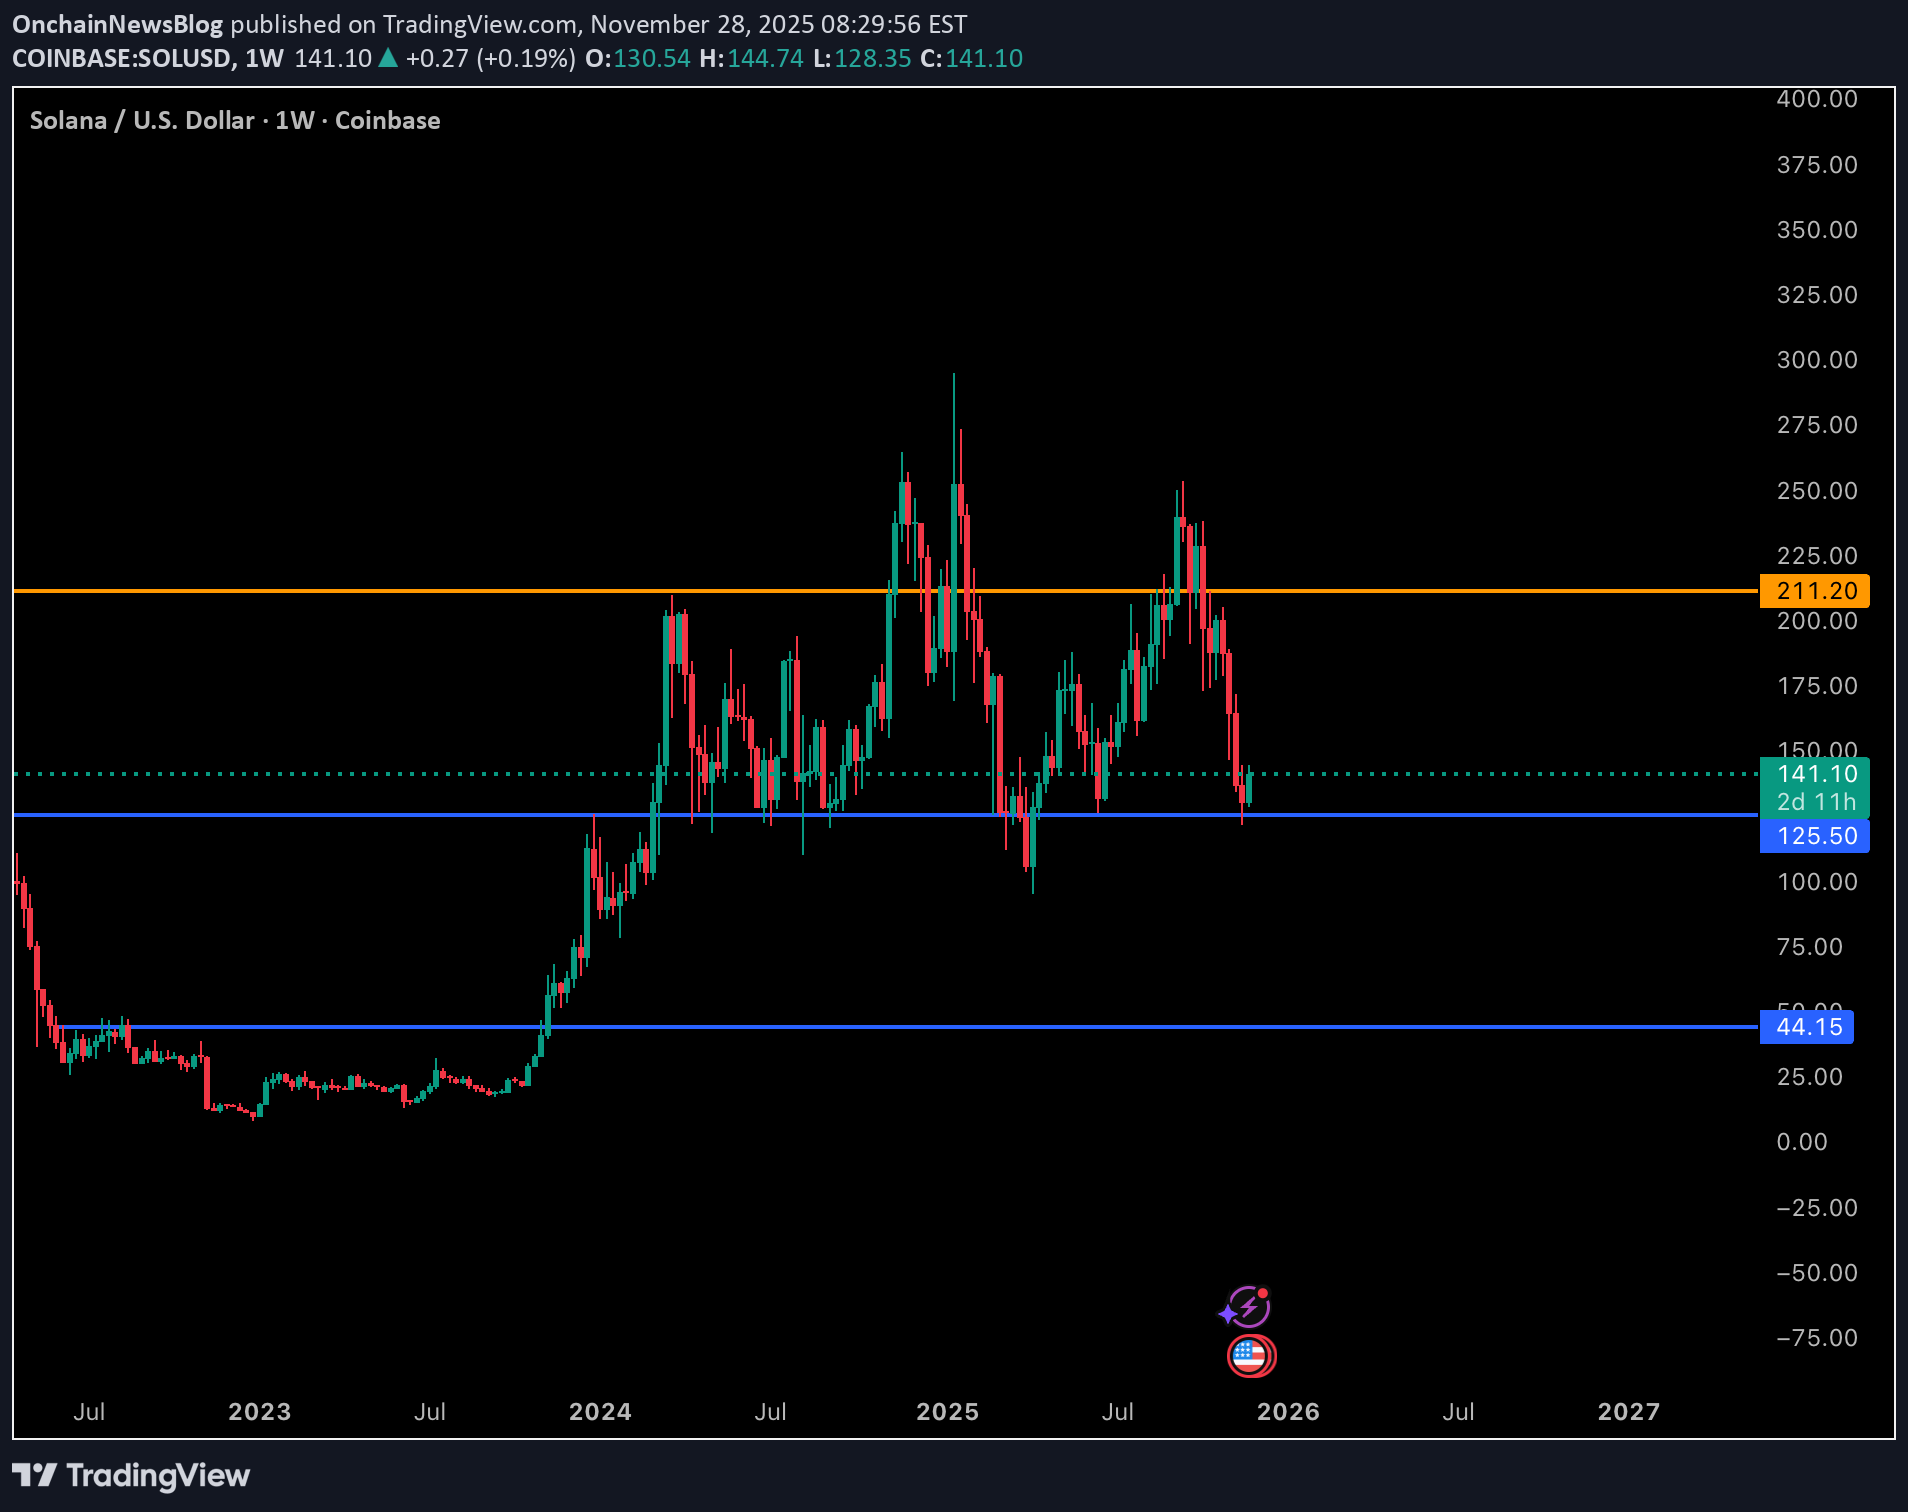
SOL is showing a solid reaction off the 125 support zone, which has been a major weekly level throughout this entire range. As long as buyers defend this area, SOL can attempt a bounce back toward the mid-140s and potentially re-test the 170 region. Still a choppy, range-bound structure overall, but this is the exact spot bulls needed to step in.
BNB Weekly Chart Analysis - My thoughts Nov 26 2025
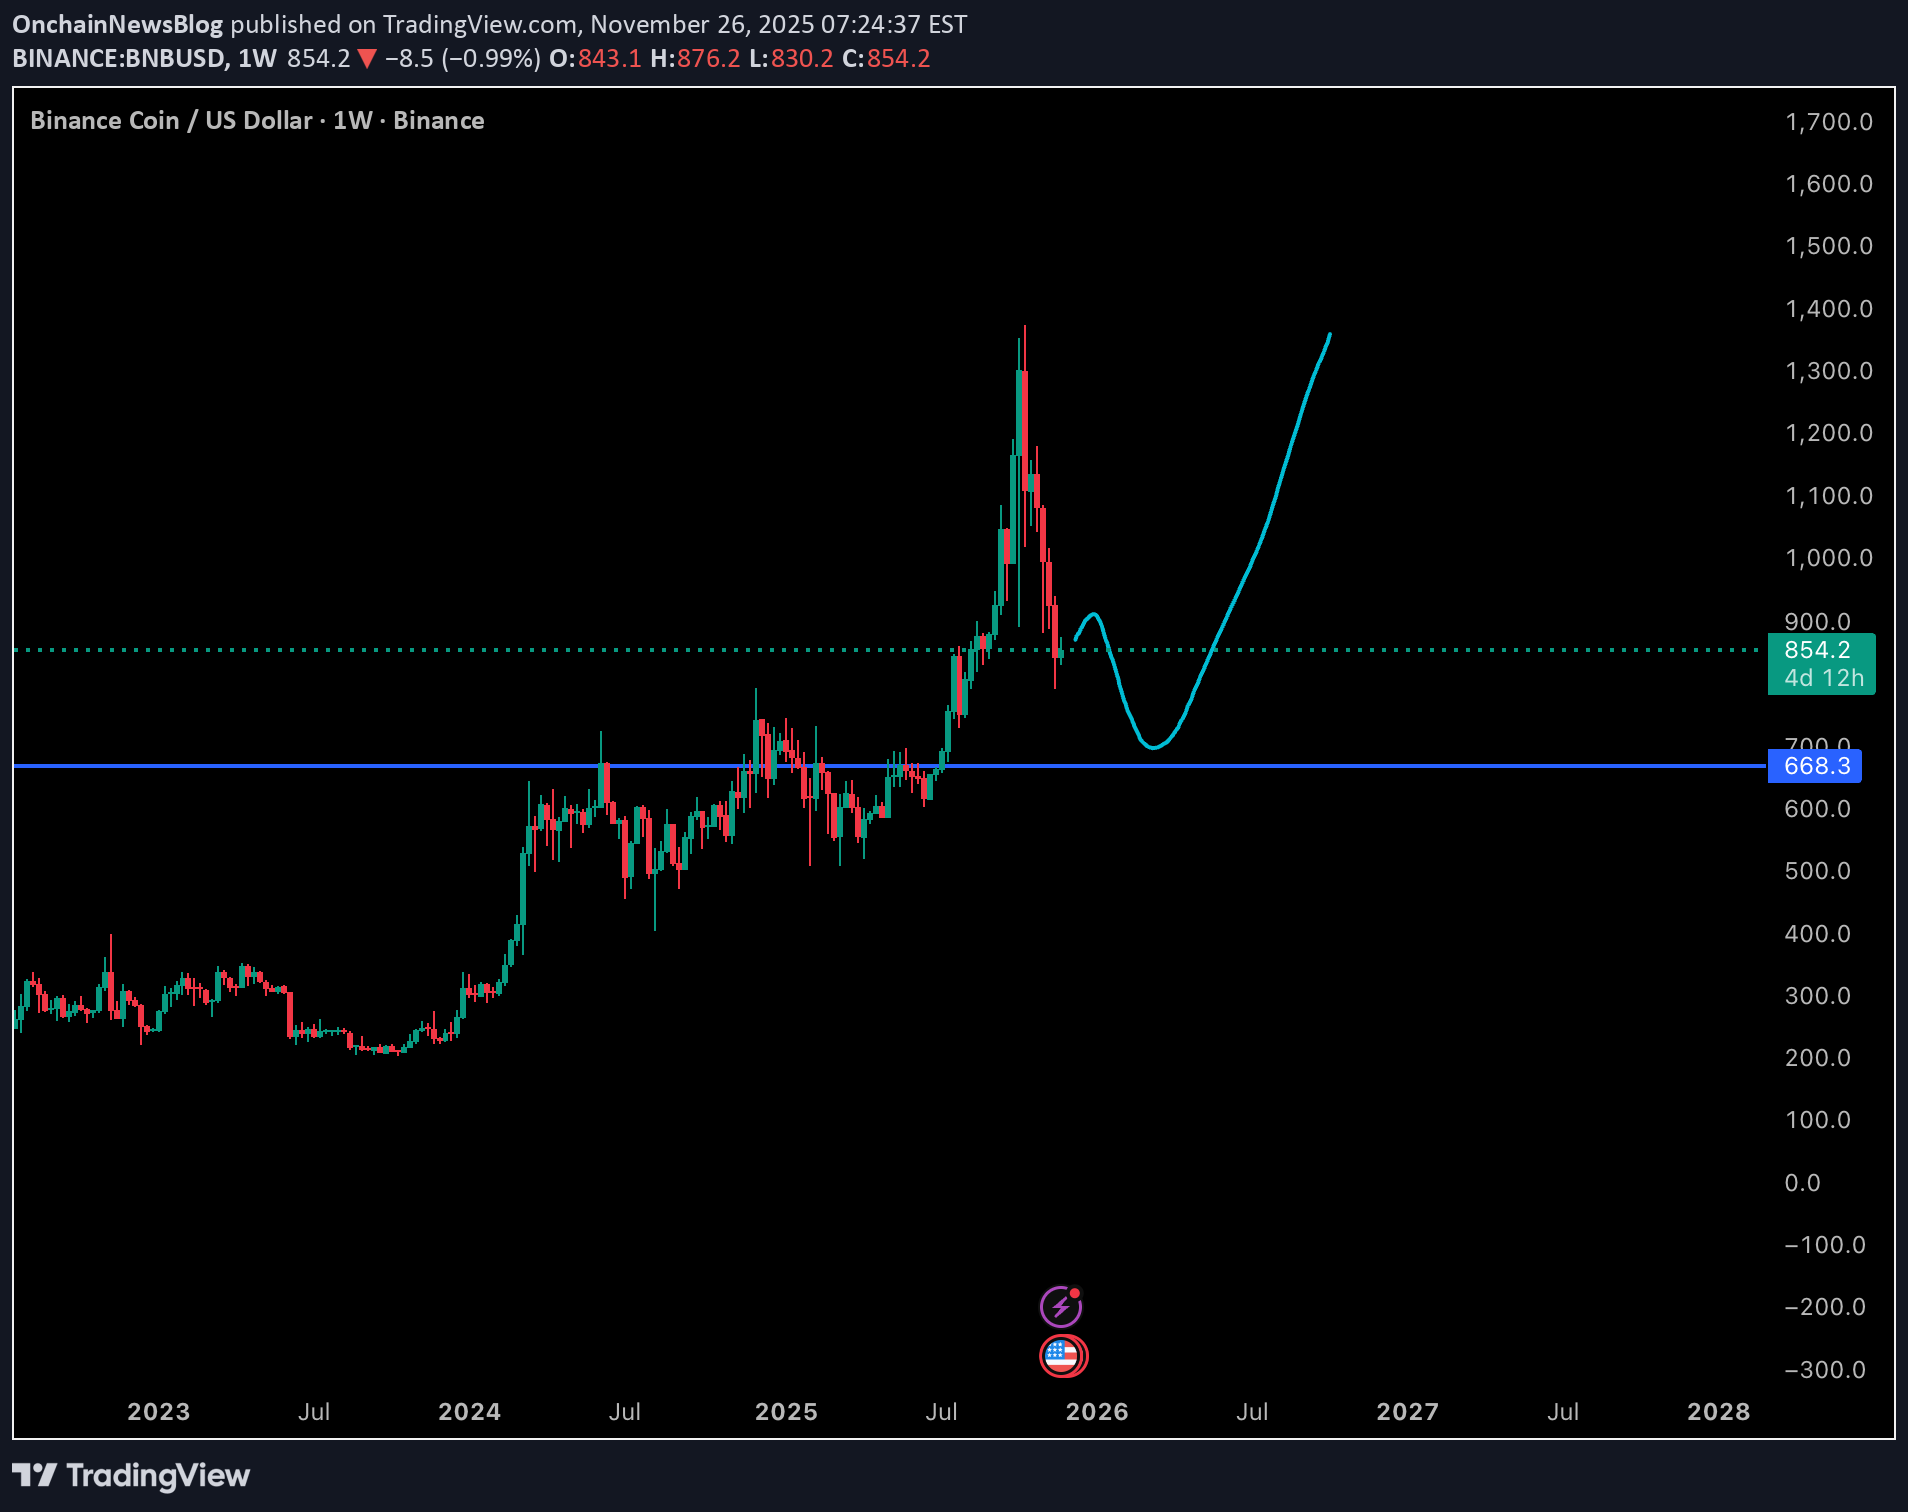
1. Structure After the Blowoff Top BNB has clearly broken its parabolic structure. The rejection wick near the 1500 zone and the sustained multi-week sell pressure indicate the trend has shifted into corrective mode. Momentum has cooled, and candles are now printing lower highs and lower lows on the weekly timeframe. The key technical zones are: - Dotted line around ~900 - former breakout region that has now flipped into potential resistance. - Blue zone at ~665-670 - major multi-year support that previously acted as a long accumulation ceiling before the breakout. This is the logical place for a deeper corrective sweep. - The teal path is consistent with how large caps often correct after vertical expansions. 2. Short Term Outlook: Expect Further Pullback BNB is holding above 850 for now, but structure suggests it is not done correcting. Signals: - Weekly momentum turning down without bullish divergence. - Lower timeframe bounces lacking volume confirmation. - The distance between price and the weekly moving averages is still wide, which usually compresses through either time or further downside. If the broader market stays choppy or if BTC consolidates lower, BNB may continue grinding down toward the 665-700 liquidity zone. 3. Medium Term: The 665-670 Reaccumulation Zone This is the most important area on the chart and the one reflected in the teal scenario. Reasons this zone matters: - It was the final breakout base before BNB pushed toward 1500. - Strong historical volume built here during 2024-2025. - It represents a clean structural retest on the weekly timeframe. A flush into this region followed by stabilization would create a constructive environment for a new accumulation range. Signs of bullish reversal to watch for: - Long lower wicks into 665. - Momentum flattening on weekly MACD and RSI. - Reclaim of the 900 level after basing. 4. Longer Term Path: Reclaiming 900 Opens the Trend Back Up If the market recovers into next year and BNB can reclaim the dotted 900 resistance, the teal path becomes increasingly probable. That would show demand returning, and from there a gradual rebuild toward 1200-1400 is structurally consistent. BNB tends to lag BTC initially in recovery phases, then accelerate once liquidity rotates into exchange tokens. In strong market conditions, BNB has historically been capable of impulsive catch-up moves. 5. Bearish Scenario If BNB loses the 665 level on a weekly close: - Market structure breaks decisively. - A slide into the 500-550 zone becomes possible. - It would likely require broader market weakness or exchange-specific risk events. Not the base case, but important to acknowledge. Summary The teal scenario is a reasonable higher-timeframe projection: a deeper dip into the 665 support zone, a multi-month basing structure, and then a recovery if macro conditions improve. The chart suggests the correction is not yet finished, but the larger structure still allows for a bullish continuation in 2025 if BNB holds its critical support and broader market strength returns.
Disclaimer
Any content and materials included in Finbeet's website and official communication channels are a compilation of personal opinions and analyses and are not binding. They do not constitute any recommendation for buying, selling, entering or exiting the stock market and cryptocurrency market. Also, all news and analyses included in the website and channels are merely republished information from official and unofficial domestic and foreign sources, and it is obvious that users of the said content are responsible for following up and ensuring the authenticity and accuracy of the materials. Therefore, while disclaiming responsibility, it is declared that the responsibility for any decision-making, action, and potential profit and loss in the capital market and cryptocurrency market lies with the trader.