
PyraTime
@t_PyraTime

What symbols does the trader recommend buying?
Purchase History
Trader Messages
Filter
Message Type
XRP/USDT 1H – Sacred Geometry Time Update (Nov 21, 2025)
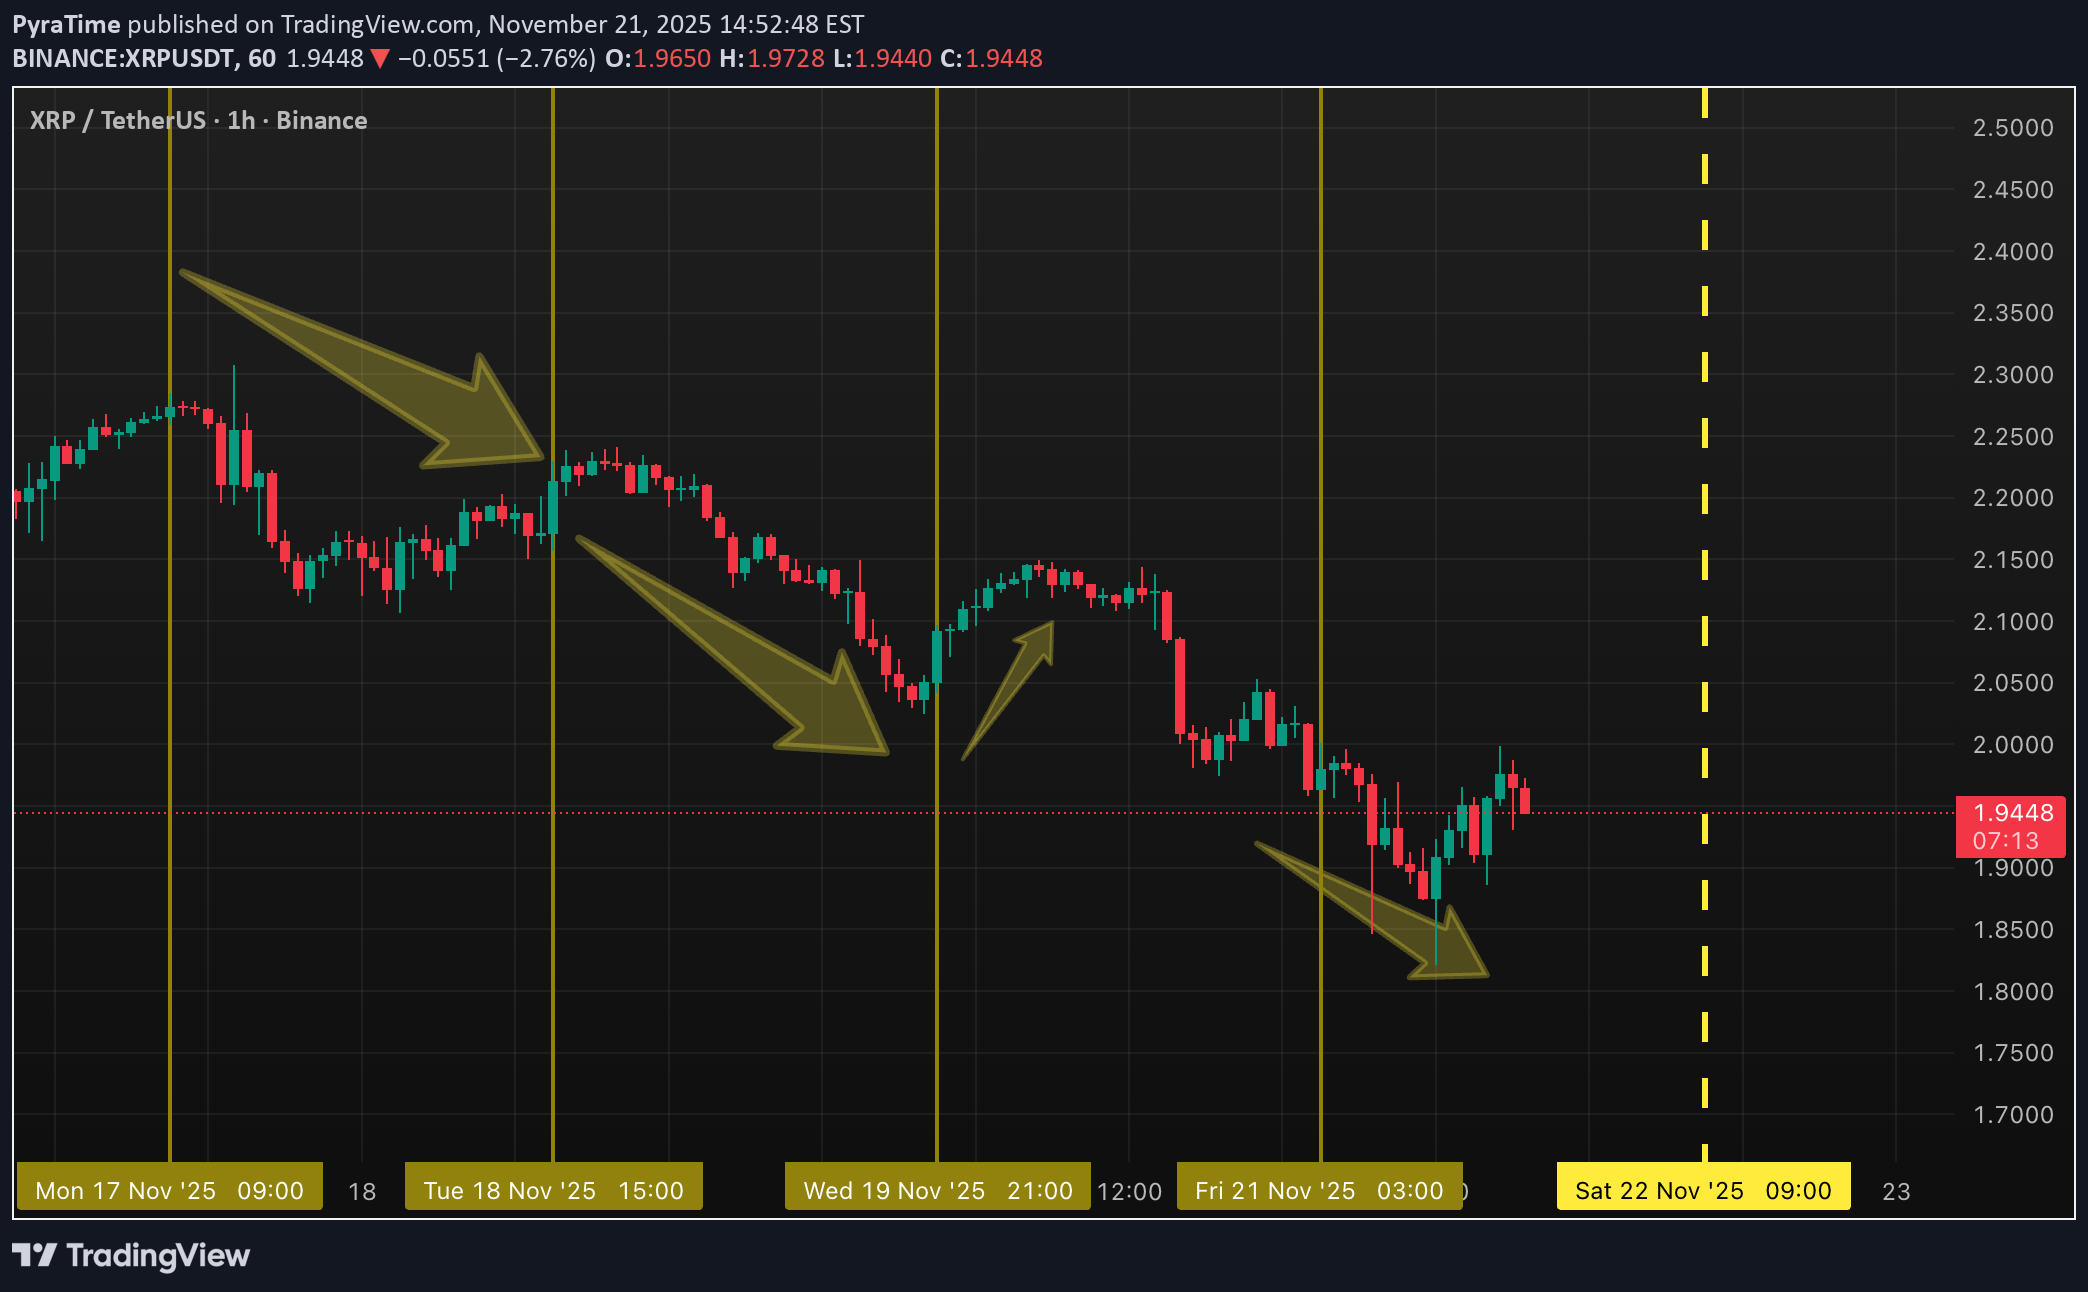
Current price: ~$1.95 Low today: $1.82 The last three visible reversals all landed exactly on the same forward-projected time grid (derived from one fixed ancient ratio – no repainting, no settings). The recent drop from ~$2.15 stopped dead on the most recent line and bounced hard. Next high-probability time window opens tomorrow: Sat 22 November – 09:00 UTC In oversold conditions like this (RSI <30, heavy selling exhaustion), these time confluences have repeatedly produced sharp reversals across XRP, BTC, Gold, ES, etc. Personal bias: watching for a potential snap-back long if we get a confirmed 1H close above $1.98 into that window. Targets if it triggers: $2.05 → $2.12 → $2.20 stretch Stop below today’s low. The trend is down. I'm not calling a bottom. I am saying that these lines have an amazing success rate at predicting reversals or acceleration points. Not financial advice – just sharing a geometric timing pattern that keeps lining up perfectly. Curious how one 4500-year-old constant can do this? Happy to explain in the comments. #XRP #Ripple #Gann #SacredGeometry #TradingView
XRP Reverses on Sacred Time – Watch Friday 03:00 UTC
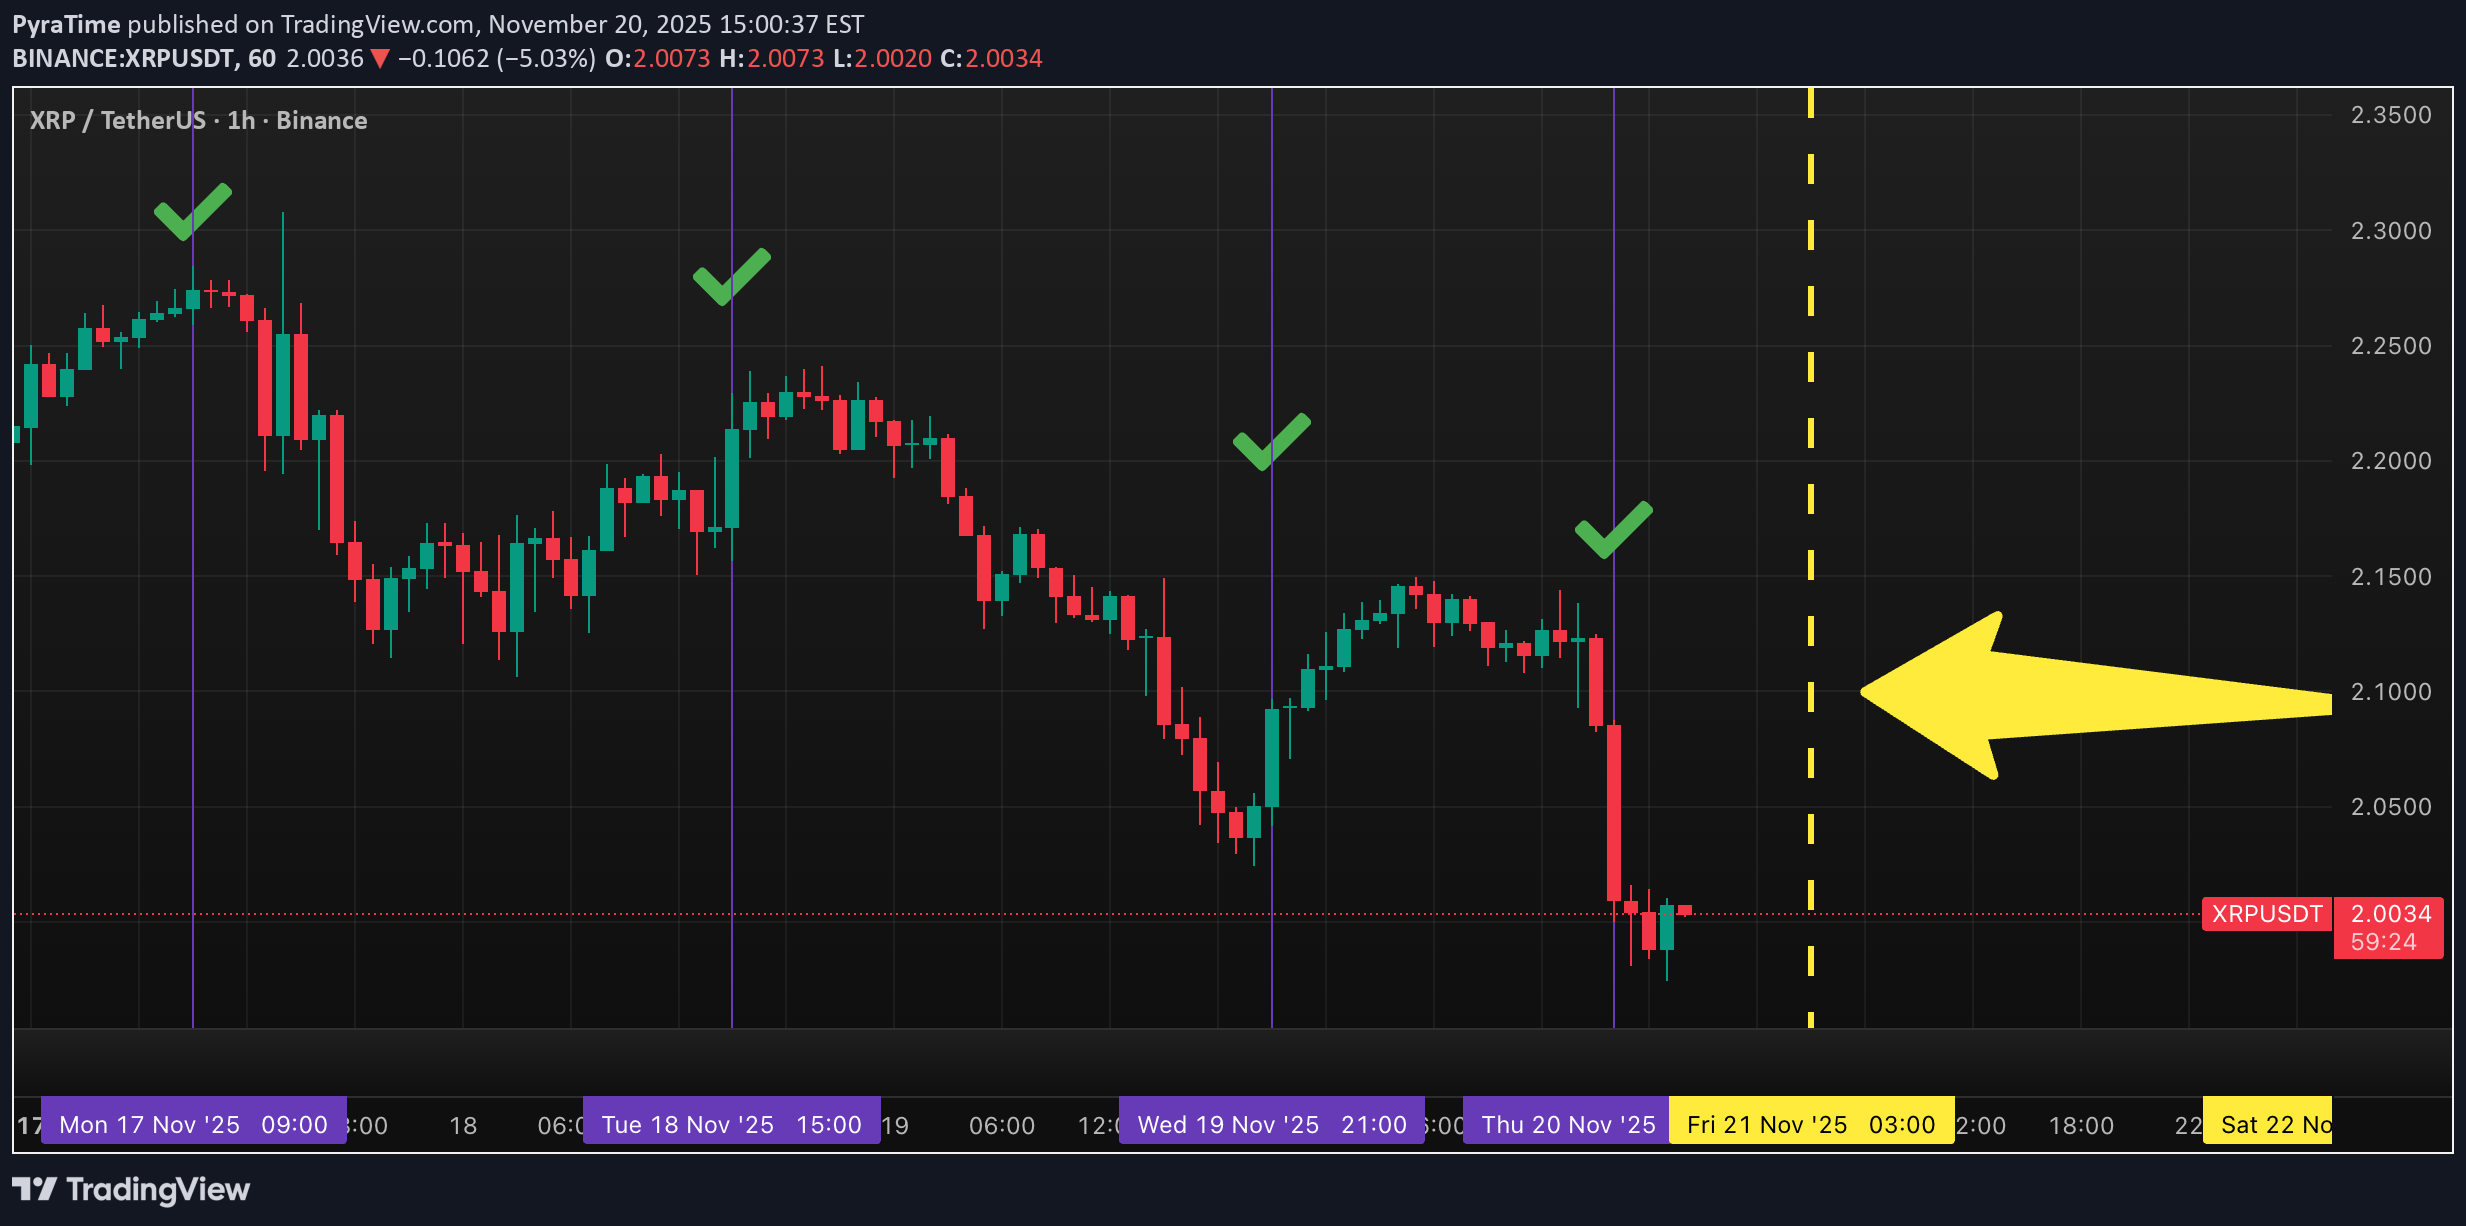
XRP/USDT 1H – Sacred Geometry Update (Nov 20, 2025) Current price: ~$2.007 (just wicked into the exact pre-calculated time window and reversed within minutes) What you’re seeing: - Anchor placed on the local high from Nov 17 - Forward-projected vertical lines come from one fixed geometric ratio measured directly from the Great Pyramid (no repainting, no optimization) - Every major swing since Nov 17 has respected these lines to the minute — tonight’s drop from $2.15 tagged the confluence zone perfectly and bounced hard Next high-probability pivot window (marked on my private grid): Friday, November 21 – 03:00 UTC (±2 hours) This is the next 1080-level hourly + daily overlap. In the current oversold environment (RSI 28, heavy selling pressure), these clusters have historically produced sharp reversals or brief accelerations followed by stronger turns. My personal plan for transparency: - Watching for a confirmed 1H close above $2.05 after 01:00 UTC tomorrow - Targets: $2.12 → $2.18 → $2.25 - Stop below today’s low (~$1.98) The actual lines are generated by a private invite-only tool (PyraTime™) that simply decodes ancient geometry into modern time. Same constant works on BTC, Gold, ES, Forex — no changes needed. Happy to explain the math or show more live examples in the comments. Not financial advice — just sharing a pattern that keeps repeating with eerie precision. #XRP #Ripple #Gann #SacredGeometry #TradingViewAnother exact Great Pyramid pivot point precisely hit. The market clearly accelerated down through the killzone at the 3:00am bar. The PyraTime indicator is the most accurate indicator we have ever used.The Real Killzone: Discipline The complex long setup was a phantom, never confirmed. But the underlying indicator hit the precise Killzone/Entry we identified. The system worked. The greatest difficulty in trading has shifted: It's no longer timing the market—it’s waiting for the entry and executing with discipline. Patience is the new alpha. Guided by the geometry of the Great Pyramid.
BTC pivot hits EXACTLY on the Pyramid line — next one Fri 3:00am
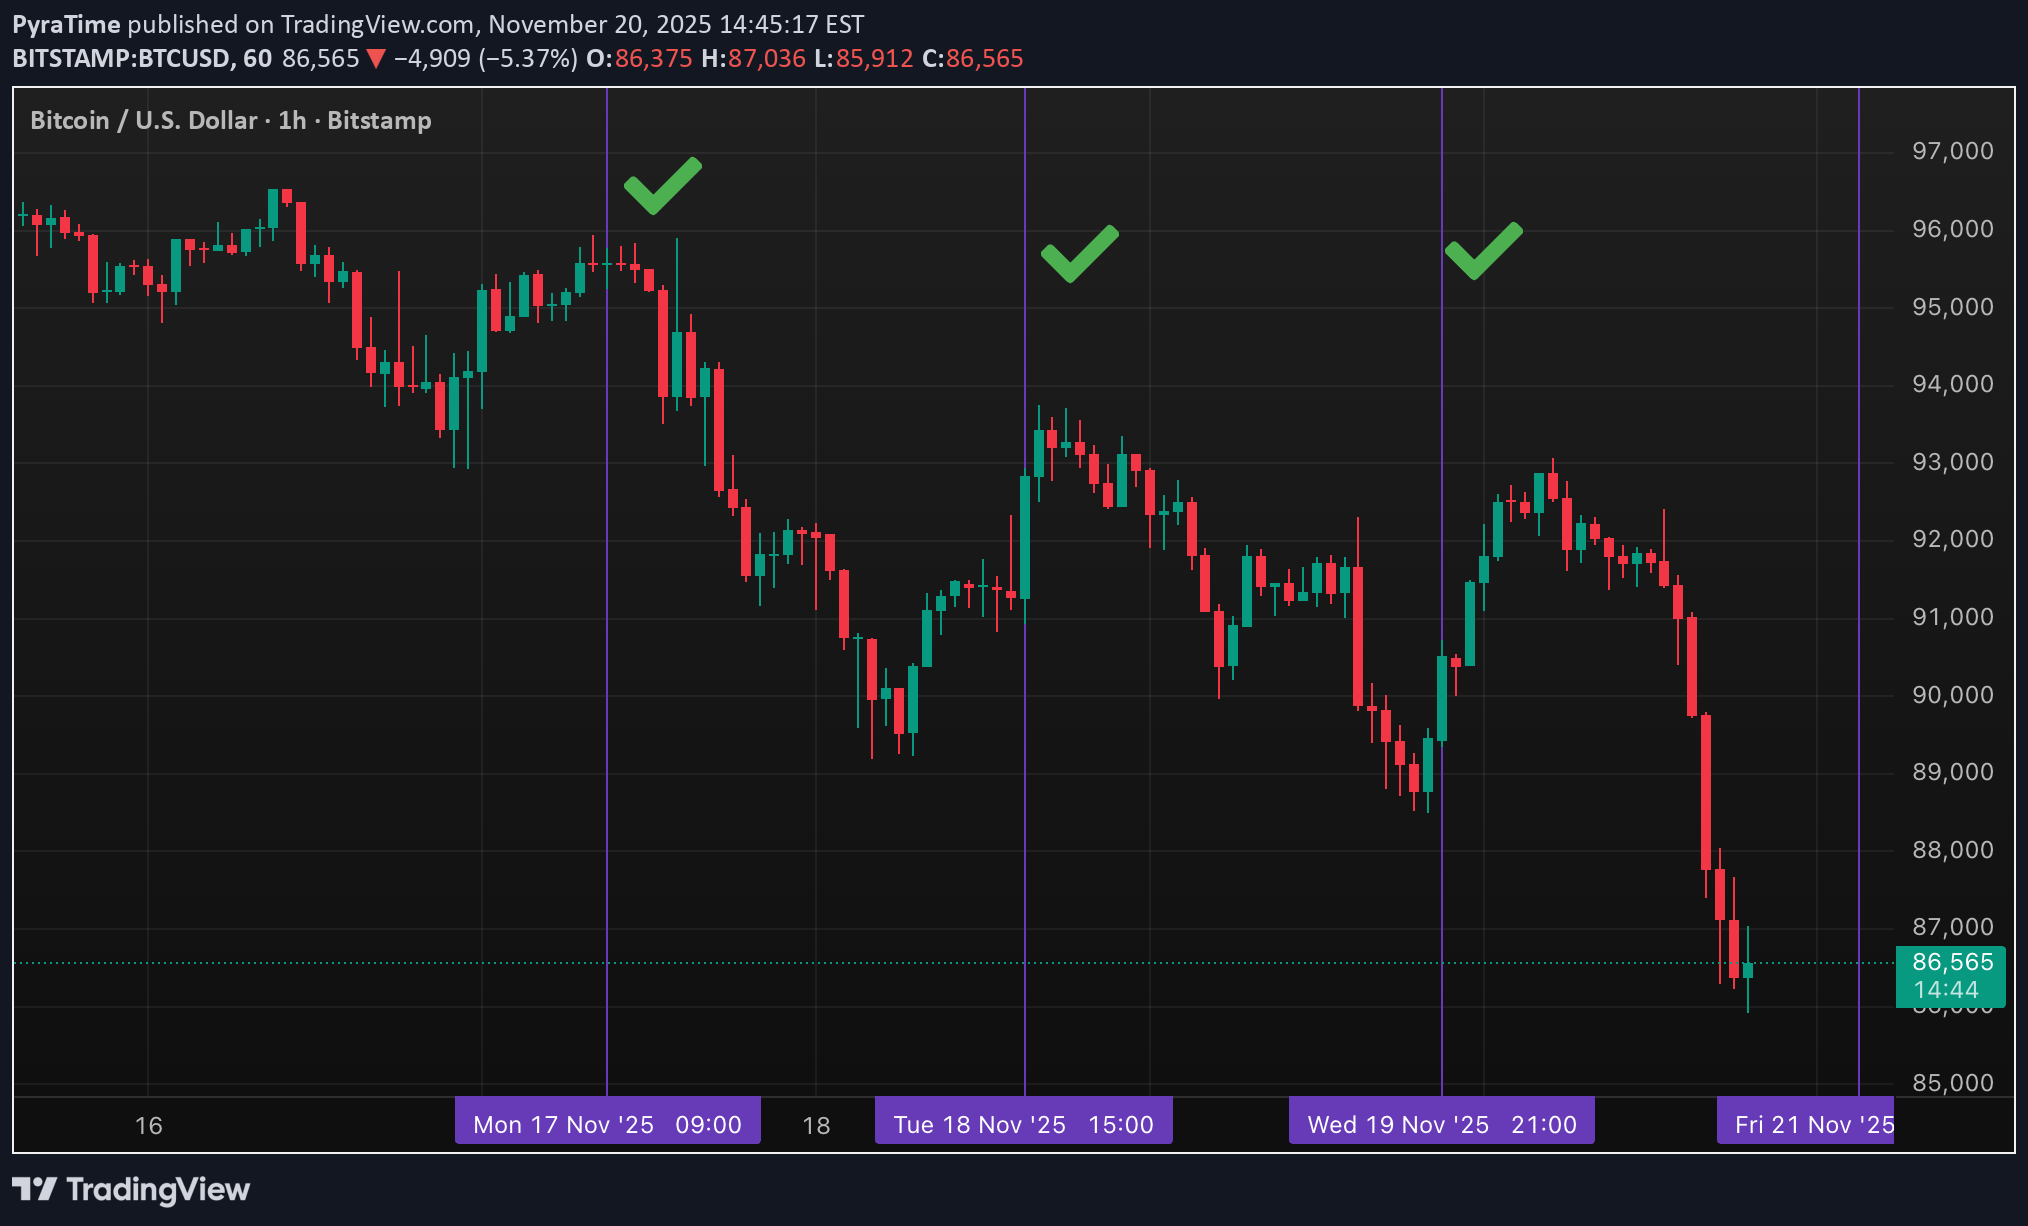
[i BTC/USD 1H – Pyramid Time Grid Update (November 20, 2025) Current price: ~$86,734 (just tagged the 930h + 960h confluence zone) What you’re seeing: - Anchor placed on the October 2025 all-time high - Forward-projected vertical lines are derived from a single fixed geometric ratio measured directly from the Great Pyramid (no optimization, no repainting) - Every major 1H reversal since Nov 18 has landed within minutes of a line — including tonight’s drop that stopped dead on the 930h/960h cluster and immediately reversed Next high-probability pivot window: Friday, November 21 – 03:00 UTC (±2 hours) This is the next 1080-level confluence (hourly + daily sequence overlap). Historically, when price arrives inside these windows, we see either: → Sharp reversal (most common in oversold conditions like now), or → Brief acceleration followed by an even stronger turn on the following line Trade idea I’m personally watching (for transparency): - Long entry on a confirmed 1H close above $87,500 after 01:00 UTC - Initial targets: $90,000 → $92,000 → $94,000 - Stop below today’s low ($86,000) - Risk: 1% of account Not financial advice — just sharing an unusually clean geometric setup that keeps repeating across BTC, XRP, Gold, ES, and Forex with the exact same constant. Curious how one ancient ratio can do this? Happy to explain the math in the comments. #Bitcoin #BTC #Gann #SacredGeometry #TradingViewThe Real Killzone: Discipline The long setup was a phantom, never confirmed. But the underlying indicator hit the precise Killzone/Entry we identified. The system worked. The greatest difficulty in trading has shifted: It's no longer timing the market—it’s waiting for the entry and executing with discipline. Patience is the new alpha. Guided by the geometry of the Great Pyramid.
Disclaimer
Any content and materials included in Finbeet's website and official communication channels are a compilation of personal opinions and analyses and are not binding. They do not constitute any recommendation for buying, selling, entering or exiting the stock market and cryptocurrency market. Also, all news and analyses included in the website and channels are merely republished information from official and unofficial domestic and foreign sources, and it is obvious that users of the said content are responsible for following up and ensuring the authenticity and accuracy of the materials. Therefore, while disclaiming responsibility, it is declared that the responsibility for any decision-making, action, and potential profit and loss in the capital market and cryptocurrency market lies with the trader.