
Sohaib_zafar007
@t_Sohaib_zafar007

What symbols does the trader recommend buying?
Purchase History
Trader Messages
Filter
Message Type
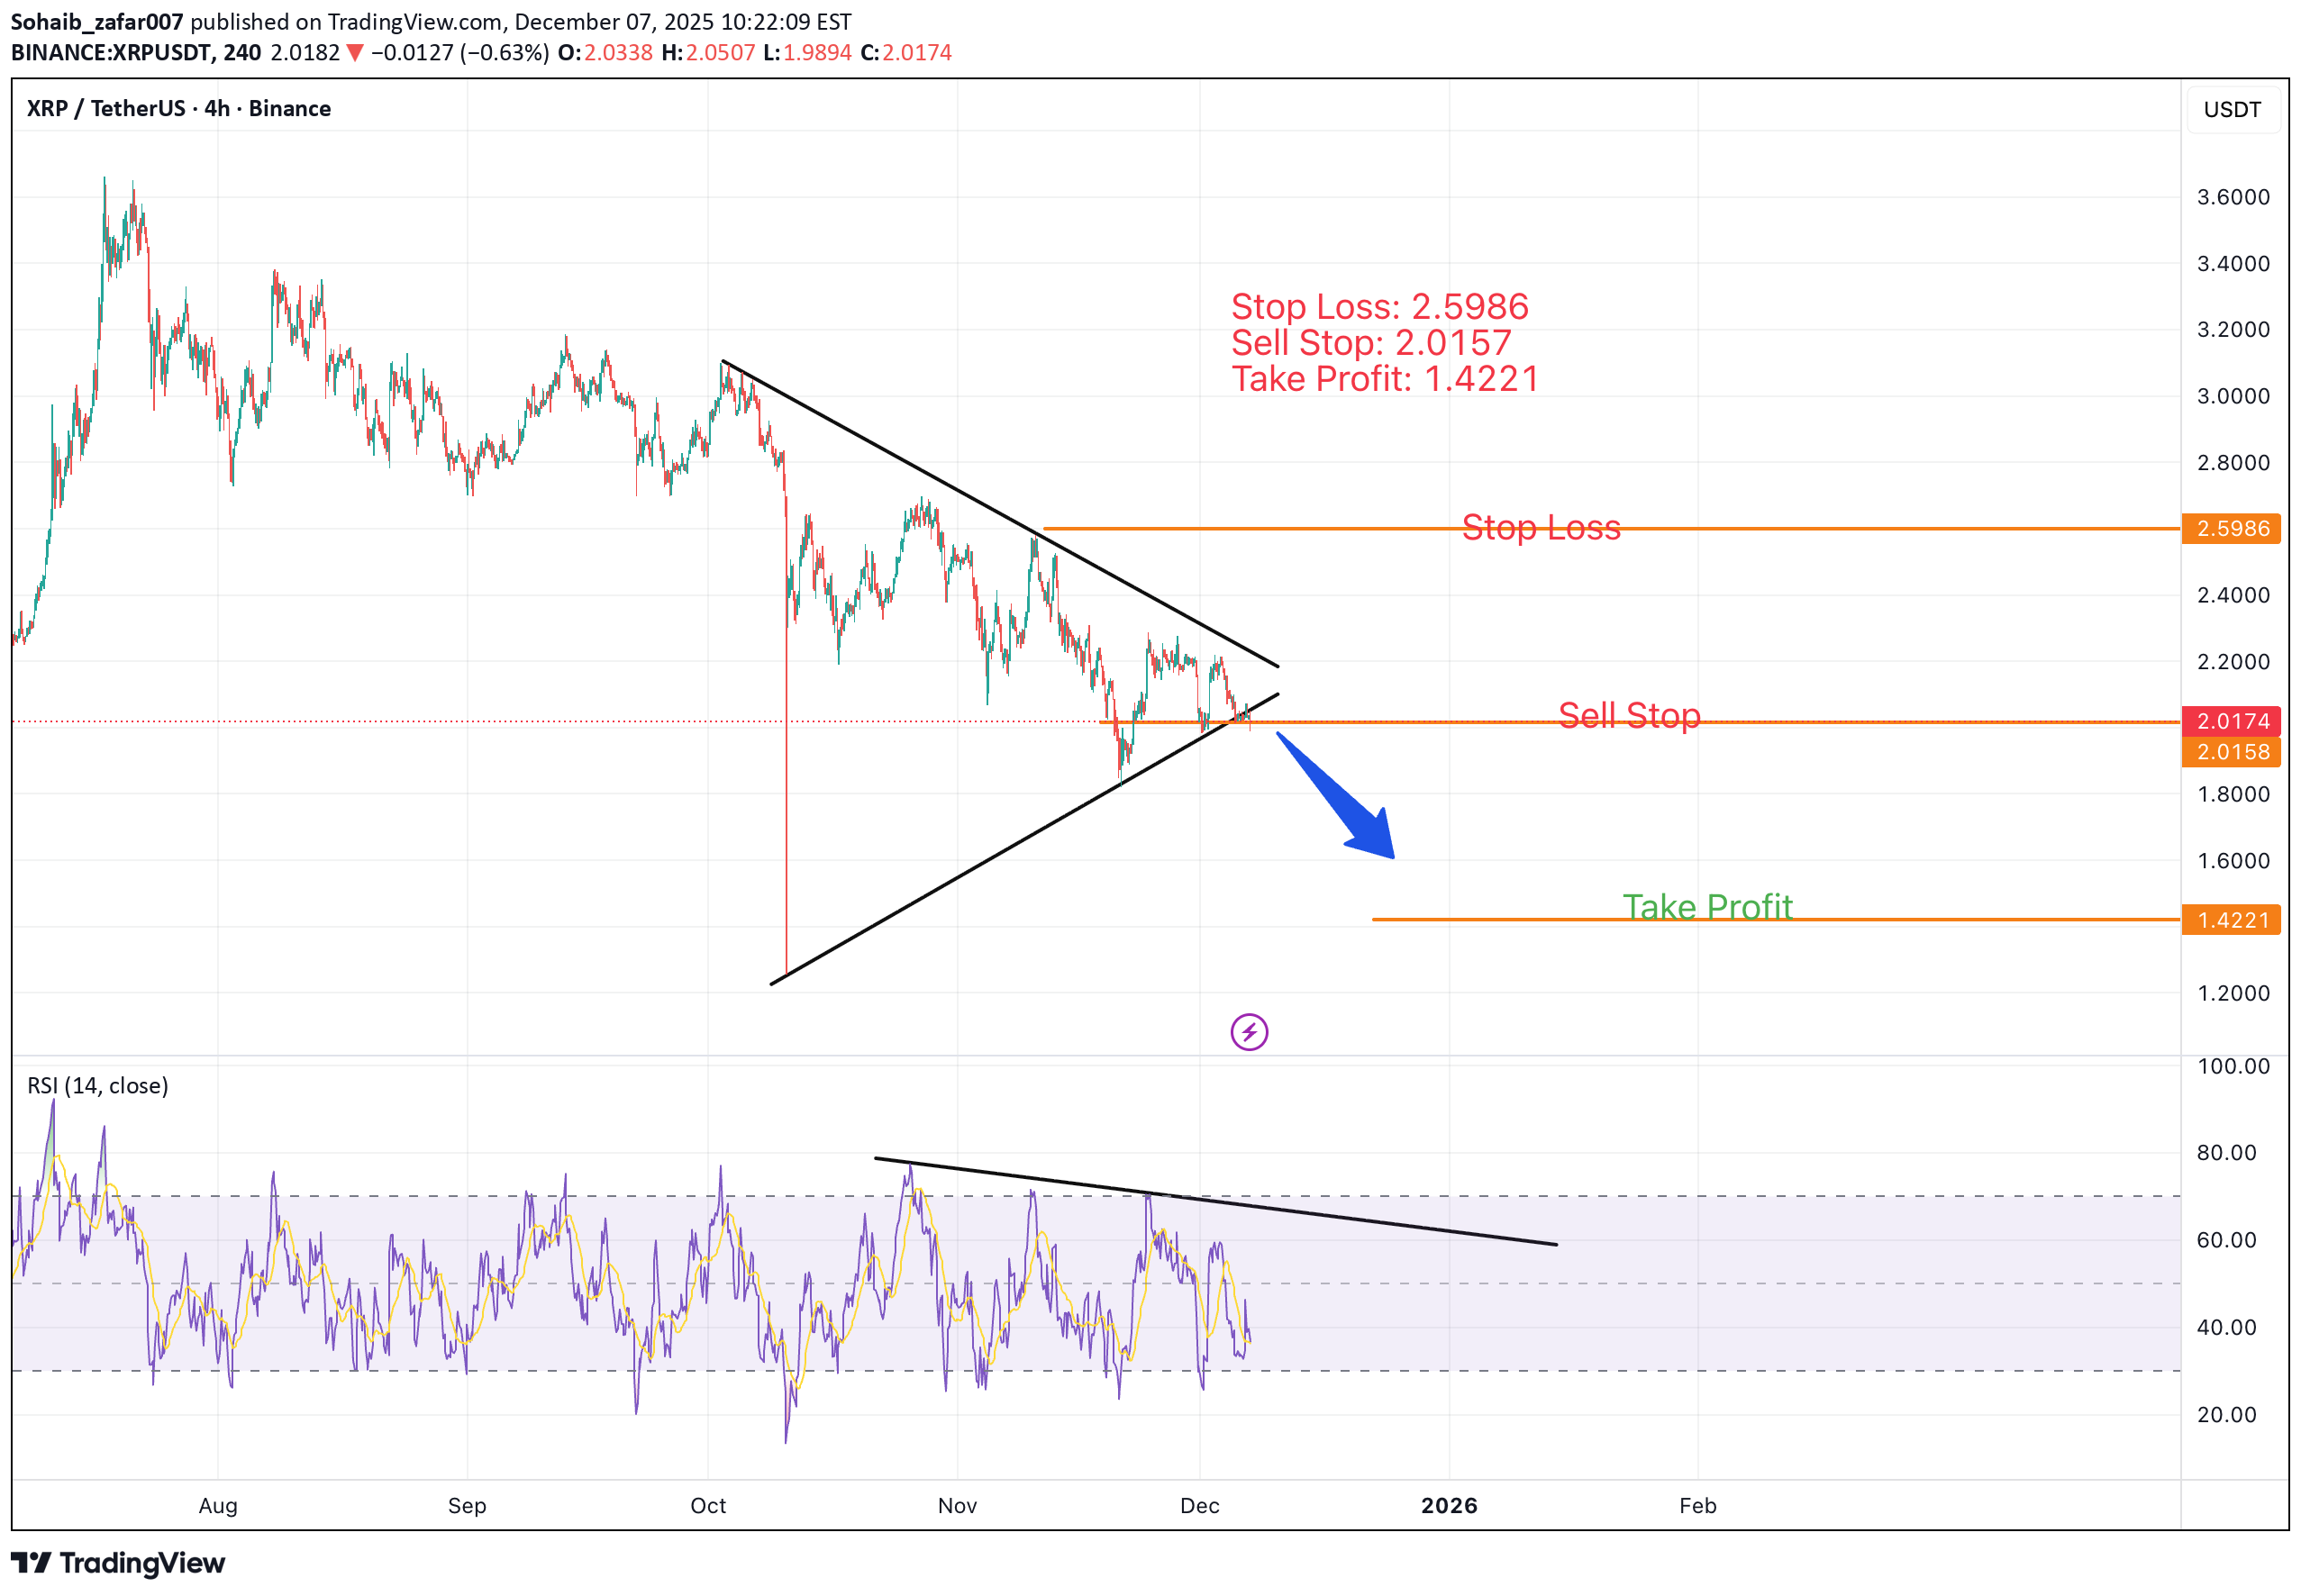
Stop-Loss: 2.5986 Sell Stop: 2.0157 Take Profit: 1.4221 The chart is forming a Symmetrical Triangle pattern. Once the price breaks below the sell-stop level, a bearish continuation is expected, potentially driving the price toward the take-profit target. ⚠️ Risk Management Reminder: Always protect your capital by setting a well-defined stop-loss and following disciplined risk management practices.
AVAX/USDT Chart Analysis 5-Dec-25
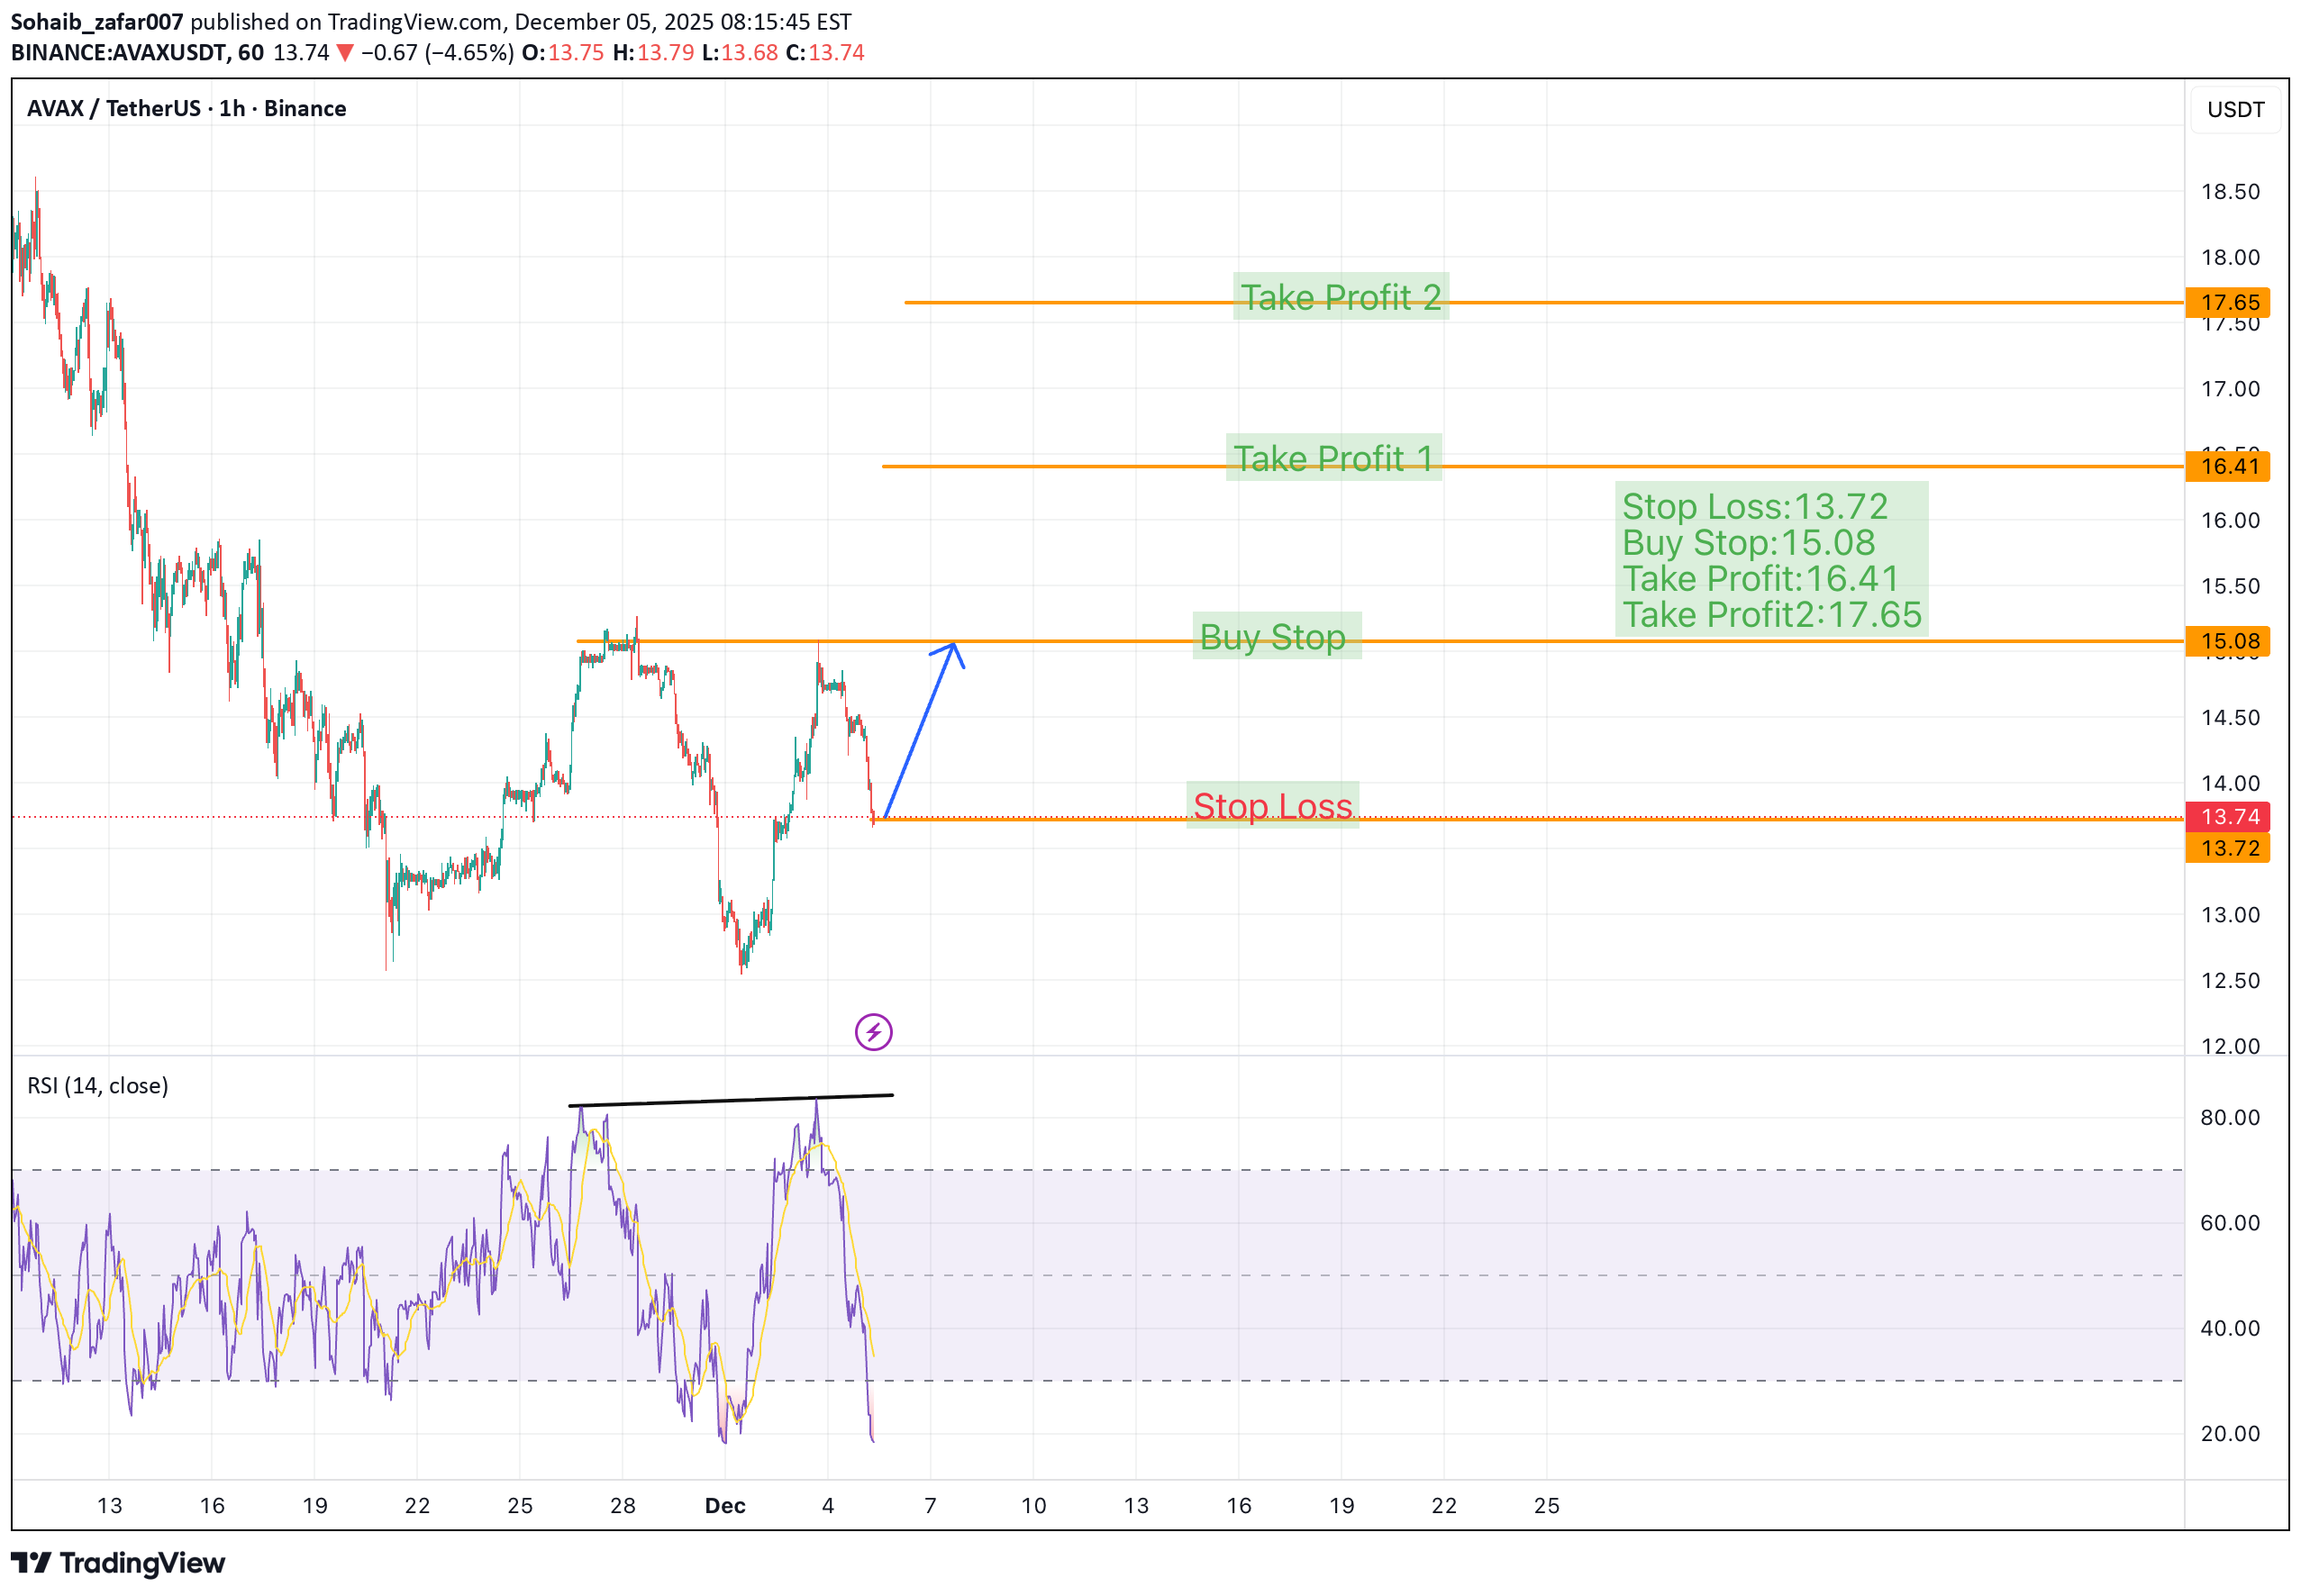
Stop Loss:13.72 Buy Stop:15.08 Take Profit:16.41 Take Profit2:17.65 In 1H Chart Pattern (Inverse Head and Shoulder) has been predicted if it hit the price tag of (15.08) then we can expect the price to hit (17.65). ⚠️ Always remember to protect your capital with a proper stop-loss and disciplined risk management.wait until the full head and shoulder is formed
XLM/USDT Chart Analysis 5-Dec-25
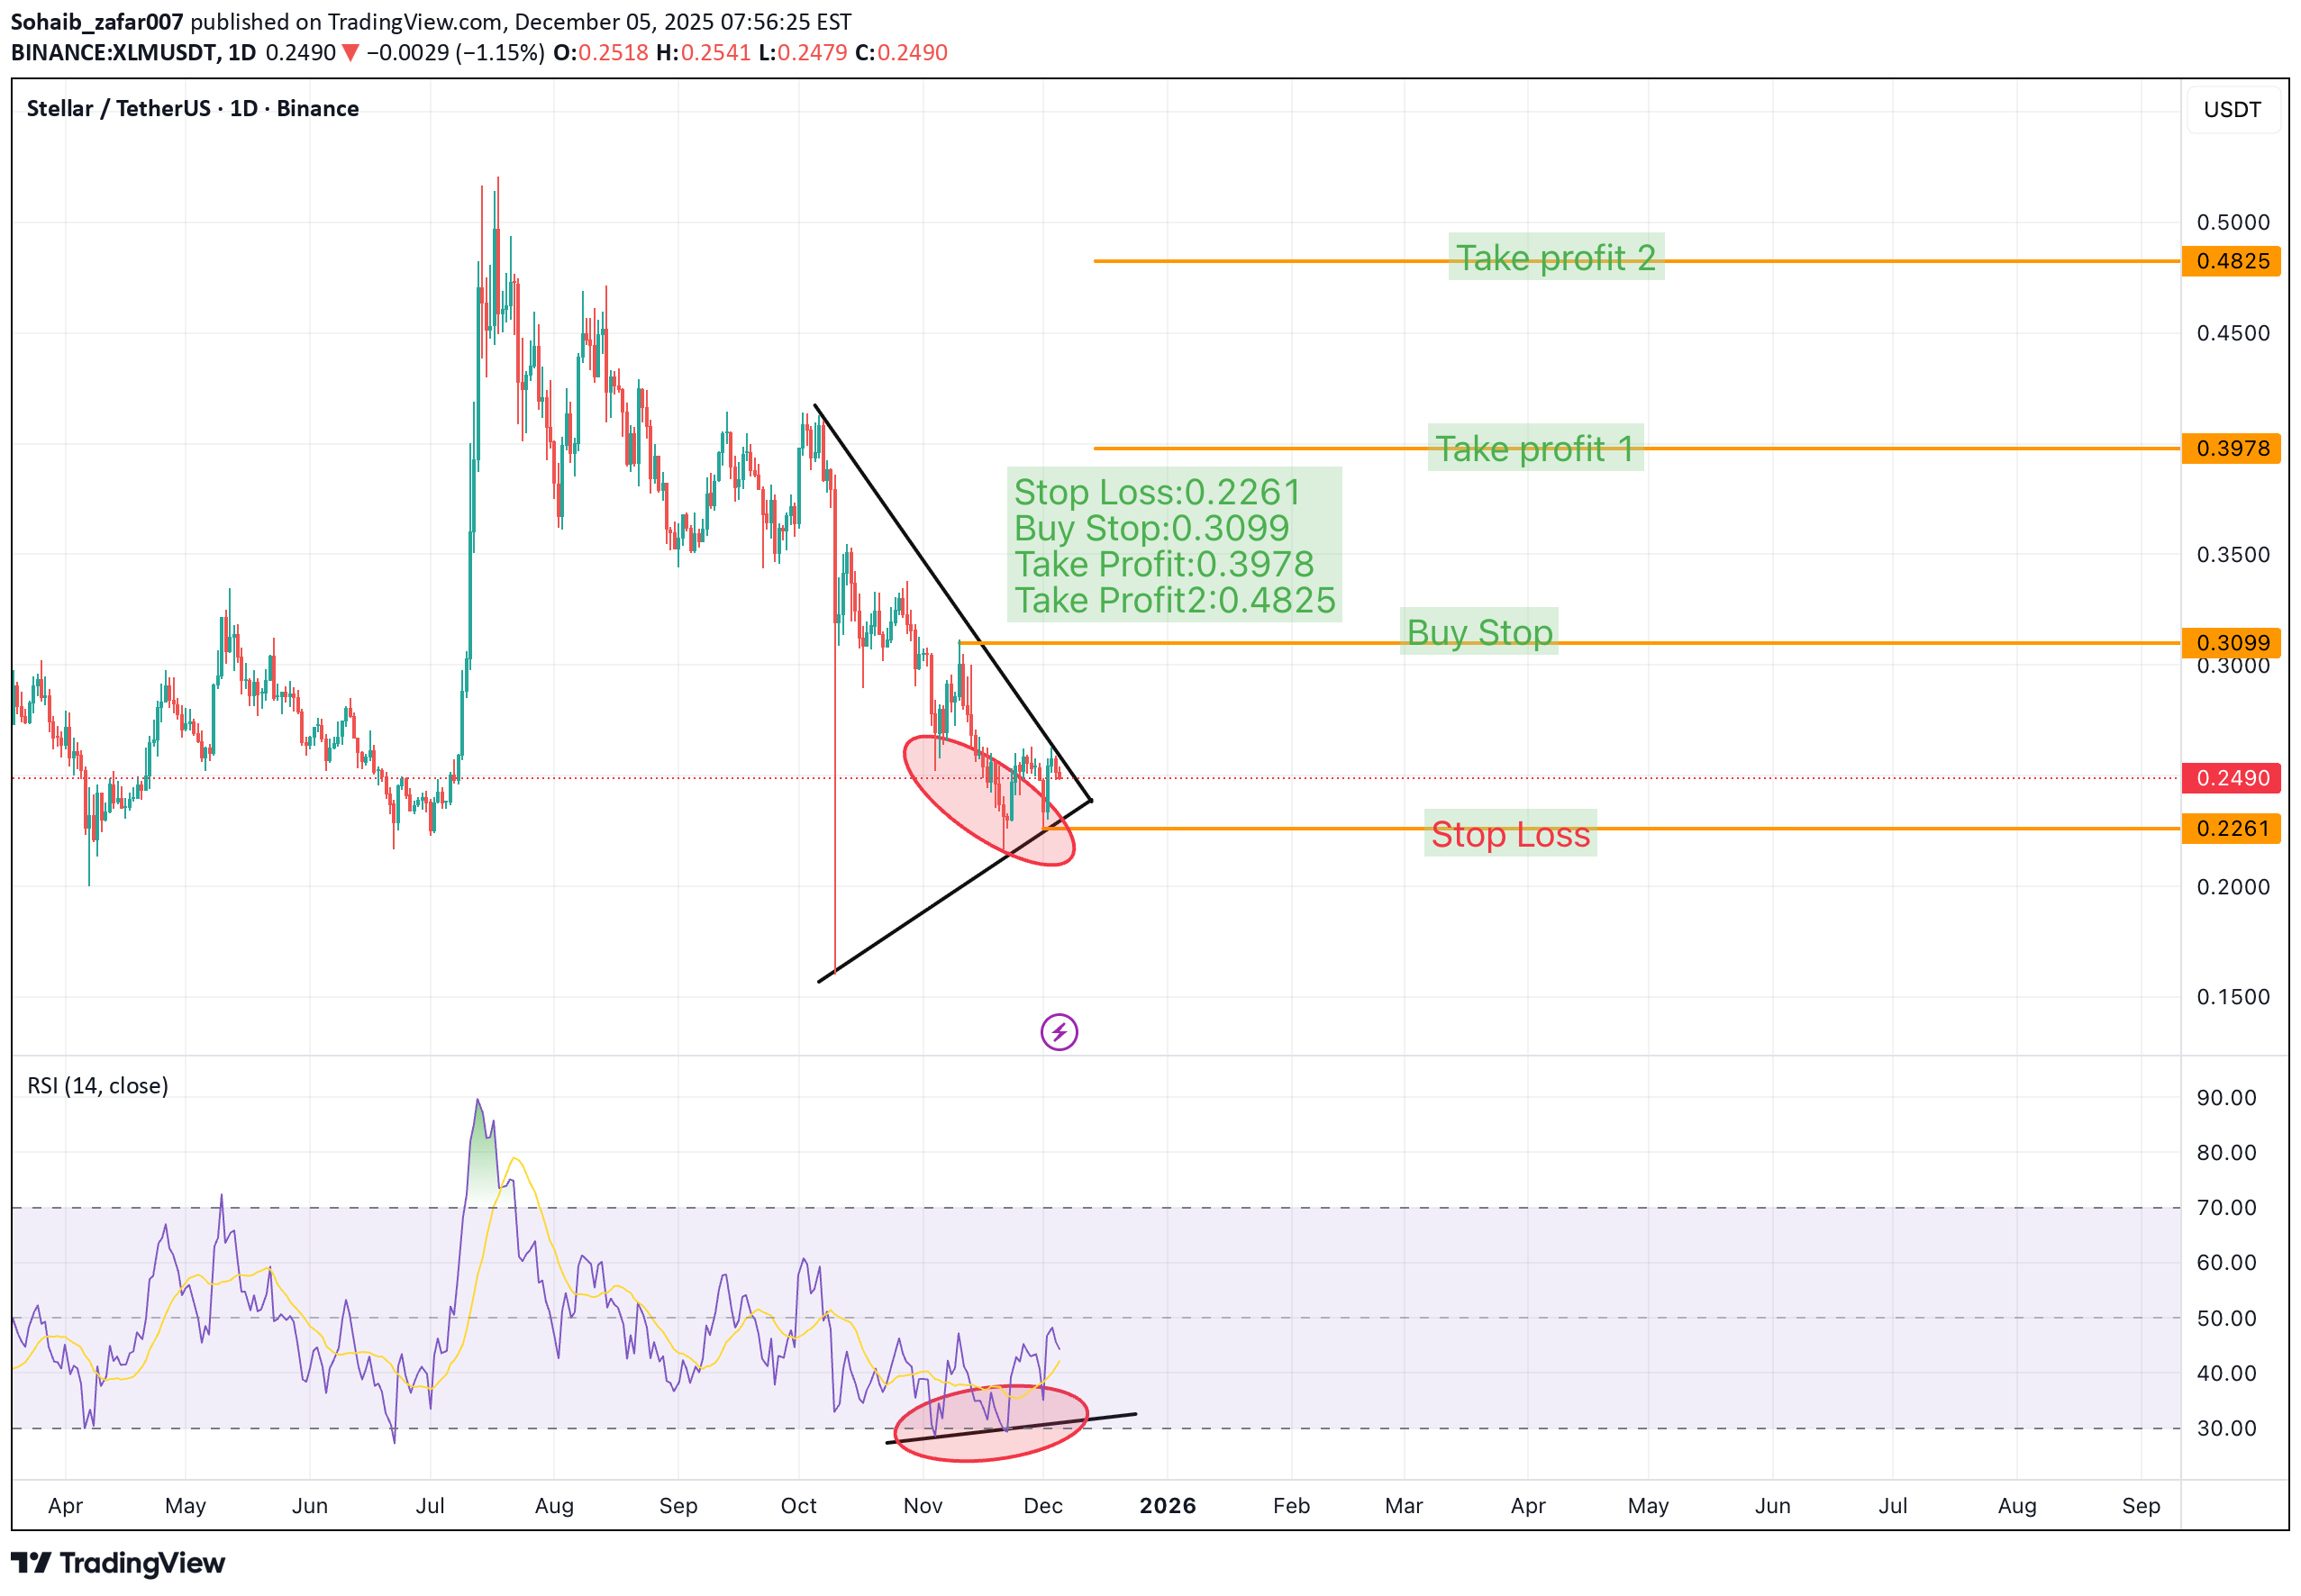
Stop Loss:0.2261 Buy Stop:0.3099 Take Profit:0.3978 Take Profit2:0.4825 Divergence is found in the chart so i hope the market will be bullish after the bearish trend. ⚠️ Always remember to protect your capital with a proper stop-loss and disciplined risk management.
HYPE/USDT Chart Analysis 5-Dec-25
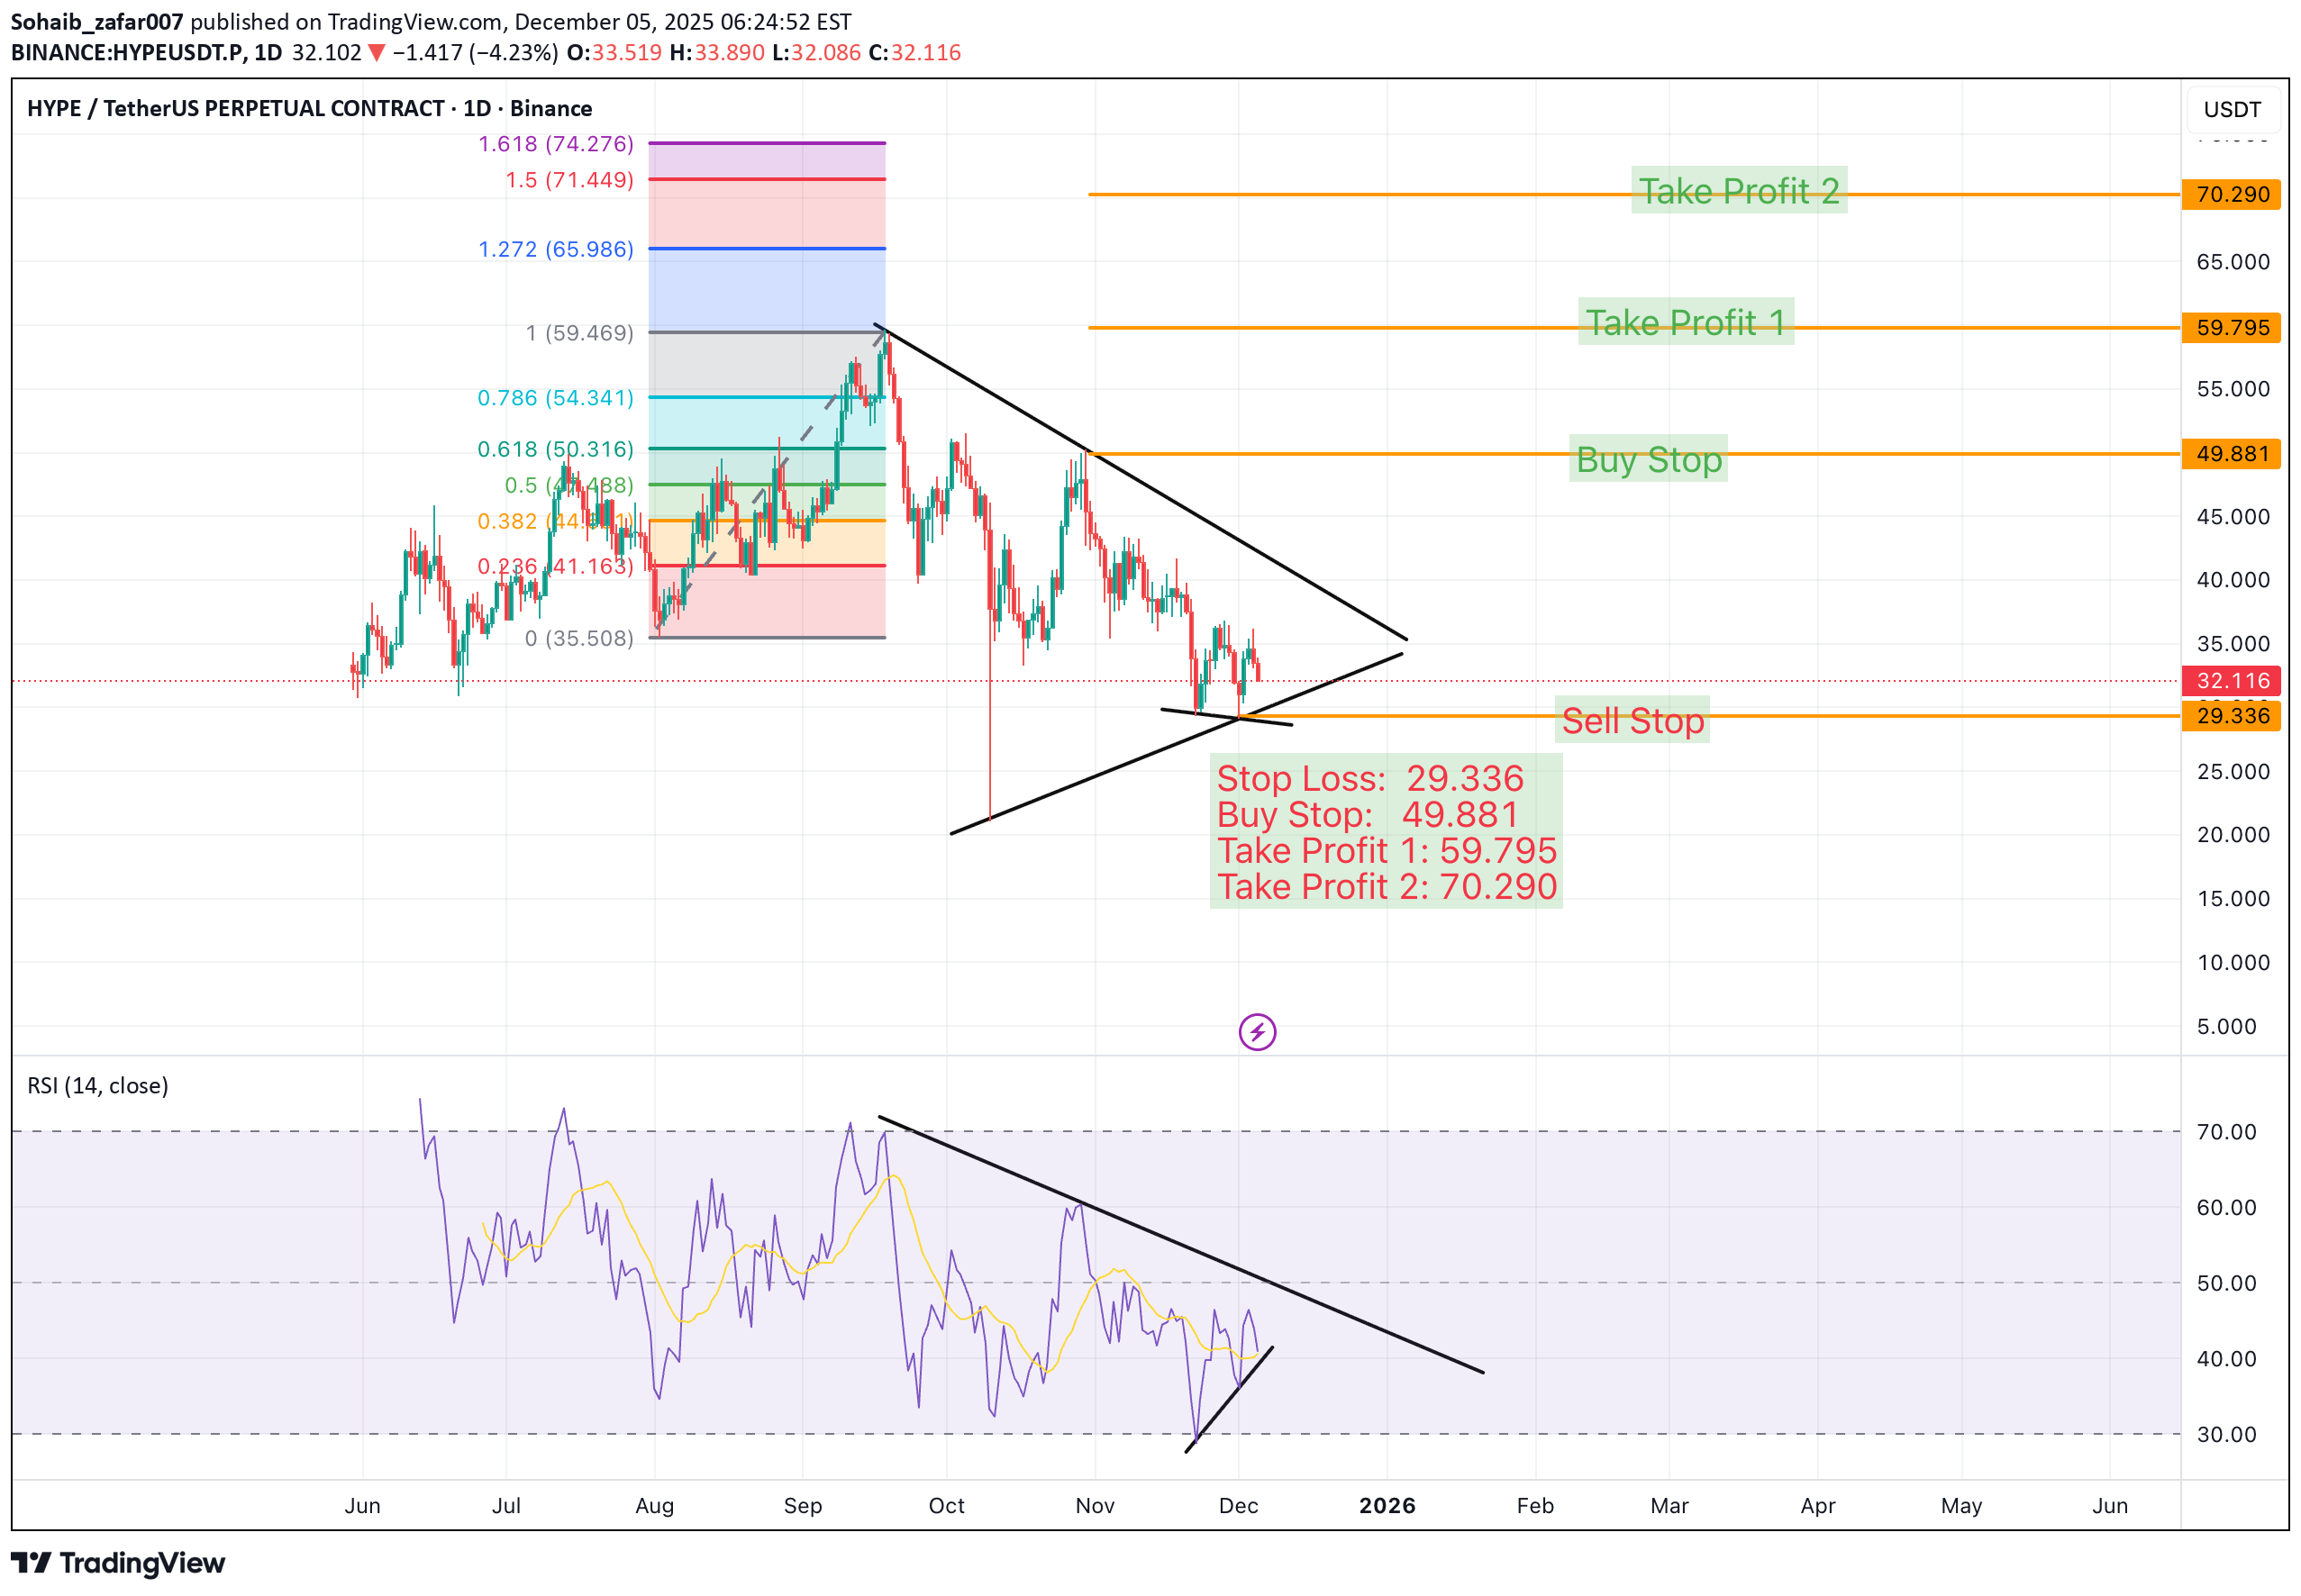
Stop Loss: 29.336 Buy Stop: 49.881 Take Profit 1: 59.795 Take Profit 2: 70.290 Symmetrical Triangle has formed in a day chart pattern.So i expect that it can be bullish and hit the tips divergence has been found in (RSI) chart pattern.So let see and hope for the best. ⚠️ Always remember to protect your capital with a proper stop-loss and disciplined risk management.
LINKUSDT Chart Analysis 3-Dec-25
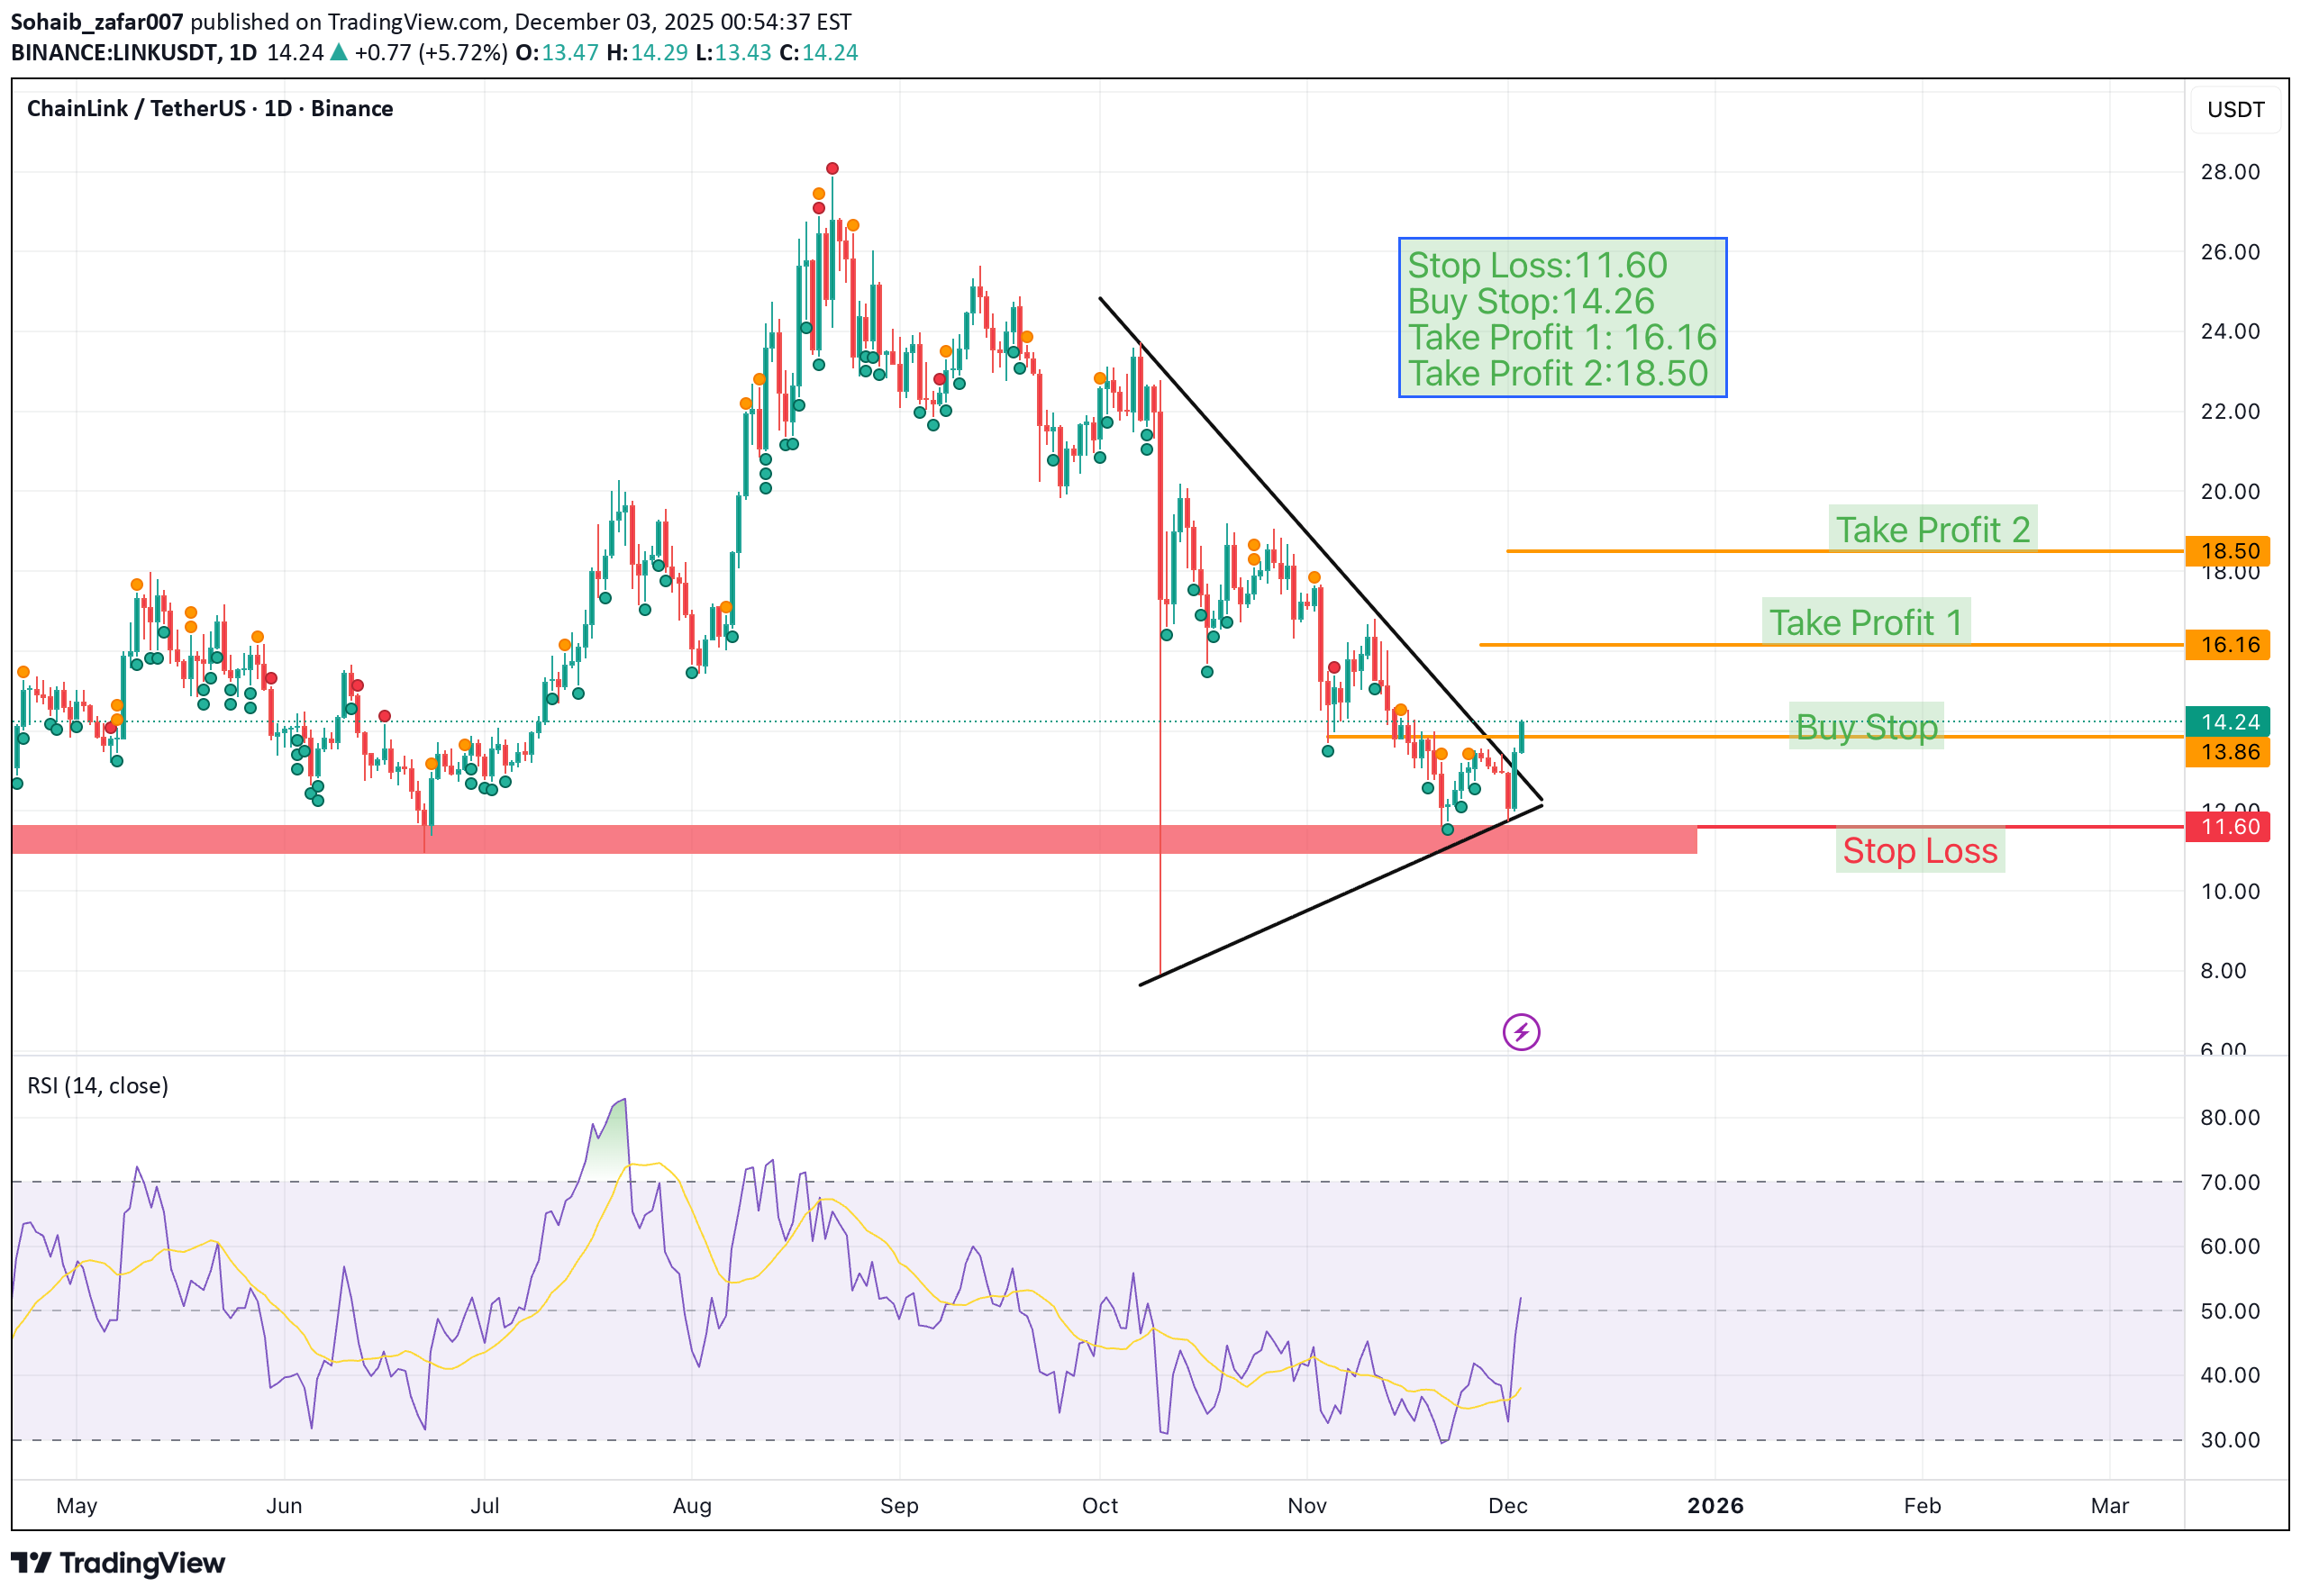
Stop Loss:11.60 Buy Stop:14.26 Take Profit 1: 16.16 Take Profit 2:18.50 (Symmetrical Triangle) has formed in this chart according to pattern it can hit the tps. ⚠️ Always remember to protect your capital with a proper stop-loss and disciplined risk management.
ETHUSDT Chart Analysis 30-Nov-25
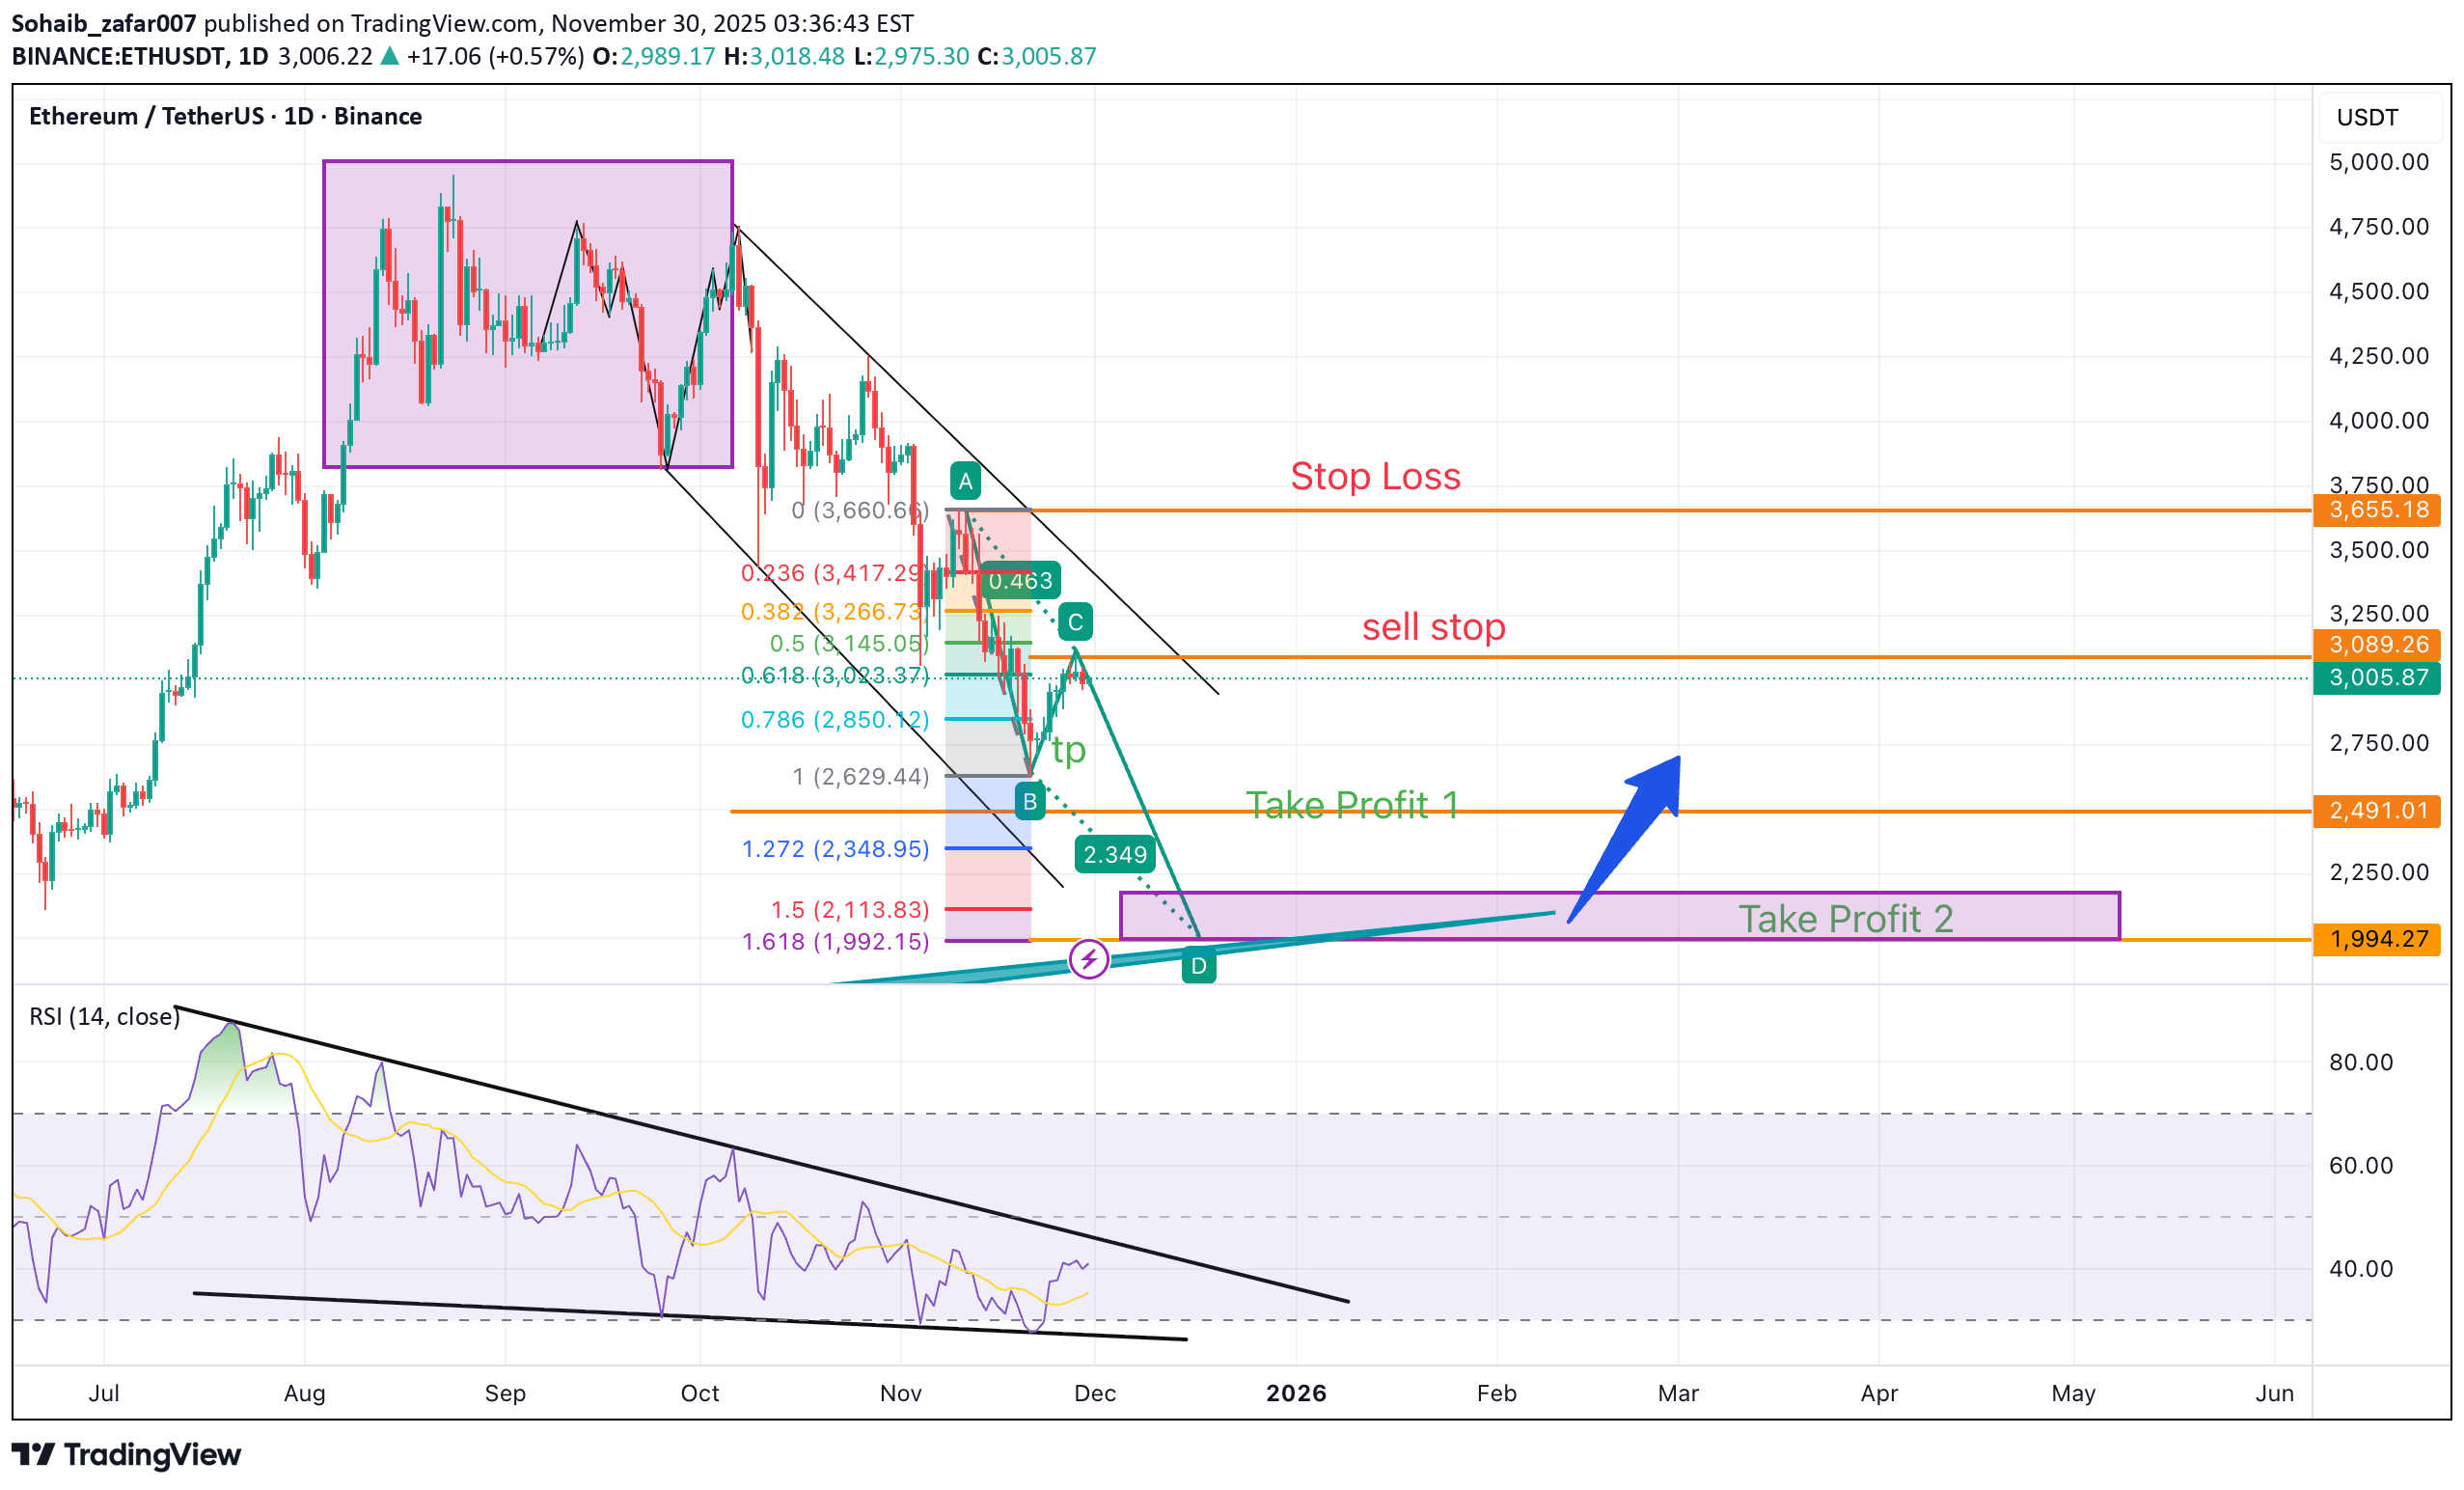
The trend in this chart is currently bearish and forming (AB=CD) Bearish Pattern. Stop Loss: 3655 Sell Stop: 2991 TP1: 2491 TP2: 1994 After Hitting TP2 there will be a (Potential Reversal Zone). According to my Analysis the market will be Bullish.
QNTUSDT Clean Chart Analysis 29-Nov-25
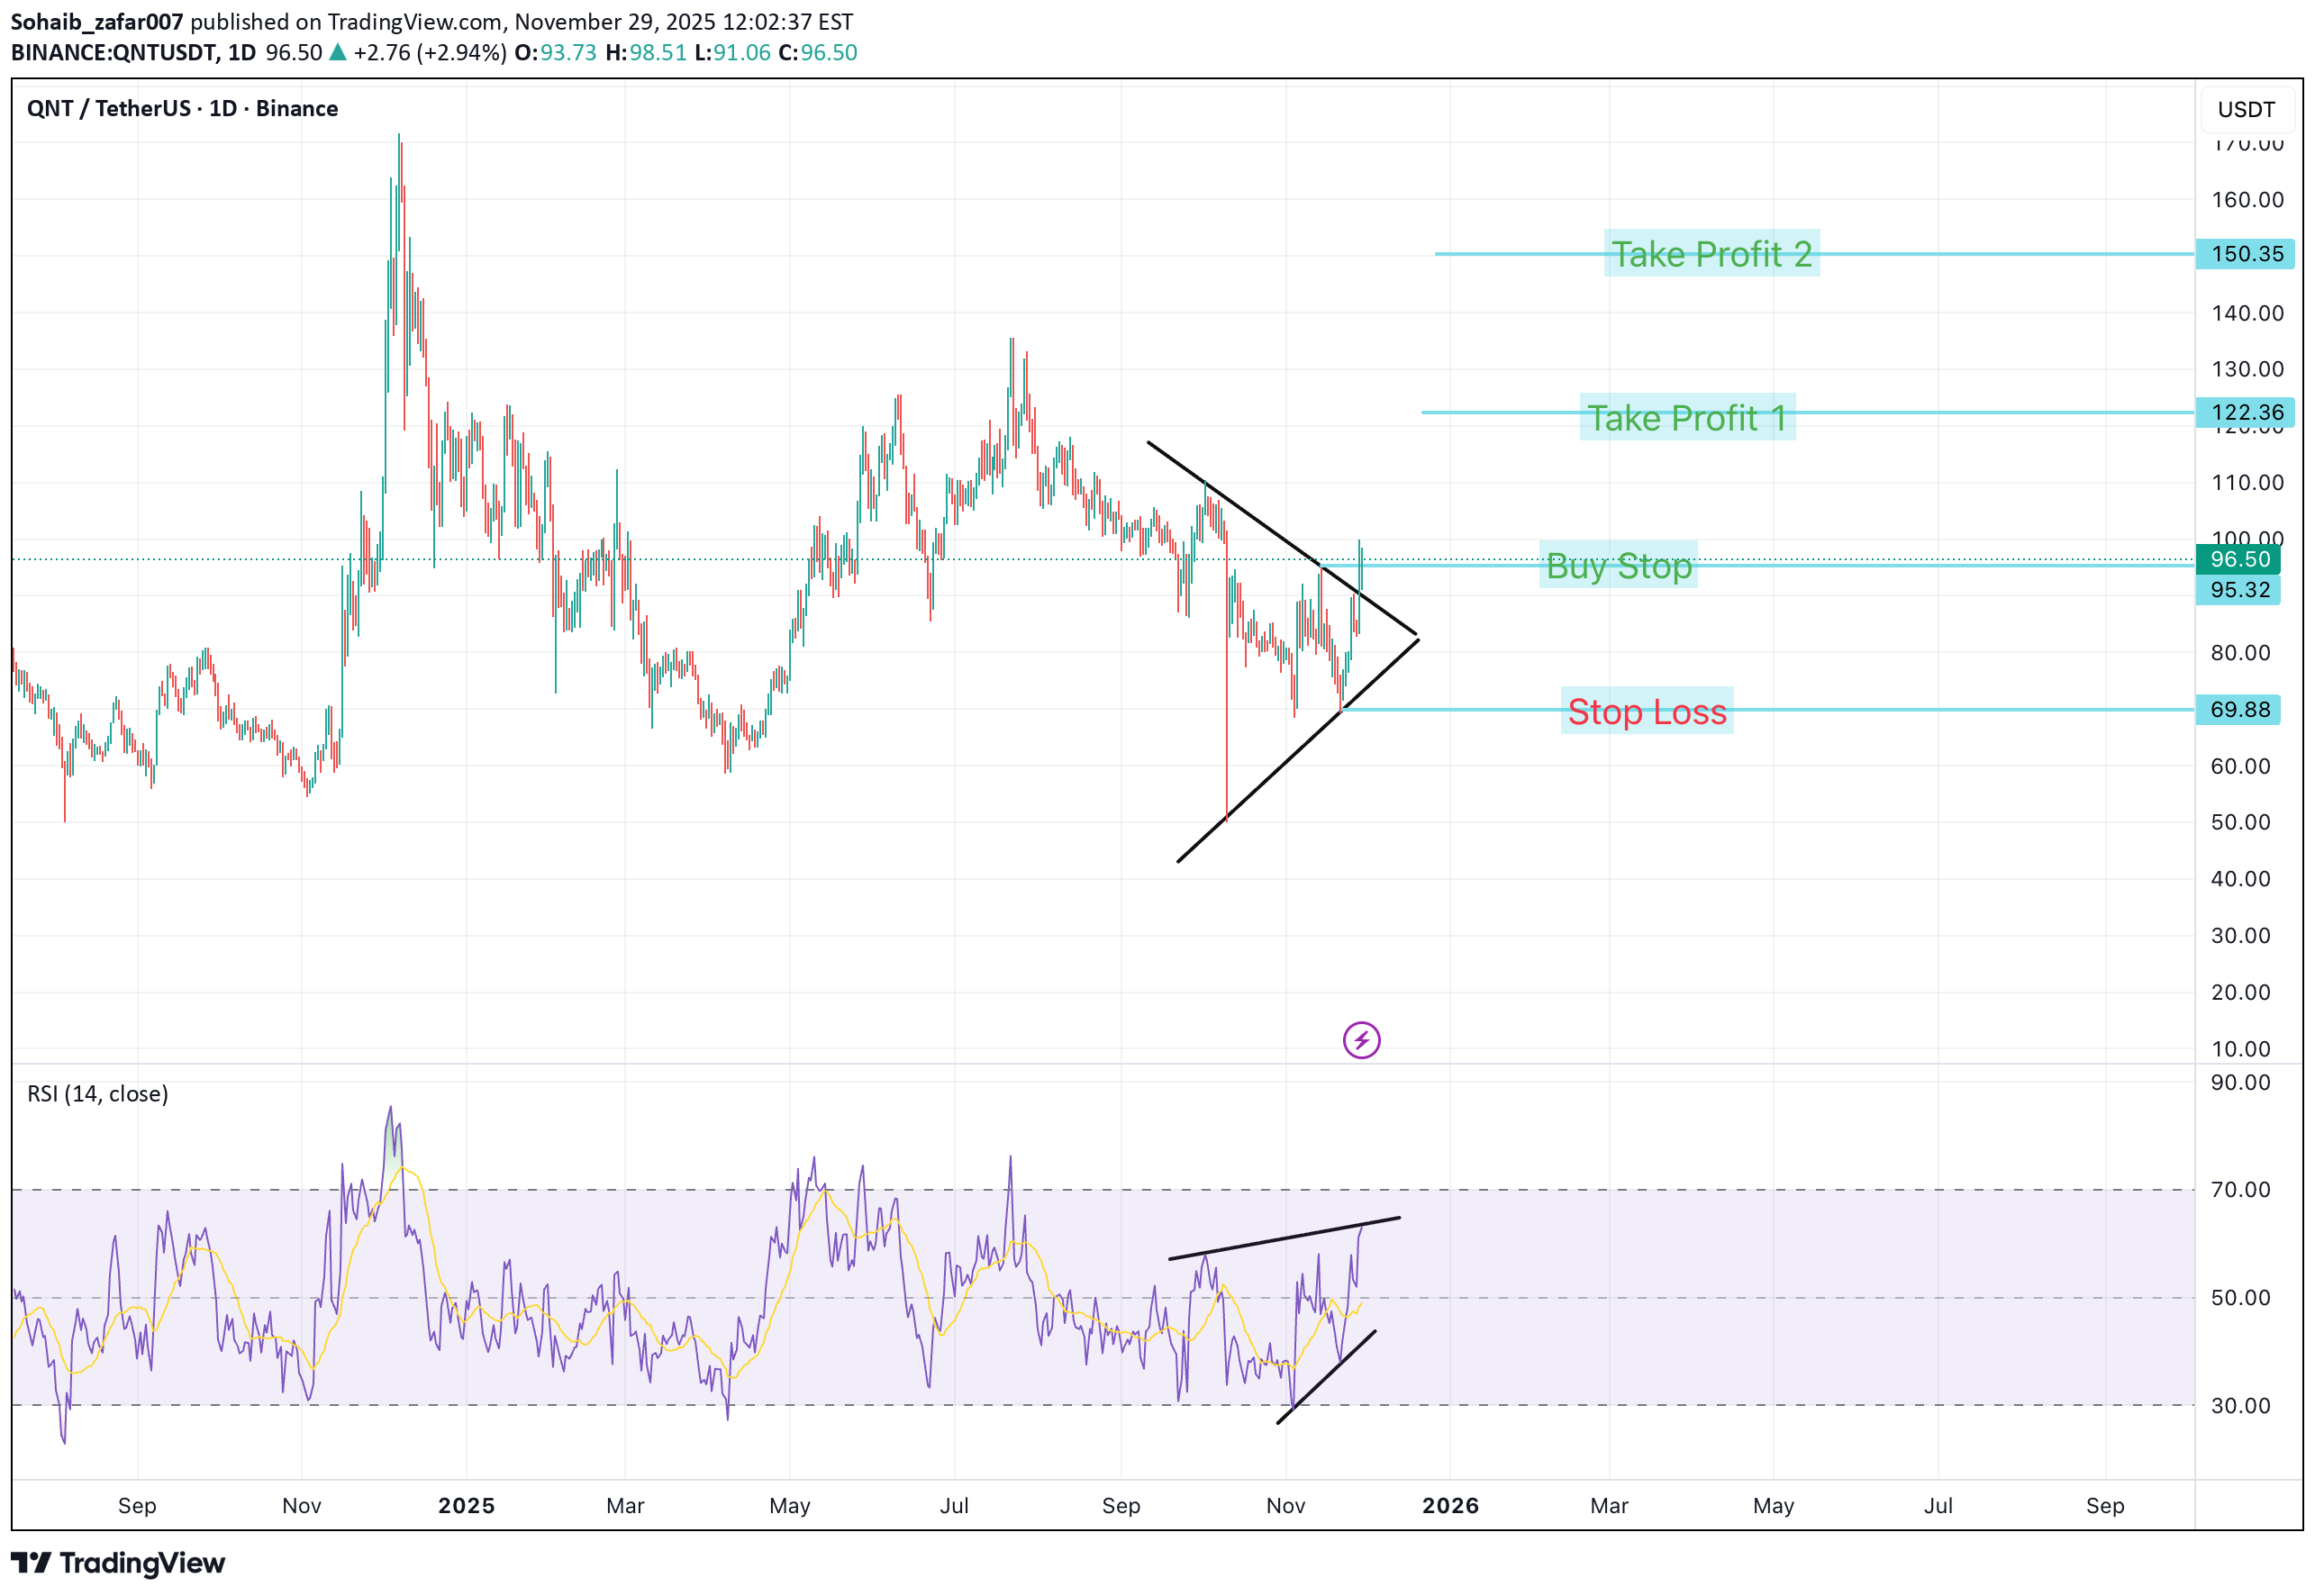
Stop Loss:69 Buy Stop:95.32 TP 1:122 TP 2:150 Triangle Pattern form in D Chart Pattern and it break at 95.32 and change the bearish pattern to bullish and the divergence is formed in (RSI) know i would expect to hit the TPS.
BNBUSDT Chart Analysis 29-NOV-2025
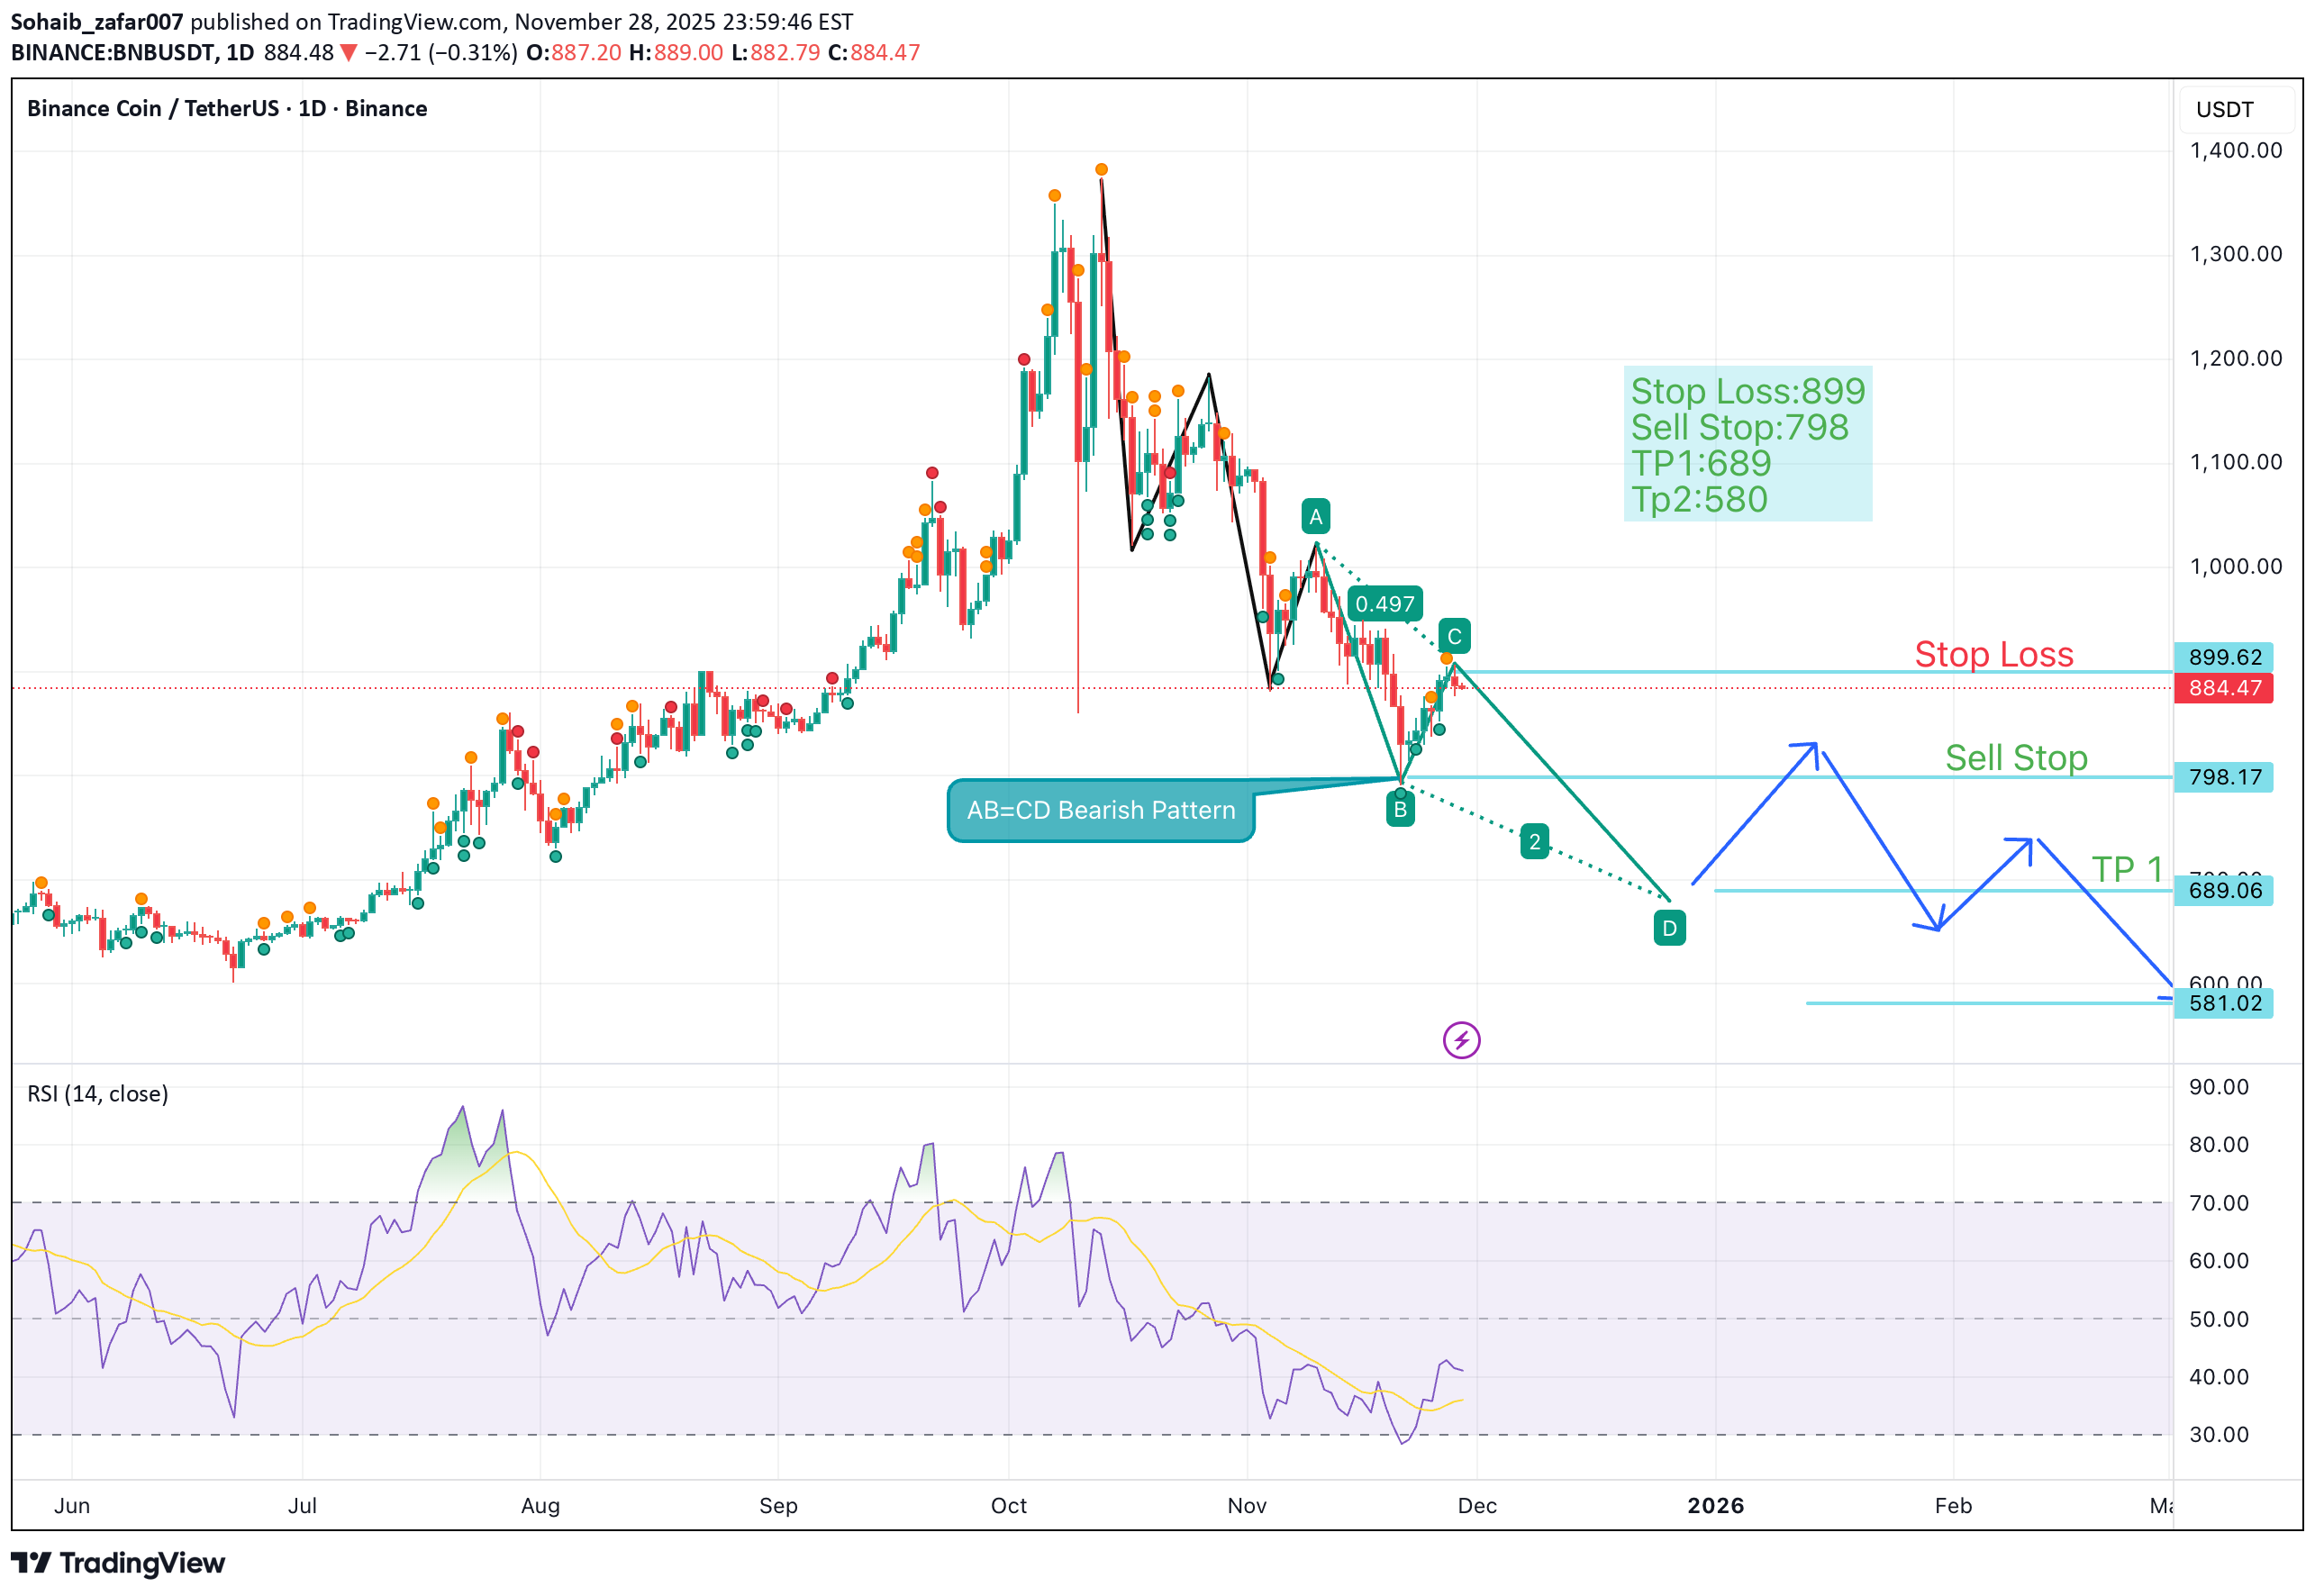
The Chart is forming a (AB=CD)Bearish Pattern and respecting the bearish trend. Currently, there is no divergence in (RSI). So hope the price will be bearish and hit the target in future. Stop Loss:899 Sell Stop:798 TP1:689 Tp2:580
Disclaimer
Any content and materials included in Finbeet's website and official communication channels are a compilation of personal opinions and analyses and are not binding. They do not constitute any recommendation for buying, selling, entering or exiting the stock market and cryptocurrency market. Also, all news and analyses included in the website and channels are merely republished information from official and unofficial domestic and foreign sources, and it is obvious that users of the said content are responsible for following up and ensuring the authenticity and accuracy of the materials. Therefore, while disclaiming responsibility, it is declared that the responsibility for any decision-making, action, and potential profit and loss in the capital market and cryptocurrency market lies with the trader.