
SpartaBTC
@t_SpartaBTC

What symbols does the trader recommend buying?
Purchase History
Trader Messages
Filter
Message Type
SpartaBTC
BNB/USD Main Trend. 11 18 2025

Logarithm. Time frame: 1 week. 🔵Main trend: lower zone of the ascending channel As previously shown on HBAR. 🟡🟣Secondary and local trends There's a pullback to the breakout zone, that is, to the mirror level of the former resistance of the large bowl (currently strong support), meaning the price is retesting the key zone, which are the historical highs of the previous 2021 cycle. This is the same as the 72,000 zone for BTC in the past. 🟣🔄 A breakout of the local designated trend line (purple) is a local trend reversal. But, in general, it's important to understand that this is a retest of the previous breakout zone. 🟢🔄 Confirmation and holding of the price above this zone is astronomical, and any news is just fiction to justify a move into the next zone, already a distribution. 🔴🔄 Failure to hold this zone means a temporary immersion in the previous consolidation. According to the general market trend (market phase) and the asset's liquidity (money in the project), a chart pattern is formed. ______________________________________________________________________ ⚠️ Overall, I think Binance will lose "$ liquidity," that is, users, due to unfair speculative play (controlled by "Big Brother") and a prolonged lack of exchange functionality updates. Perhaps this won't happen immediately, but gradually. But I'm sure many would really prefer not to see this happen instantly. It's unlikely that the exchange itself will survive long-term competition from new exchanges with fresh functionality and "users who aren't offended." 1️⃣ It's worth remembering that the most liquid and popular exchanges in the 2017 cycle were Bittrex and Poloniex. Where are they now? Bittrex is a scam. Poloniex has completely lost liquidity. 2️⃣ In the 2021 cycle of highs, FTX and Binance. The former is a scam. The latter is still around. 0️⃣ The main villain is a scam (everyone understands what, who, and why), which always scams everything monetary for its own interests and monopolizes the "fresh mushrooms" of the market. There is one, which is equivalent to the main "market maker." The one who "created" and "destroyed" dinosaurs from the very beginning, including the MtGox exchange back in 2013, squeezing out "all the available circulating BTC" at the time. This has been his playing field since the very beginning of the crypto bubble. You're on someone else's playing field, so remember that and accept their rules. You're playing by the rules of those who set the traps for you, bypassing them. These rules have little effect on the masters of the speculative game. Accept the game and the risks, or leave... 3️⃣👀What will happen this time? Which liquid exchange will be "killed" to destroy the dollar in a bear market and trigger a super-negative environment? One can only guess. There are several candidates (as well as highly liquid hyped cryptocurrencies) that could influence the overall trend and shape a certain, extremely pessimistic opinion among the majority. Don't guess, you might miss the mark. 🧠 Therefore, when trading and holding cryptocurrencies and USD, diversify your storage and trading locations. 1️⃣ Cold or hardware wallets (a portion of your funds, if you're a holder, is larger; if you're a trader, it's smaller). 2️⃣ + Liquid exchanges (3-4, two isn't enough, as if one goes to the "other world"), you'll lose 50% of your trading funds, and that's a lot. To recover, you need to increase your capital not by 50%, but by 100%. For hamsters, this is "simple," but for traders, it's not. ⚠️ A paragraph off-topic for trading? A reminder of the most important thing, the safety of your money, is not superfluous. What's the point of earning if you'll lose everything? This is not superfluous for smart people who work and earn, rather than paying the market for their emotions and chatting in chats about how rich and broke they are. Risk must always be justified and controlled by you. This is the foundation of foundations. If this isn't the case, then you're building a speculative house on a clay foundation, trying only to guess the price. Sooner or later it will collapse, and the later it happens, the more painful it will be.
SpartaBTC
ICP Main Trend 10 2025
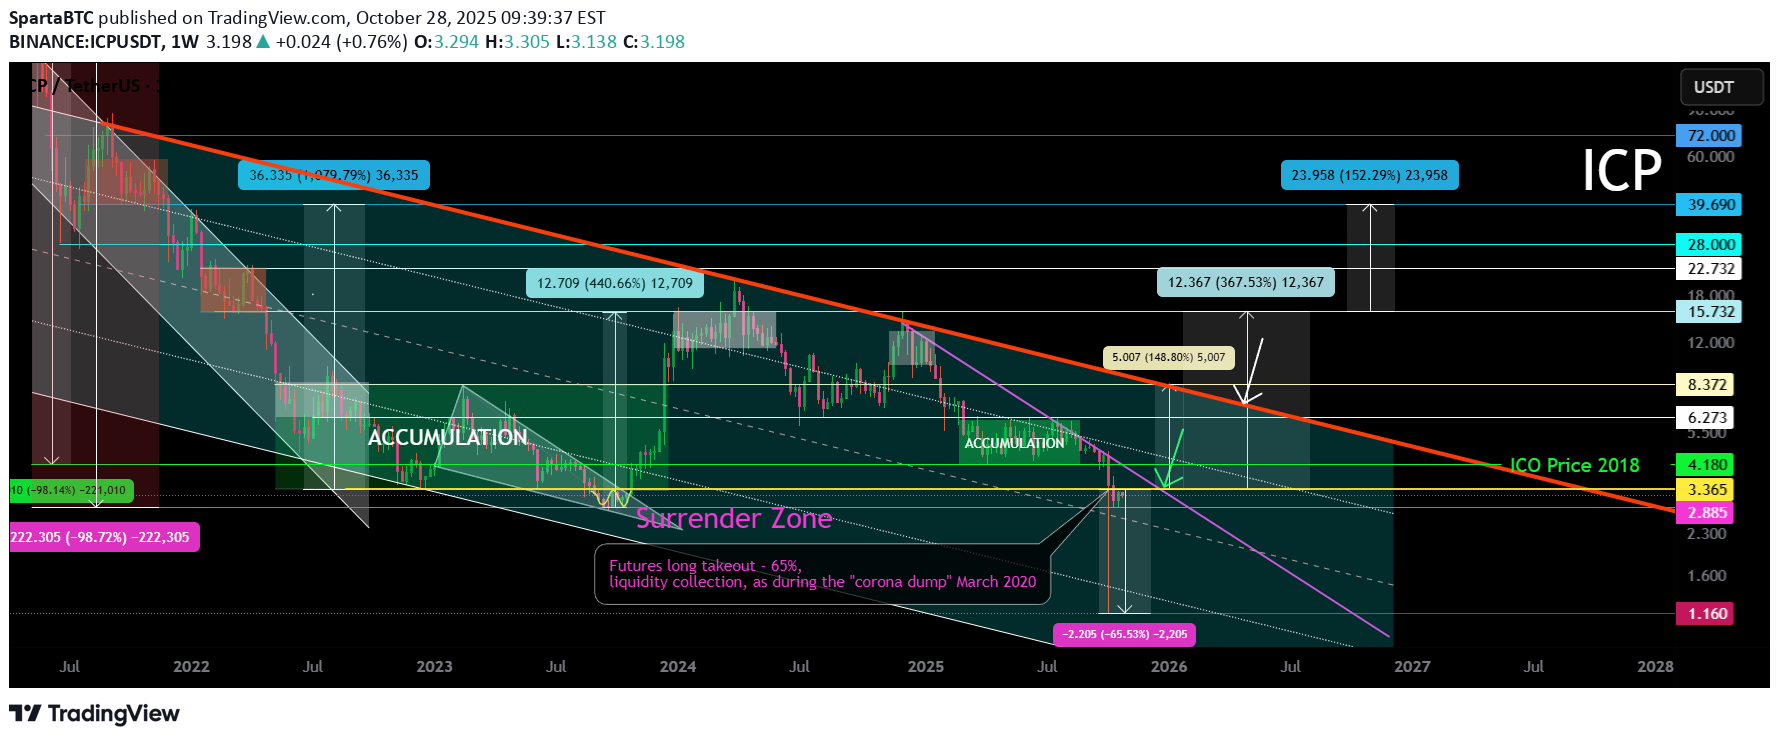
Logarithm. Timeframe: 1 week. I'm updating my previous trading idea for the primary and secondary trends (it achieved its goals with pinpoint accuracy), published 2.5 years ago. A patient and consistent person will be rewarded, while a restless person will not. Locally, this reversal zone is after a futures long takeout: Low-liquidity instruments and huge leverage (targeted by the main information traffic of "easy money" lures) are incompatible... logically... But, it's profitable for exchanges to create such futures trading instruments, as people will leave their money there. There's no real supply or demand, and exchange algorithms completely control the price (volatility), which is why "traders" are doomed. That's why we've recently seen cascading collapses in futures liquidity and mass liquidations, which have been reflected in the spot market. Spike prices on many instruments reached -40-80%, practically in a completely empty order book. It's quite easy to direct the price to such a massive liquidation up or down on a large exchange by manipulating the entire trading volume, given low supply and demand. However, this is impossible (considered blatant manipulation) on a single instrument, and there will be many questions and lawsuits. But if this is done on hundreds of cryptocurrencies simultaneously and across all exchanges, under a correspondingly negative news backdrop, everything is fine; it's the market and the negative news.
SpartaBTC
LTC and XRP Fractals. Main Trend. Triangles 10/18/2025
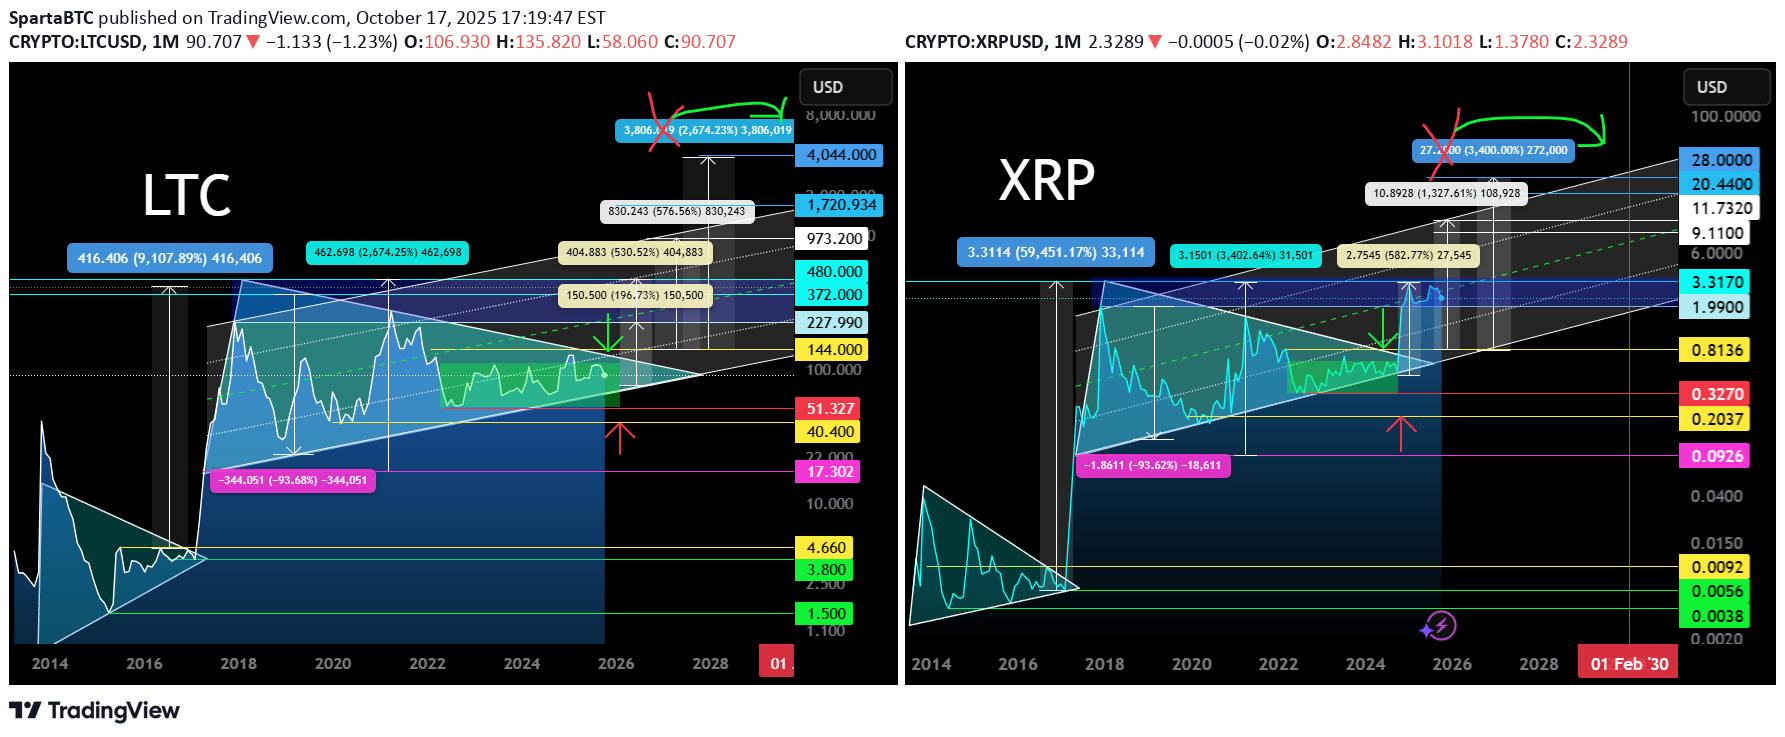
Logarithm. 1-month time frame. Larger time frame for comparison and clarity. XRP is ahead of LTC by 1 year, where a breakout of the 7-year formation and the first wave of strong price growth (pump impulse of 500-600%) have already occurred. There will be 3 of them. 🟣⚠️ But, perhaps a retest of the formation's breakout zone, based on a super-fabulous and funny story, will happen very soon from a trend perspective. This is, more accurately, a retest of human intelligence worldwide, the clarity of common sense (perhaps there will be no reaction, and the scenario will fail to capture the public's attention), which could impact speculative markets as a whole. In general, cryptocurrencies like Litecoin (scam protection) should be of interest to those with common sense but who understand that trading isn't their thing. You buy in increments and forget about it. That is, for investors... Perhaps it would be of interest to positional traders (trades once a year or several months) after a breakout on a pullback, or trigger trades on breakouts of local zones. An idea for comparison that could impact your trading strategy. Don't be confused by the large percentage pumps in 2017 to initiate the formation of the triangles of these 7–8 years. Cryptocurrency in the "reset waves" has long been redistributed. However, this doesn't negate risk management, not like some silly “book” that says to squeeze your coins out of you in reversal zones, but rather as common sense and math dictate. Also, set reasonable targets, depending on the timeframe of your trading strategy, for liquidity accumulation levels and those willing to sell. Don't set limit orders in round numbers, either sell or buy. 🟡 On Litecoin cryptocurrency, the price is still trapped , ahead of a potential breakout (highly likely). It's possible they'll make a false takeout and accumulate long liquidity under the 7.8-year formation before breaking out of the triangle, but that's not a given. LTC ETF to be adopted in the US later . But overall, everything will be fine. Currently, with the price clamping down (over the last six months), we've seen high network activity and an increase in the number of addresses (the banking sector is “testing” + a little large capital) without price growth or positive news. Of the top cryptocurrencies, LTC is currently an underdog, which is logical, as positions are being built up in a local trend after a major redistribution (change of hands). This is a good sign. 🟡 Work in the secondary trend I'll publish later, possibly a public idea. However, here I've shown the maximum targets for both an upward breakout (more likely) and a downward breakout (rare, perhaps, perhaps liquidity accumulation). A chart pattern (trends, figures, fractals, patterns) is formed according to the general market trend (market phase) and the asset's liquidity (money in the project). What is a projection (paragraph below). The price movement direction is determined by: 1️⃣ real supply/demand for the "commodity." 2️⃣ manipulative supply/demand. 3️⃣ intellectual degradation of market participants and their control and predictability. 4️⃣ intellectual “insight” into how things “should” or “shouldn't” be. This is usually the result of points 2 and 3 (the formation of a dominant opinion), and very rarely a personal opinion that can be used to develop one's own trading tactics and money management.
SpartaBTC
EOS — old / A — new. After the rebrand. 10 10 2025

Comparative analysis. The old EOS chart history (8 years) and its continuation in the new coin A (Vaulta), after the rebranding. EOS on exchanges that haven't yet rebranded . On some exchanges (usually low-liquidity ones and DEXs), the old ticker is still trading. They're swaying the price, and the order book is half-empty, so they can sell off the remaining coins on the exchanges. You can exploit this volatility at your own risk, but remember, you could end up holding a coin that's impossible to sell anywhere if EOS isn't exchanged for A, and EOS is delisted, and then, later, A is listed. A (Vaulta) is trading on exchanges that supported the rebranding and the exchange of the old for the new without any hassle. The chart shows a 3-day timeframe. Secondary trend. The downtrend, which has formed a channel, is currently dominant. Local trend. The short targets of the descending triangle, which was broken downwards, are currently being fulfilled. Currently, there is sideways consolidation at the median of the descending channel, which could become a descending flag if support is broken, opening the way to the lower zone of the channel. Then, a reversal to the upper part of the channel. If, after consolidation, the price moves up , then the movement towards resistance of the descending channel. A breakout will break the trend, or return to the descending channel according to its logic. In the medium and long term , it's worth accumulating this Vaulta (working from zones and for a breakthrough), but don't overdo it. It's important to understand that this is a scam project, albeit one with a large marketing slant and the support of contractors from the “money masters” of the USDT issuer and a bunch of liquid exchanges. EOS is the longest-running ICO, and the most lucrative one. “Investors” have buried (let's be honest, they've laundered) billions of dollars in it. Therefore, it's possible, like the already scammed EOS, they'll exploit their brainchild during a "hamster isn't scared" period—a repeat of 2017 and a shot in the arm for a repeat of the scam (not likely).
SpartaBTC
Trias Token (New, after rebranding) Secondary trend. 10 2025

Logarithm. 1-week time frame for trend visibility. Relevant for those trading on DEX exchanges, particularly Uniswap or PancakeSwap. A fractal structure is evident when compared to the entire chart history for this project, before and after the swap (find it yourself and compare). For the new coin after the swap (the chart I provided here), a descending wedge is forming in the secondary trend (the entire history after the coin swap), and a sideways price movement with reduced volatility has begun. In other words, this is a hypothetical accumulation zone. For money management and risk control, I also showed where the price could theoretically fall (optional). Percentages are provided for clarity, from key support and resistance zones to the main areas of previous consolidation. A breakout of the wedge (its resistance) — the potential for a sideways move with a wider range, or a transition to the participation phase, where all of the percentages shown (up to 7.32, no higher, and above that, you shouldn't care) are highly likely to be reached (the general market hype and the altseason, which no one believes in anymore, but it's inevitable). The basis for trading such low-liquidity assets is risk control and diversification of similar assets. 1️⃣ For example, from your total deposit, you allocate 5-10% of your funds to trading such high-risk (low liquidity and lack of top centralized exchanges), but potentially highly volatile, due to low capitalization and liquidity, assets. 2️⃣ Select similar assets for trading - observe 20-50. Observe and study what seems most interesting and promising to you. The most important things to observe are: ➖ This is the potential future traffic of "dumb money." How much new users are pumping Twitter, Telegram, and other social networks. The size of the crypto community. This is essentially the most important thing. How will these people be steered toward buying low-liquidity cryptocurrency during the alt season, which means a large pump. ➖ Buying volume from time to time during consolidations in the lower price zones. ➖ Declines from the high and the market phase and the corresponding phase of the cycle the coin is in. There are high zones and low zones. You should only be interested in the low zones. Anything that has been pumped up should not interest you. ➖ The project's legend , its imitation, and its support in the community. The project creators' activity. ➖ Chart logic and the overall market phase directly influence the altcoin's price. This is key, but people often forget it. A patient and consistent person will be rewarded; a restless person will not. 3️⃣ Of these coins to watch, you select 10-20 to trade and work with them, distributing your funds among key zones. Don't buy with all your allocated funds, but distribute them among key zones and trading situations (breakouts, declines). This is the key difference between a trader and a mere hamster. Control your risks and stick to your trading plan. Don't get caught up in market and news noise, which shapes opinions and the illogical actions of the majority, which are doomed to lose in the future.
SpartaBTC
ETC Main Trend. Ascending Channel (all time) 10 2025

Time frame: 1 week. Logarithm. 🔵Main trend: ascending, rising channel, since the inception of cryptocurrency. 🟡Secondary trend: descending, transitioning to a sideways trend (#accumulation), and forming a 4.9-year symmetrical triangle. 🟣Local trend: descending, trapped in the corner of a large triangle and “tension” consolidation before exiting. Manage your risks and stick to your trading plan, don't get caught up in market and news noise, which creates dominant opinions and illogical actions by the majority, who are doomed to lose in the future. Everything will be as it usually is with assets (stocks, less so cryptocurrencies. These are just a few examples of how these aren't real assets, but imitations of usefulness, i.e., a complete scam market). These assets have maintained an upward primary trend for a long time (from the very beginning), and huge, multi-year patterns form near dynamic support. That is, an upward breakout may initially throw passengers under the market , or some fictitious cryptocurrency events before a price rise (on a large time frame) don't be alarmed; ignore them, or use this opportunity to reduce the average price of the overall position. Or rather, before a dominant trend change, the "point of no return." A striking example of this is XRP with its huge triangle and its exit (the first wave +600%, which is a capitulation on profits, or, in slang, a "hamster pump"). Then there will be 2-3 waves of price growth pumps, with each consolidation in the trend being "buried" and the cry "all is lost." In the final wave, possibly with spikes as before, a full-fledged #distribution zone will form. XRP/USD Main Trend 07 2022 The market is simple at its core, but complex due to the interactions between people and their capital. The combination of simplicity and complexity creates many variations that you can exploit to profit from it. Your success and understanding of this determines your profit or loss in speculative markets. You can complicate things without understanding their simplicity, which looks ridiculous from the outside. Playing smart. Or, conversely, simplifying complex, often false, concepts so that everything becomes clear and understandable. Simplicity is the essence of complexity. In any activity, you should not pursue complexity to achieve the desired result, but rather simplification and optimization, so that you can achieve the same or better results with less effort and risk. The entire secondary trend and this triangle with a local denouement zone in it. Your trading plan and risk management eliminate all worries, indecision, emotional outbursts, predictions, and other people's right and wrong opinions.
SpartaBTC
ETC Secondary Trend 4.9 Year Triangle (like XRP) 10/2025

Logarithm. Time frame: 1 week. Declines from the high in the secondary trend, as before -92%. Formation of the #accumulation zone. Price is being squeezed into a corner. 🔵 Main trend — ascending, rising channel, since the inception of cryptocurrency. 🟡 Secondary trend — downward, transition to a sideways trend - #accumulation, and formation of a 4.9-year symmetrical triangle. 🟣 Local trend — downward, squeezed into the corner of a large triangle and "tension" consolidation before an exit. Main Trend Control your risks and stick to your trading plan. Don't get caught up in market and news noise, which shapes dominant opinions and the illogical actions of the majority, which are doomed to lose in the future. Everything will be as it usually is with assets (stocks, cryptocurrencies, less often, are just a few examples of how these are not real assets, but imitations of usefulness, that is, a complete scam market), which have been around for a long time. For a while (from the very beginning), the upward primary trend is maintained, and huge, multi-year patterns are formed near dynamic support. That is, an upward breakout , perhaps initially throwing passengers under the market , or some fictitious cryptocurrency events before a price rise (on a large time frame). Don't be alarmed, but ignore them, or use this opportunity to reduce the average price of the overall position. Or rather, before a dominant trend change, the "point of no return." A striking example of this is XRP with its huge triangle and its exit (the first wave +600%, which is a capitulation on profits, or, in slang, a "hamster pump"). Then 2-3 waves of price pumps, where at each consolidation in the trend they will "bury" and cry "all is lost." In the last wave, possibly with spikes as before, a full-fledged #distribution zone will form. XRP/USD Main trend 07 2022
SpartaBTC

Logarithm. Time frame: 1 week. Declines from the pump high +1000% to -97% A horizontal channel has formed, with rising highs (outer boundaries). The inner channel range is -93-96%. Typical trading in horizontal channels (from zones or on breakouts) and upon exiting them, while adhering to money management. Buy fear in pieces, sell joy in pieces.
SpartaBTC
Logarithm. 3 days. Main trend 23 03 2025 A breakout of the previously mentioned key resistance (pair to USD) occurs on huge buying volume and an exit from the sideways trend (inverse head and shoulders). Local targets, in case the inverse head and shoulders pattern is realized and a bowl forms at the next resistance level (previous consolidation).
SpartaBTC
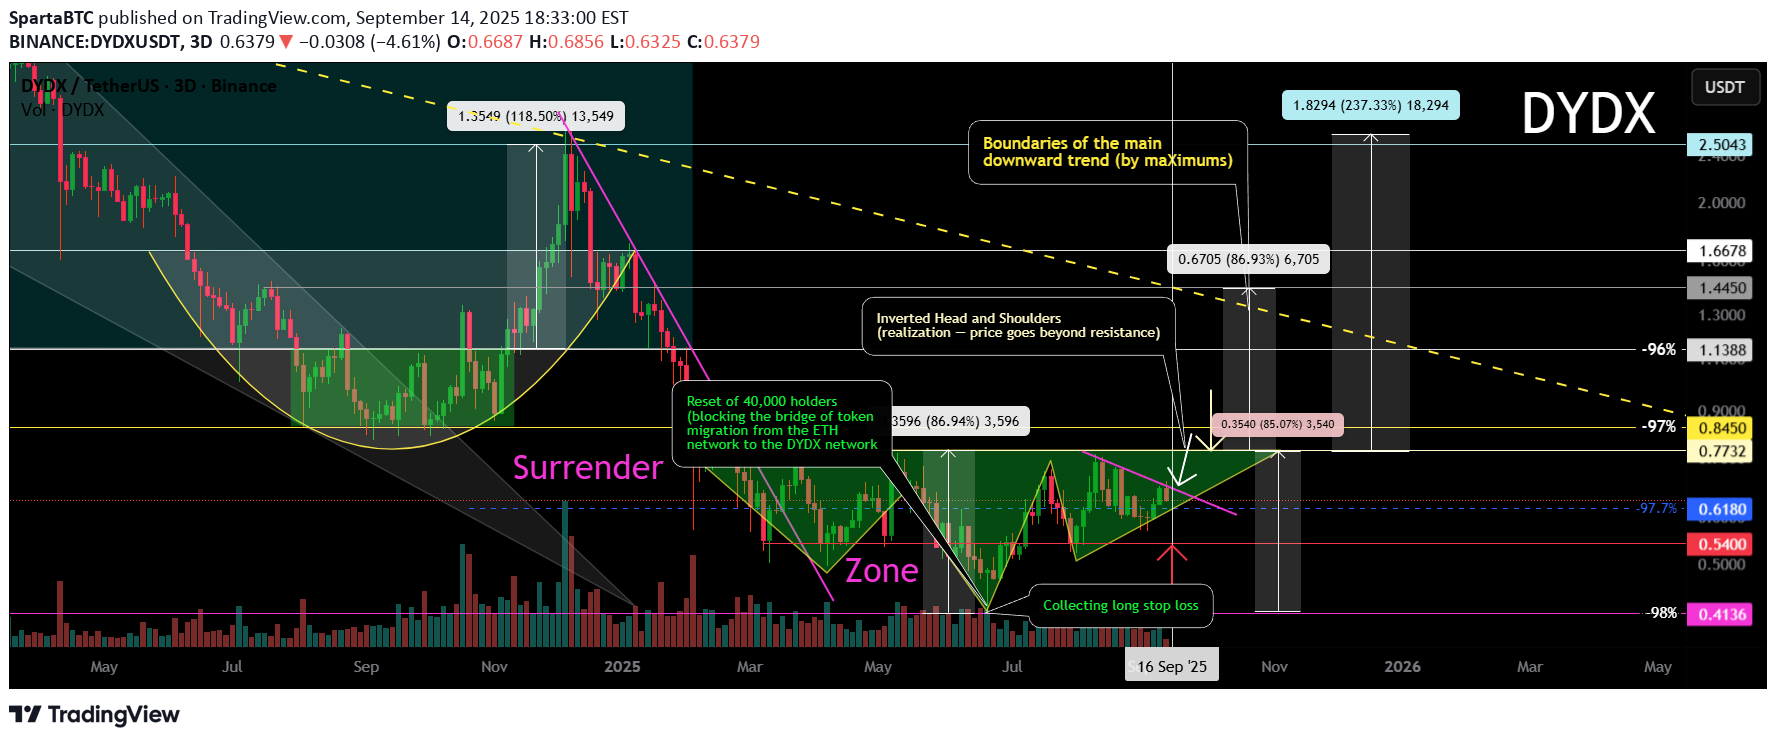
Logarithm 3 days. In the capitulation zone on the super negative, a reversal pattern of an inverted head and shoulders is formed. Its implementation of goals is to enter when the price overcomes the resistance of the pattern. Main trend. -98%. DYDX Main trend. 30 08 2024 15 09 2025 Manipulations from the project developers. Most recently in June (trend minimum, negative) - the developments froze (turned to zero) the tokens of about 40,000 DYDX holders. They blocked the token migration bridge from the ETH network to the DYDX network. In other projects, such migration is always open (for example, from the fact that I have EWT (EWTB), because many holders, after purchasing an asset and withdrawing it to a wallet, do not particularly follow the events of the projects. But, with DYDX, this did not work. Balances on wallets, and already a super depreciated token (from the peak of pumping, a natural -98% depreciation in liquidity), literally turned into zero. Probably, it is more offensive not to the hamsters who bought on the listing, news and hype, but to those people who gained from supporting a long-term downward channel. There are rumors that for 10% of the cost, developers make an exchange of network tokens. If this is true, then from the standpoint of the morality of the developers, this is the moral bottom.
Disclaimer
Any content and materials included in Finbeet's website and official communication channels are a compilation of personal opinions and analyses and are not binding. They do not constitute any recommendation for buying, selling, entering or exiting the stock market and cryptocurrency market. Also, all news and analyses included in the website and channels are merely republished information from official and unofficial domestic and foreign sources, and it is obvious that users of the said content are responsible for following up and ensuring the authenticity and accuracy of the materials. Therefore, while disclaiming responsibility, it is declared that the responsibility for any decision-making, action, and potential profit and loss in the capital market and cryptocurrency market lies with the trader.