
TradingShot
@t_TradingShot

What symbols does the trader recommend buying?
Purchase History
Trader Messages
Filter
Message Type

The S&500 (SPX) has been trading within a massive 16-year Channel Up since the 2008 U.S. Housing Crisis. Within this pattern it has been repeating various shorter fractals as you can see on this chart it is one that truly stands out. That's the necessity of the market to correct back to its 1W MA200 (orange trend-line) every time it reaches a Top after an exhaustion rally. With the 1W RSI on a Lower Highs Bearish Divergence (against the price's Higher Highs), there is no better time to consider a market top, thus a strong correction, especially after such a non-stop exhaustion rally since the April 2025 Low. Based on the 1W MA200 trajectory, we make a fair estimate that contact can be achieved around the 5500 level, which will be our next long-term buy on stocks. Alternatively, if the 1W RSI approaches the 30.00 oversold level, without the index touching 5500, it will be a good idea to Buy regardless of the price. --- ** Please LIKE 👍, FOLLOW ✅, SHARE 🙌 and COMMENT ✍ if you enjoy this idea! Also share your ideas and charts in the comments section below! This is best way to keep it relevant, support us, keep the content here free and allow the idea to reach as many people as possible. ** --- 💸💸💸💸💸💸 👇 👇 👇 👇 👇 👇
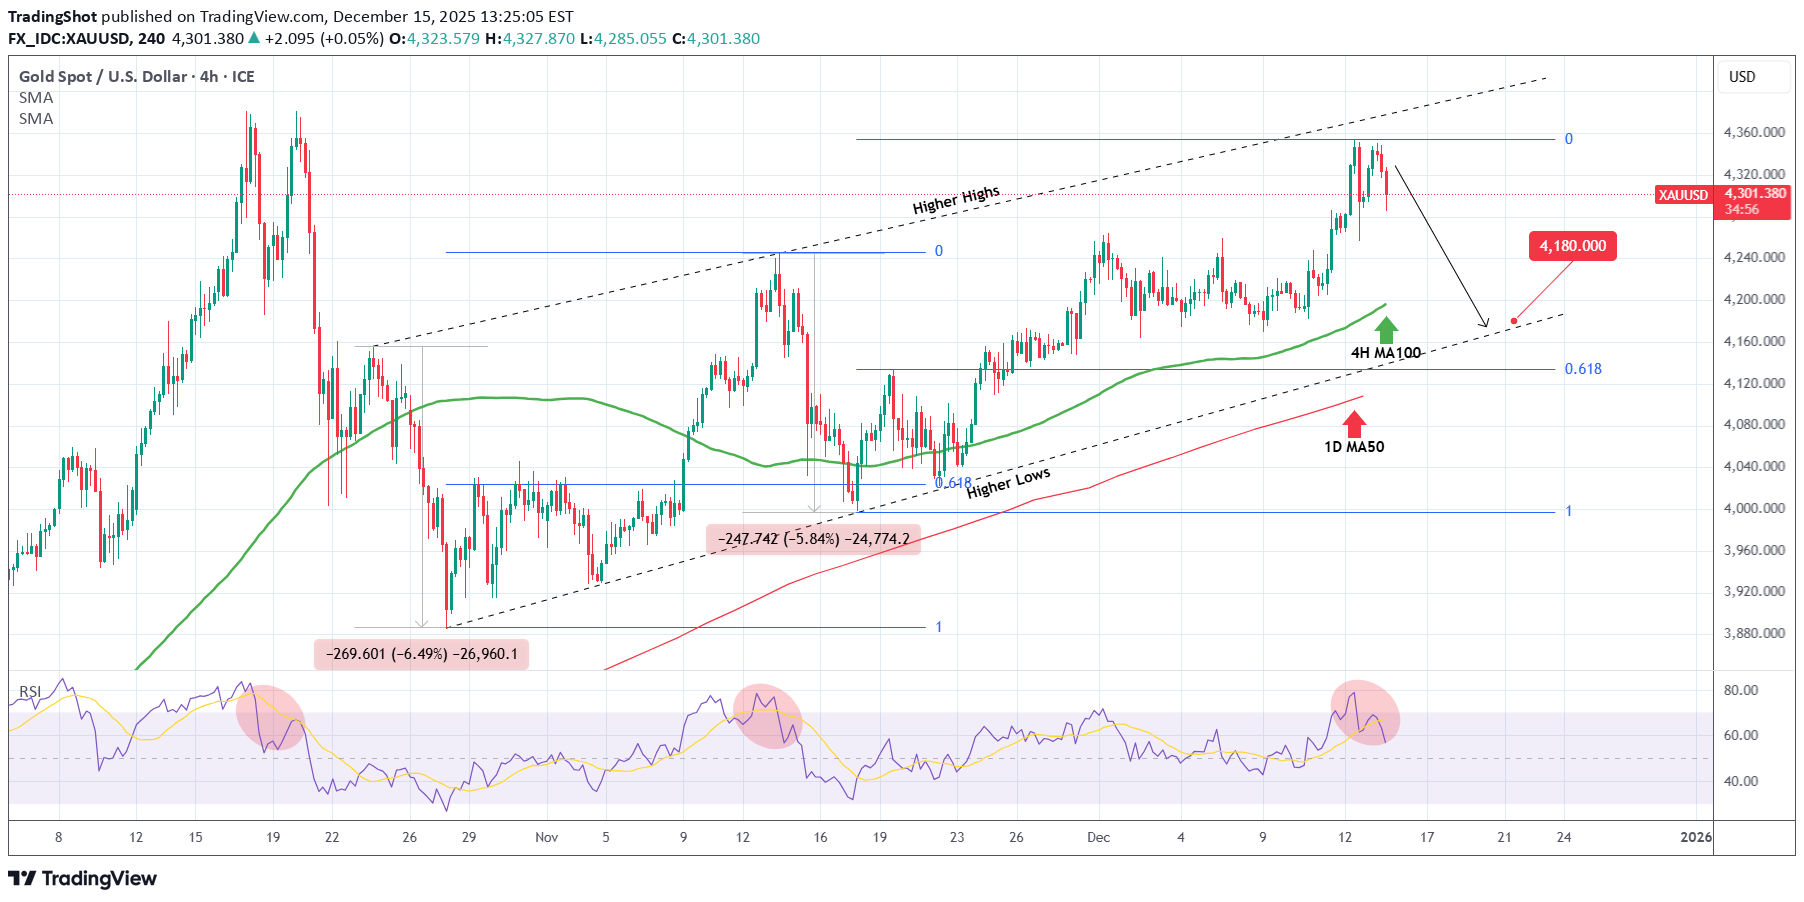
Gold (XAUUSD) got rejected and turned sideways just before hitting the Higher Highs trend-line of the underlying rising channel. In the past 2 months we've seen this exact same Sell Signal another 2 times. Even the current 4H RSI sequence matches those peaks. Those previous Sell Signals eventually made the price pull-back below the 4H MA100 (green trend-line). This time the current Support is the Higher Lows trend-line and of course the 1D MA50 (red trend-line) which continues to keep the long-term bullish trend intact. As a result, we are targeting 4180 at least in the coming days, which is still above the 0.618 Fibonacci retracement level which supported the previous -5.84% Bearish Leg. --- ** Please LIKE 👍, FOLLOW ✅, SHARE 🙌 and COMMENT ✍ if you enjoy this idea! Also share your ideas and charts in the comments section below! This is best way to keep it relevant, support us, keep the content here free and allow the idea to reach as many people as possible. ** --- 💸💸💸💸💸💸 👇 👇 👇 👇 👇 👇
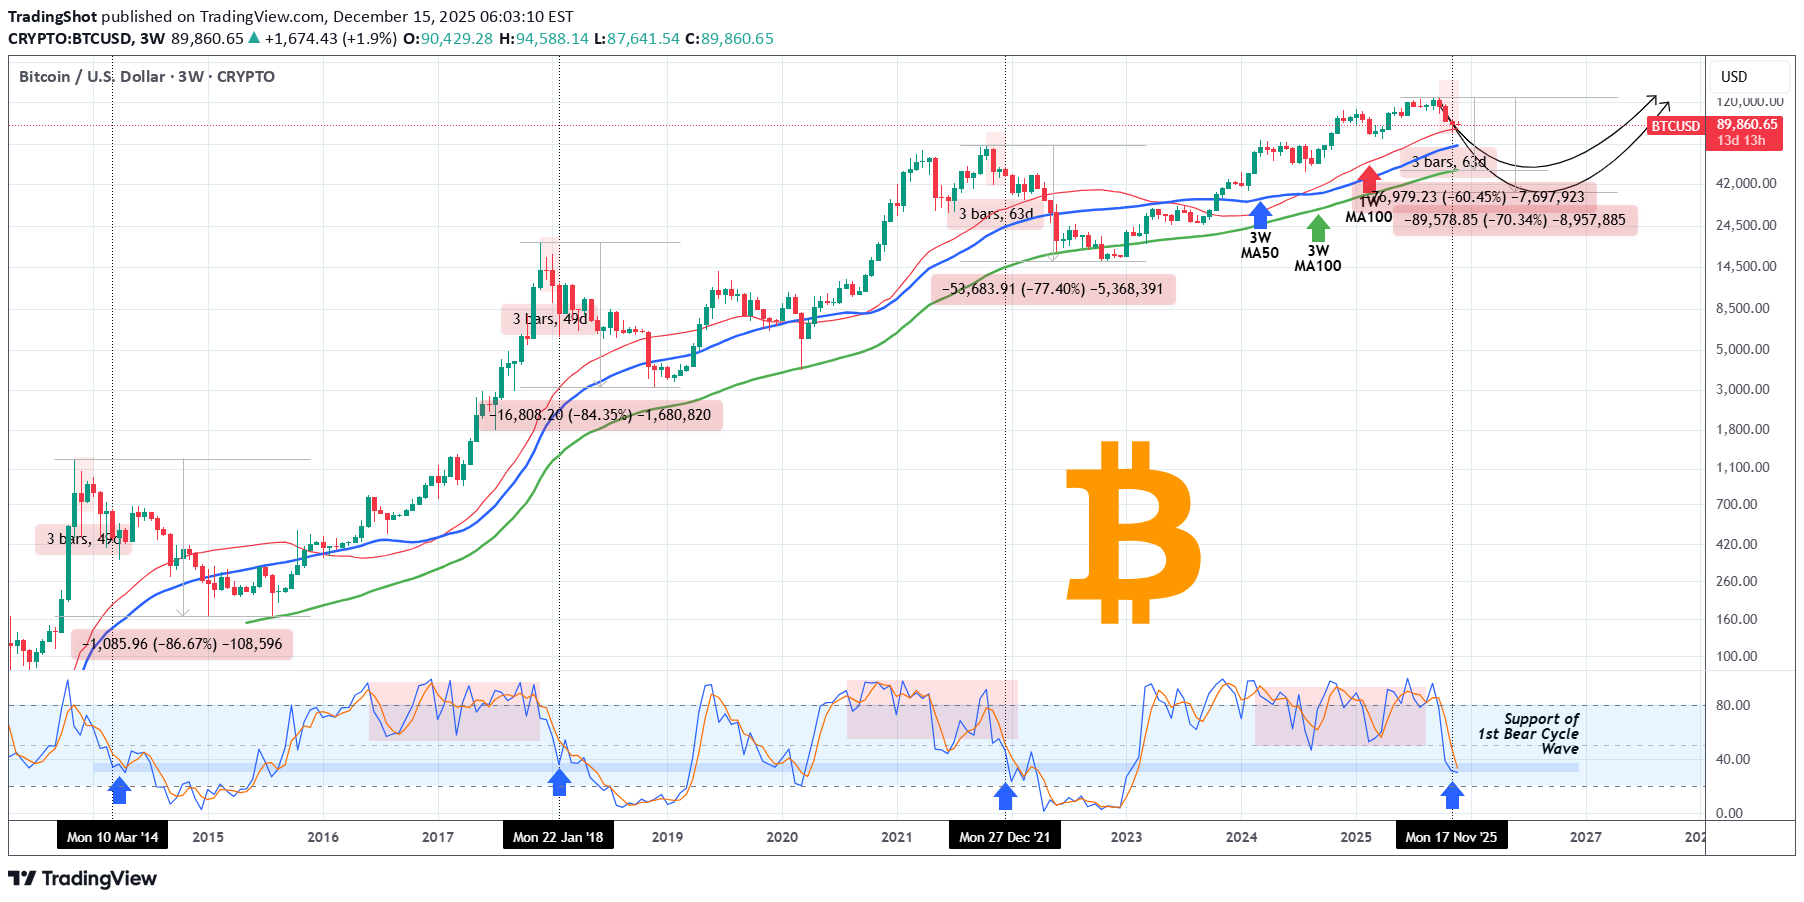
Bitcoin (BTCUSD) has been falling non-stop since its October All Time High and all the signs continue to be there that we have already entered the new Bear Cycle. We've been sharing extensive analyses with you since September on the markers of the Bear Cycle and the latest indicator that adds to the data set is the STOCH on the 3W time-frame. As you can see, it has entered a level where all previous three Bear Cycles completed roughly their 1st Phase and rebounded on a dead-cat-bounce. On average it i roughly after every three 3W candles that this happens, this time it was after two, the previous two Bear Cycles after three and the one before (longest) after six. Also this is the fastest it's reached the 1W MA100 (red trend-line) on a Bear Cycle correction and most likely it will be the same for its 3W MA50 (blue trend-line) and 3W MA100 (green trend-line). This is another sign that shows how every Cycle gets less and less aggressive. The first Bear Cycle dropped by roughly -94%, the second by -87%, the third by -84% and the fourth (last) by 77%. This decelerating rate reveals BTC's asymptotic behavior as more and more mass adoption kicks in with every passing Cycle. As the market stabilizes, becomes larger and more widespread, the volatility becomes lower and lower. This is a sign of maturity. So what does this potentially mean for us and this Bear Cycle? Well that the drop will most likely be contained at -70% maximum (-7% less than the previous Cycle), a rate that may be as low as -60% (just after contacting the 3W MA100) if ETF buying interest returns or other fundamental catalysts (bitcoin treasuries etc?) accelerate adoption. So this potential range translates into a possible buy zone of $50000 - $38000 towards the end of 2026 but that's a topic we've analyzed extensively on other studies. So do you think the 3W STOCH puts another nail on Bitcoin's coffin or there are still hopes that the Bull Cycle will be resumed? Feel free to let us know in the comments section below! --- ** Please LIKE 👍, FOLLOW ✅, SHARE 🙌 and COMMENT ✍ if you enjoy this idea! Also share your ideas and charts in the comments section below! This is best way to keep it relevant, support us, keep the content here free and allow the idea to reach as many people as possible. ** --- 💸💸💸💸💸💸 👇 👇 👇 👇 👇 👇
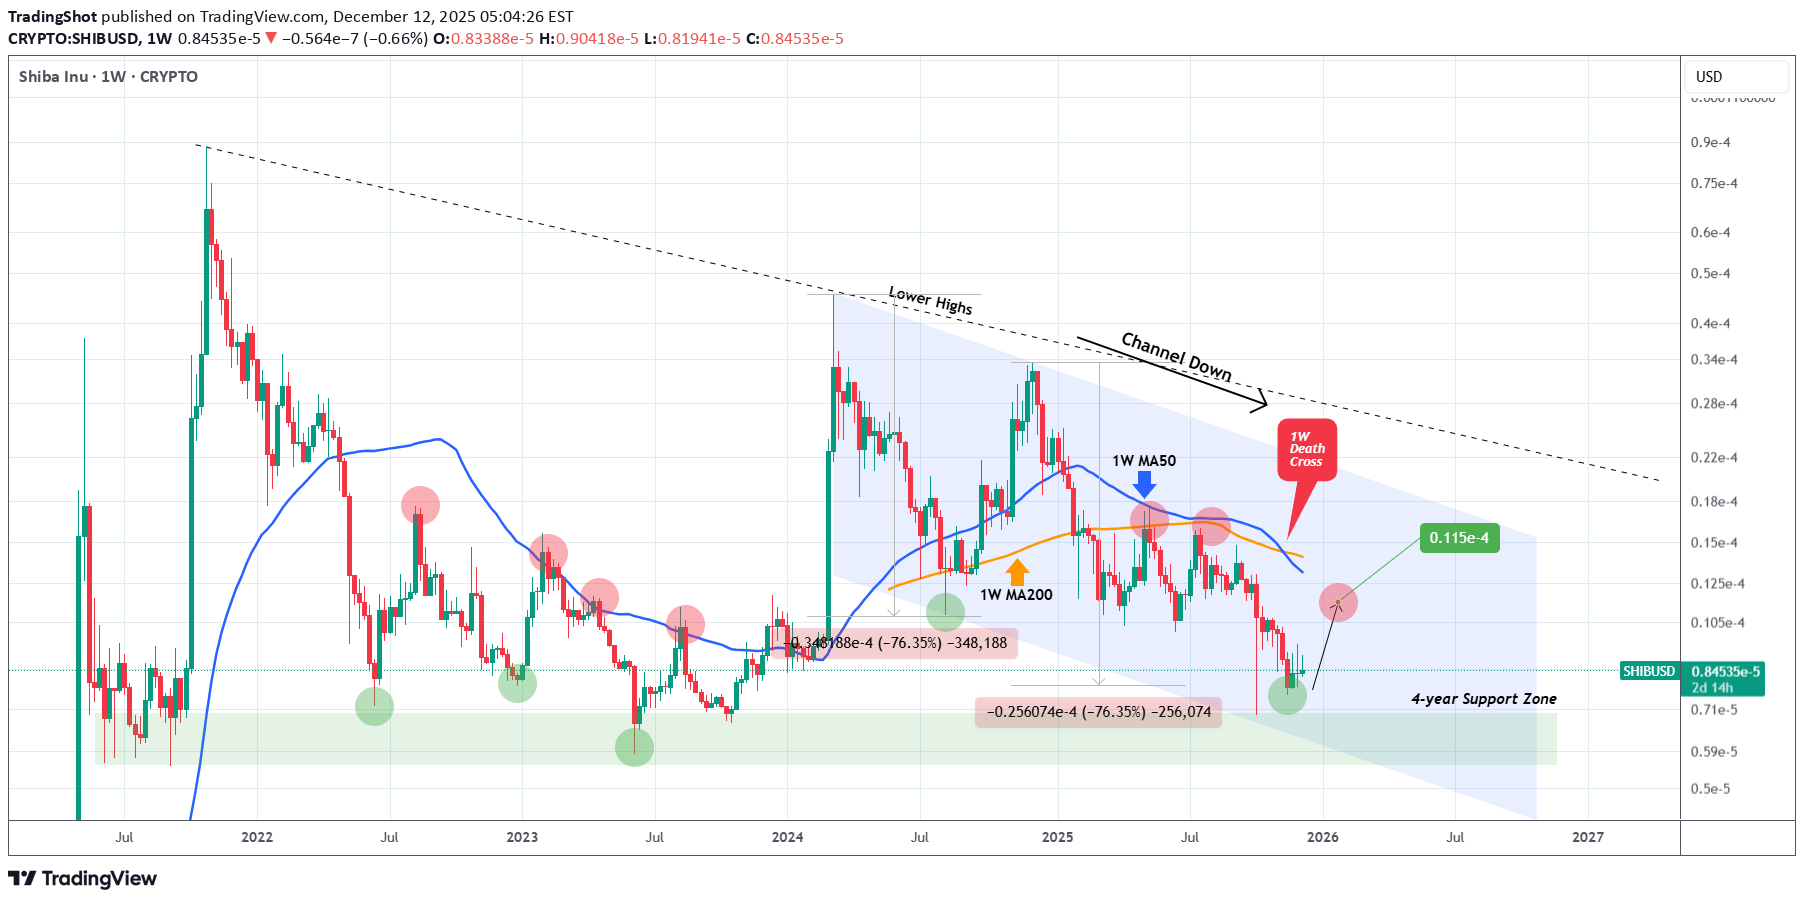
Shiba Inu (SHIBUSD) has been trading within a Channel Down since the March 2024 High, which was the former Bull Cycle's Top. 4 weeks ago it completed its first ever 1W Death Cross, potentially signaling a strong bearish extension for the current Bear Cycle. Until that happens, we have a short-term Buy Signal at our hands as not only did the Channel Down price a new Lower Low, thus technically granting the start of a new Bullish Leg, but this also took place on the 4-year Support Zone, which has been unbroken since May 2021. As you can see, this Zone has offered numerous long-term buy opportunities. As in 2022 and 2023, every such rebound though is limited/ restricted by the presence of the 1W MA50 (blue trend-line), which has been rejecting every test since January 20 2025 (almost 1 year). Based on that, unless we break the recent low, we expect SHIB to rally on the short-term and peak near the 1W MA50 at 0.0000115. --- ** Please LIKE 👍, FOLLOW ✅, SHARE 🙌 and COMMENT ✍ if you enjoy this idea! Also share your ideas and charts in the comments section below! This is best way to keep it relevant, support us, keep the content here free and allow the idea to reach as many people as possible. ** --- 💸💸💸💸💸💸 👇 👇 👇 👇 👇 👇
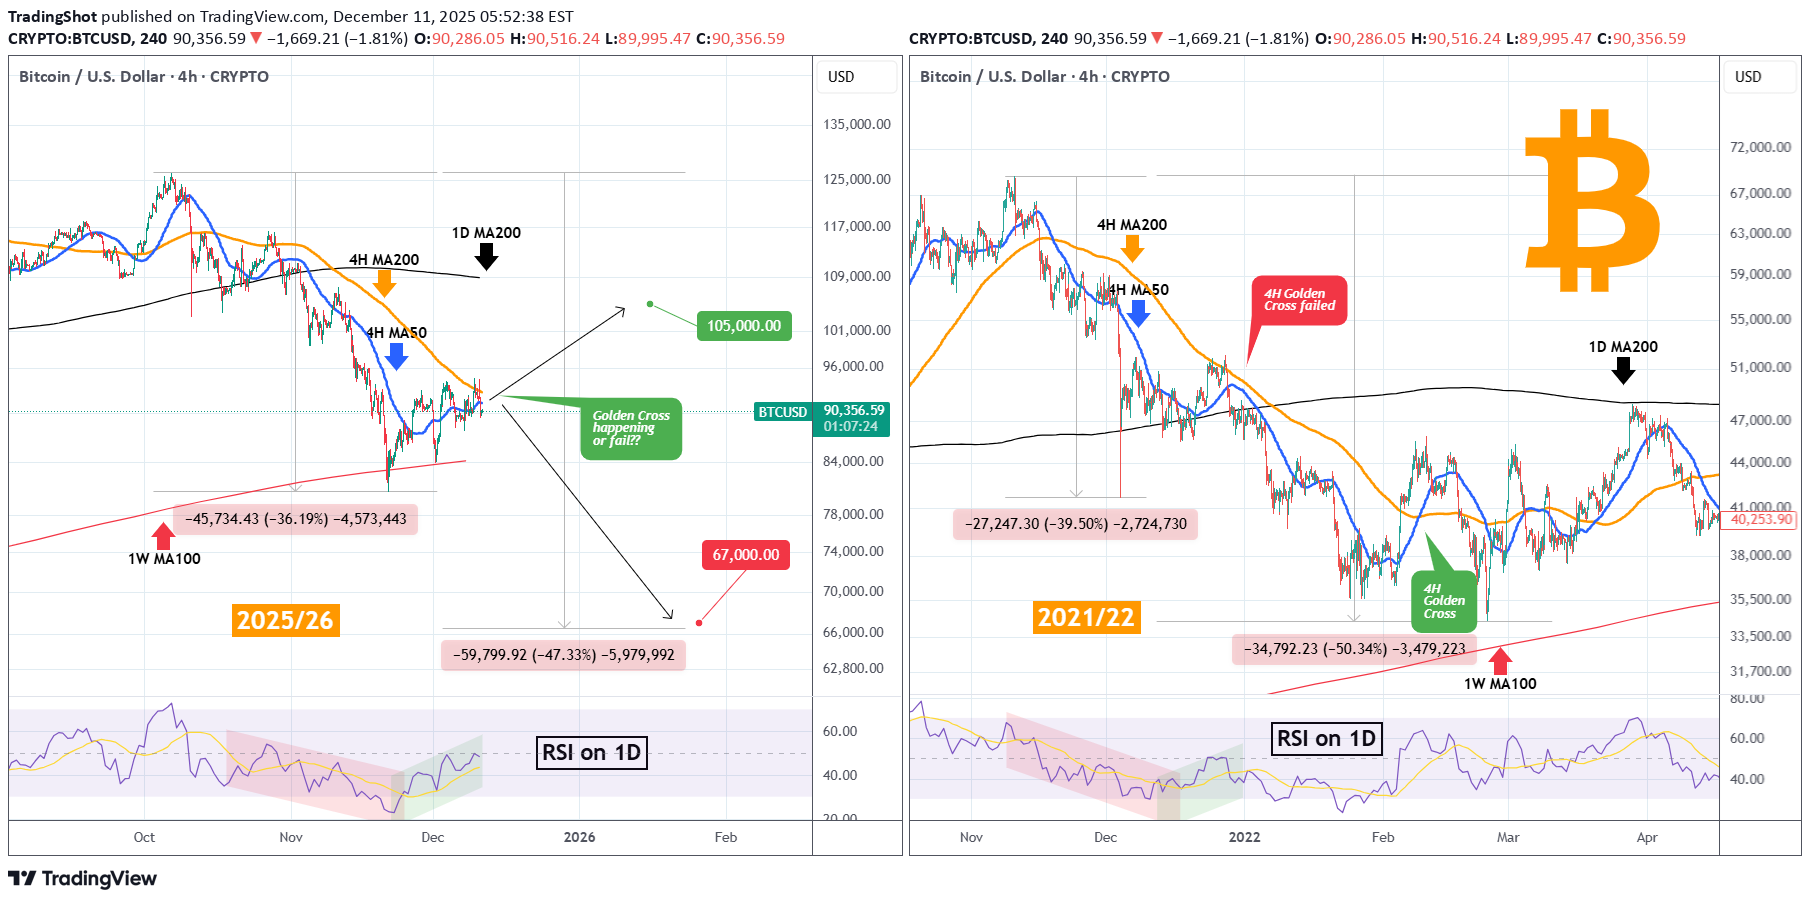
Bitcoin (BTCUSD) has been on a slow rebound following the 1W MA100 (red trend-line) test and is close to forming a 4H Golden Cross for the first time in more than 2 months. However a similar rebound attempt in December 2021, at the start of the BTC's previous Bear Cycle, after also dropping by -39.50% from the top (against today's -36.20%), failed to form a 4H Golden Cross the 'last minute' and the market resumed the bearish trend towards a new Low, completing a -50.34% total decline. So far the 1D RSI is similar to December 2021 but there is one key difference. Now Bitcoin has already tested its 1W MA100 (and rebounding) while on the previous Bear Cycle it only came close to it in February 2022. So will that favor and support the market for a little while and make that 4H Golden Cross or the 1D RSI and -36.20% identical drop fractal will push it lower? In the first case, the market will look for a 1D MA200 (black trend-line) test around $105k, which is what happened in March 2022, while in the second for a -47.30% total drop around $67000. One thing is for sure, if Bulls want to see some relief for some time, they have to defend that 4H Golden Cross. Which scenario do you think will prevail? Feel free to let us know in the comments section below! --- ** Please LIKE 👍, FOLLOW ✅, SHARE 🙌 and COMMENT ✍ if you enjoy this idea! Also share your ideas and charts in the comments section below! This is best way to keep it relevant, support us, keep the content here free and allow the idea to reach as many people as possible. ** --- 💸💸💸💸💸💸 👇 👇 👇 👇 👇 👇
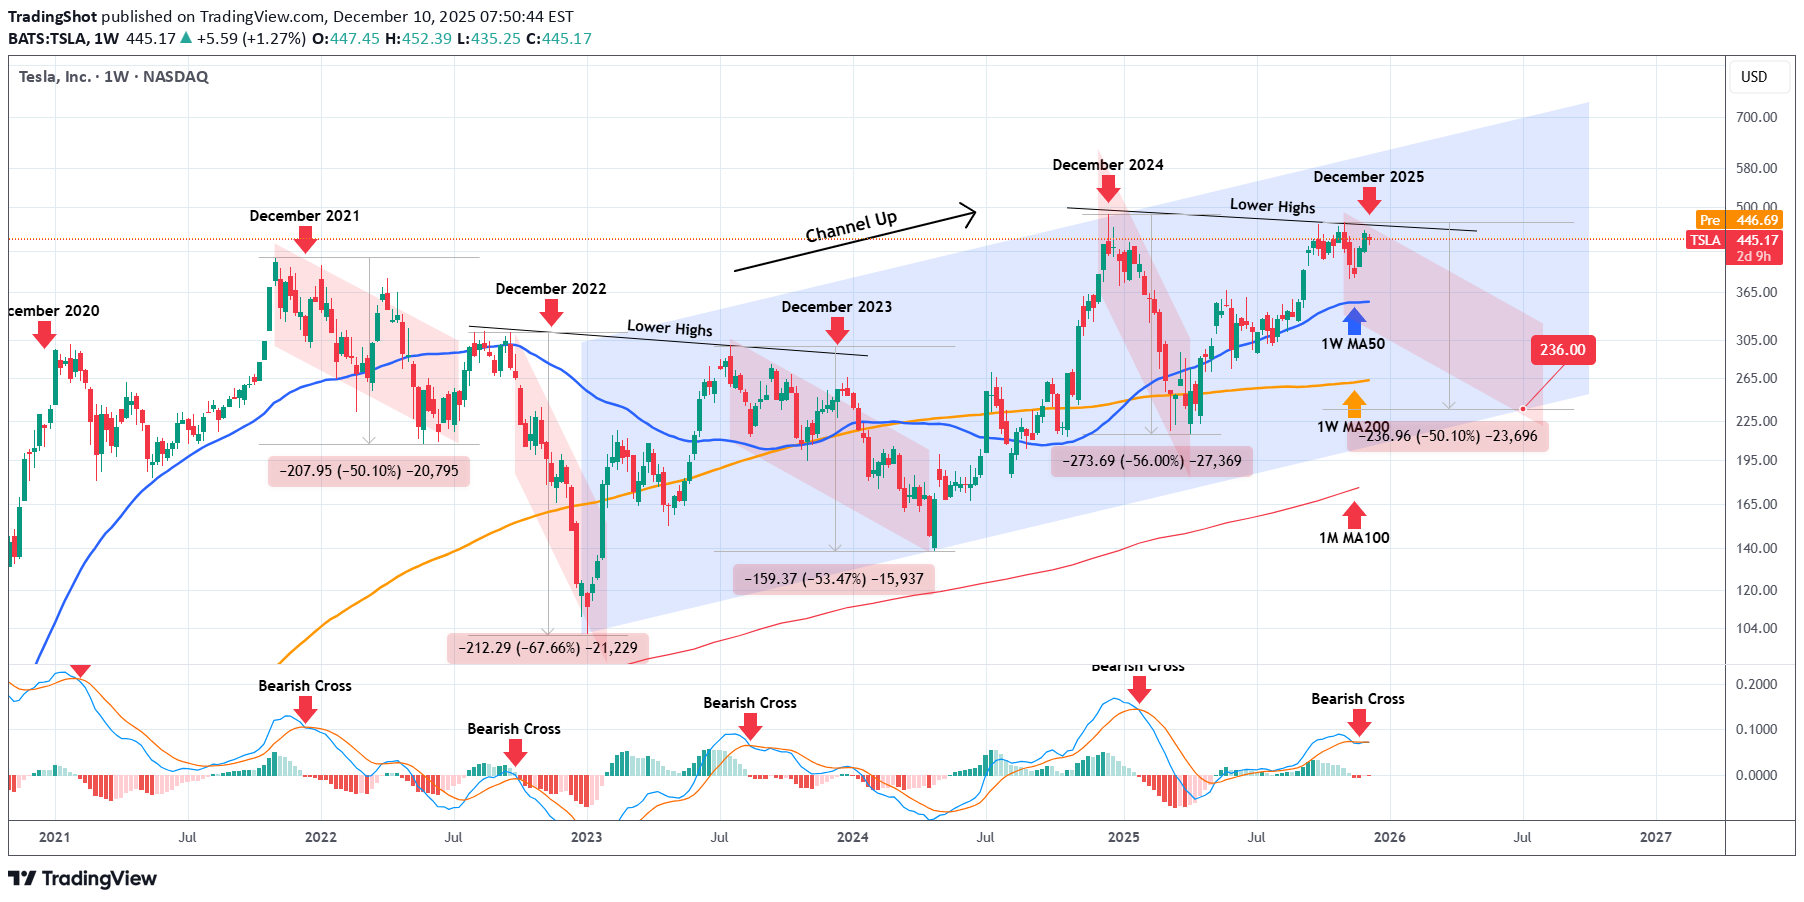
Tesla (TSLA) has been trading within a 3-year Channel Up and has been on a Bullish Leg since the April 07 market low. Not everything on its long-term outlook is positive though as December in the past 5 years, holds a bearish seasonality for the stock as it has aggressively declined. A 1W MACD Bearish Cross was always present during these times and so is today. With the price trading under a familiar Lower Highs trend-line as in 2023, we see strong probabilities that Tesla starts a new long-term correction. The minimum drop on these corrections has been -50% so a repeat of that would put the price exactly at the bottom of the Channel Up at $236, with only the 1M MA100 (red trend-line) in support. --- ** Please LIKE 👍, FOLLOW ✅, SHARE 🙌 and COMMENT ✍ if you enjoy this idea! Also share your ideas and charts in the comments section below! This is best way to keep it relevant, support us, keep the content here free and allow the idea to reach as many people as possible. ** --- 💸💸💸💸💸💸 👇 👇 👇 👇 👇 👇
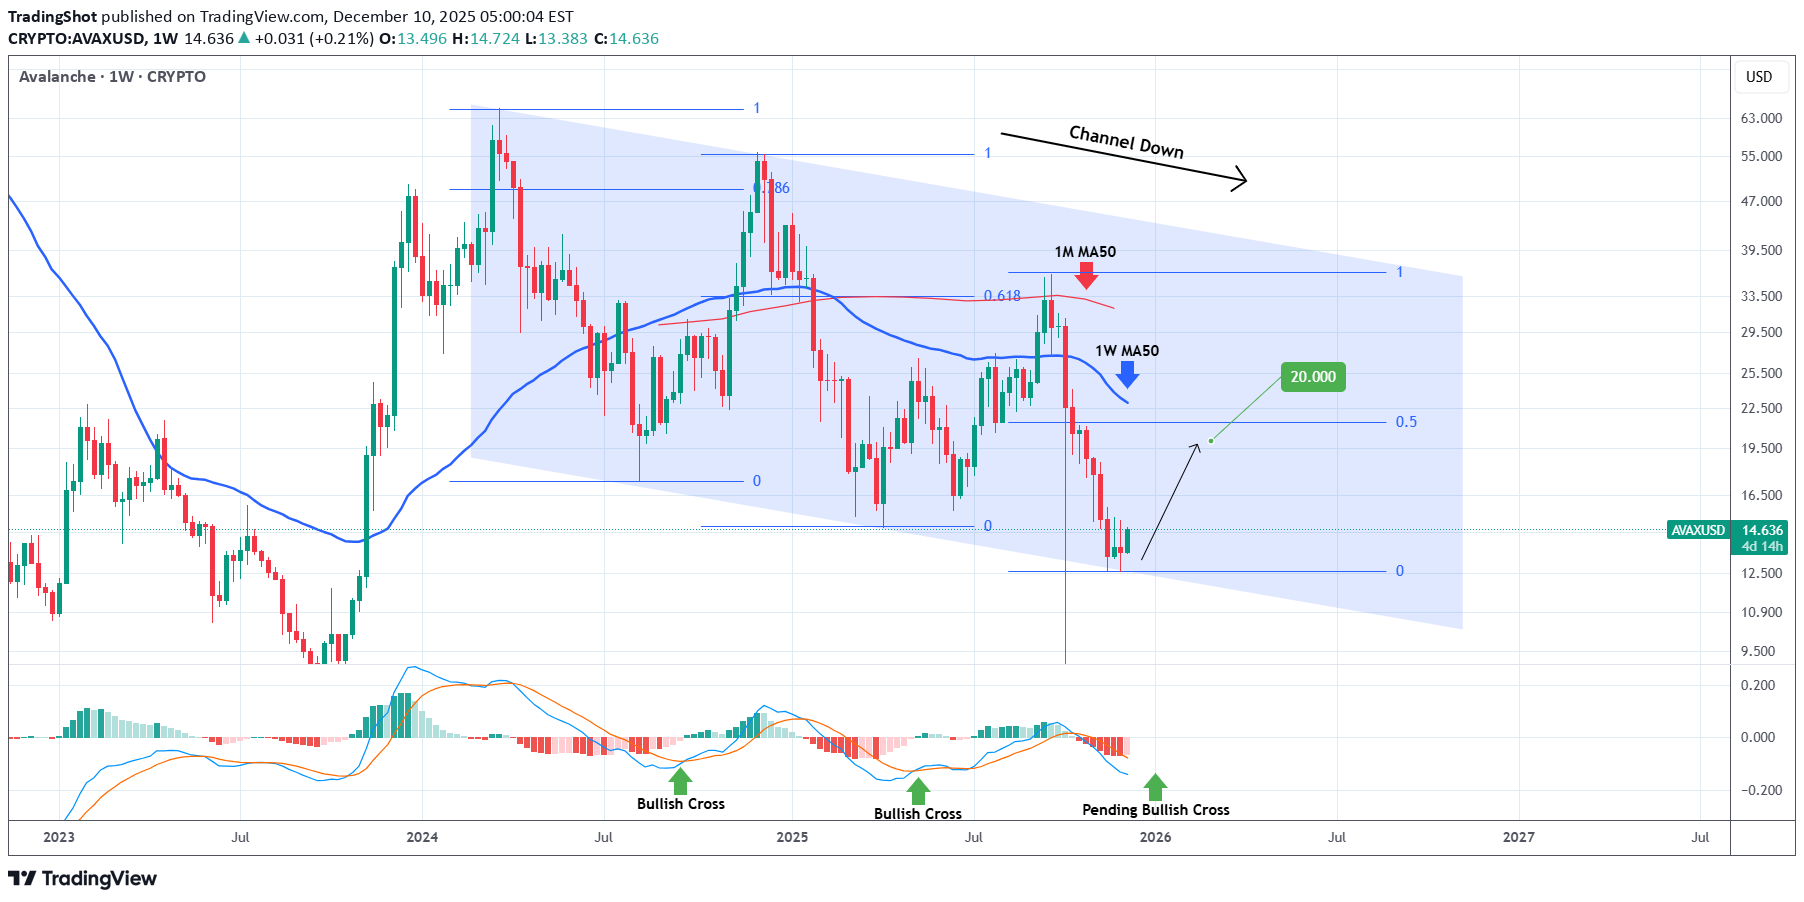
Avalanche (AVAXUSD) has been trading within a 2-year Channel Down which made a Lower Low bottom 3 weeks ago. The price has since then traded sideways, potentially in an attempt to price a technical Support base. If the market doesn't break below this, there are high probabilities to see this pattern initiating a new Bullish Leg. The previous two Bullish Legs showed a declining rate on their rallies with the first hitting the 0.786 Fibonacci level but the second being only able to hit the 0.618 Fib. If this decreasing rate continues, we shouldn't go much further than the 0.5 Fib this time. With the 1W MA50 (blue trend-line) and the 1M MA50 (red trend-line) posing as the two main Resistance levels of this Bear Cycle, we place our Target below at $20.000. --- ** Please LIKE 👍, FOLLOW ✅, SHARE 🙌 and COMMENT ✍ if you enjoy this idea! Also share your ideas and charts in the comments section below! This is best way to keep it relevant, support us, keep the content here free and allow the idea to reach as many people as possible. ** --- 💸💸💸💸💸💸 👇 👇 👇 👇 👇 👇
BITCOIN Why nobody talks about this??
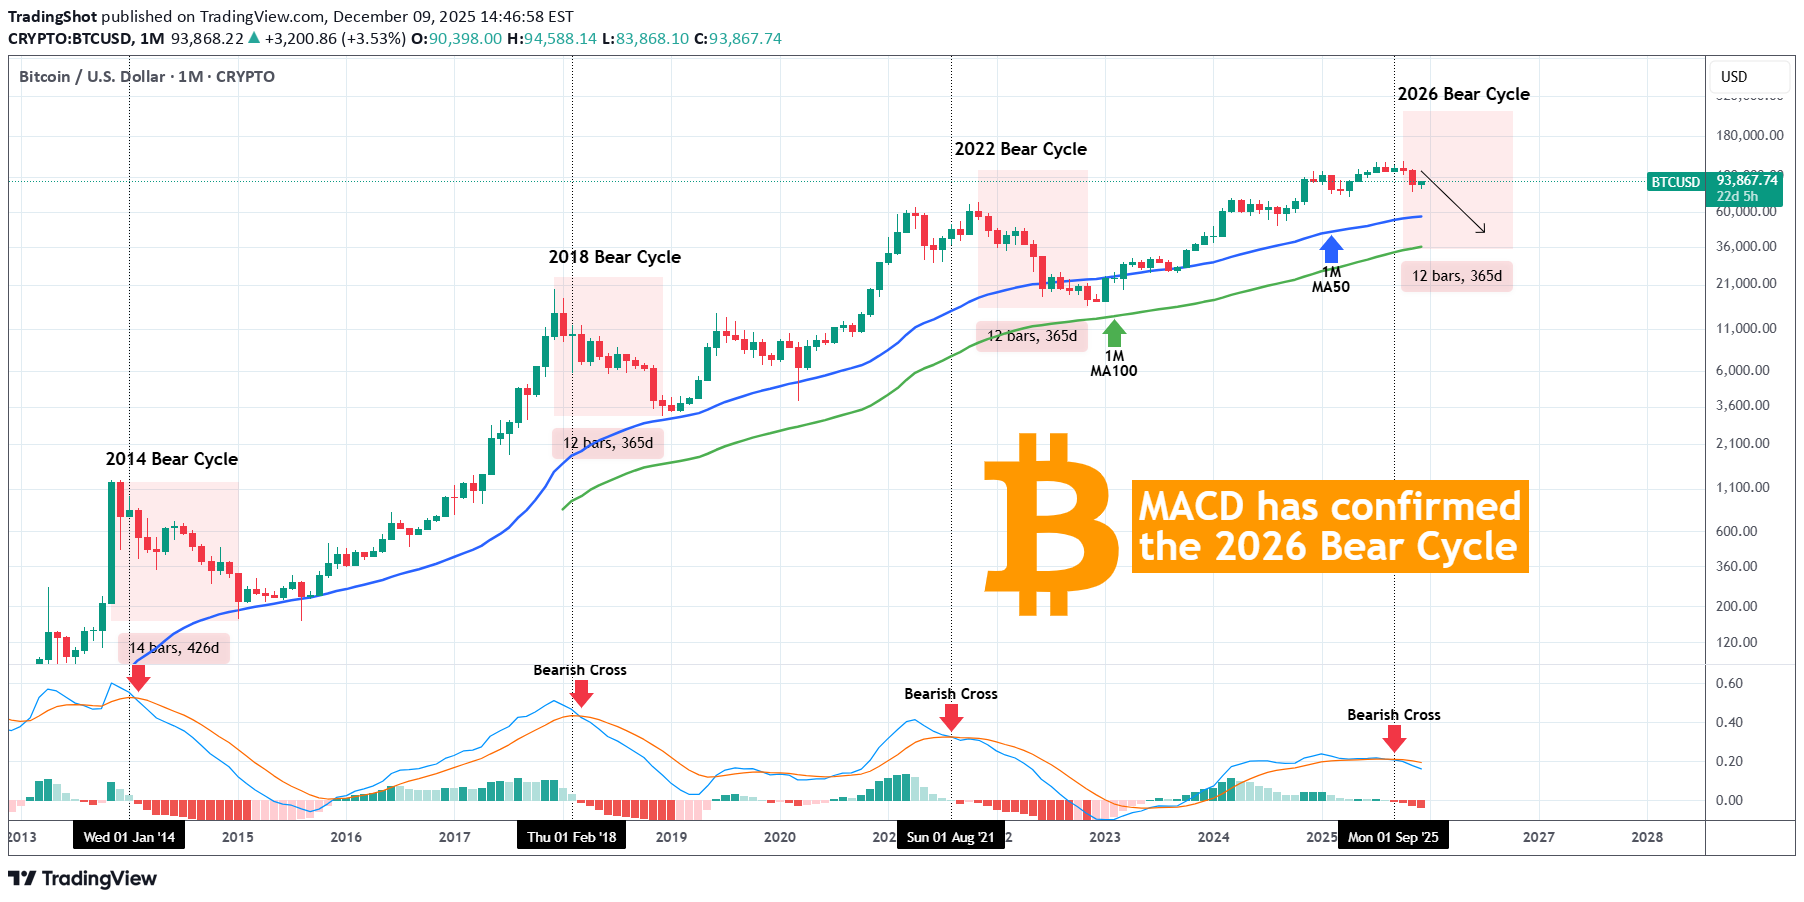
That was the last indicator standing and now it is as clear as it can get. With last month's candle close, Bitcoin (BTCUSD) has confirmed that it has already started a new Bear Cycle. The reason is simple and it is one of the most basic trading indicators out there. The 1M MACD was already on a Bearish Cross since October, and November's closing widened the gap to such extent that it is not recoverable anymore. This has happened every time during a BTC Bear Cycle and in two of the past three cases, it took place while already on the Bear Cycle. History has shown that there is no coming back from this and BTC should start looking for the 1M MA50 (blue trend-line) - 1M MA100 (green trend-line) Zone. If all the Bear Cycle indicators we've shown on analyses since September were early signs, the MACD is conclusive and as mentioned, has confirmed it. But what do you think? Has the MACD Bearish Cross confirmed the new Bear Cycle beyond any doubt? Feel free to let us know in the comments section below! --- ** Please LIKE 👍, FOLLOW ✅, SHARE 🙌 and COMMENT ✍ if you enjoy this idea! Also share your ideas and charts in the comments section below! This is best way to keep it relevant, support us, keep the content here free and allow the idea to reach as many people as possible. ** --- 💸💸💸💸💸💸 👇 👇 👇 👇 👇 👇
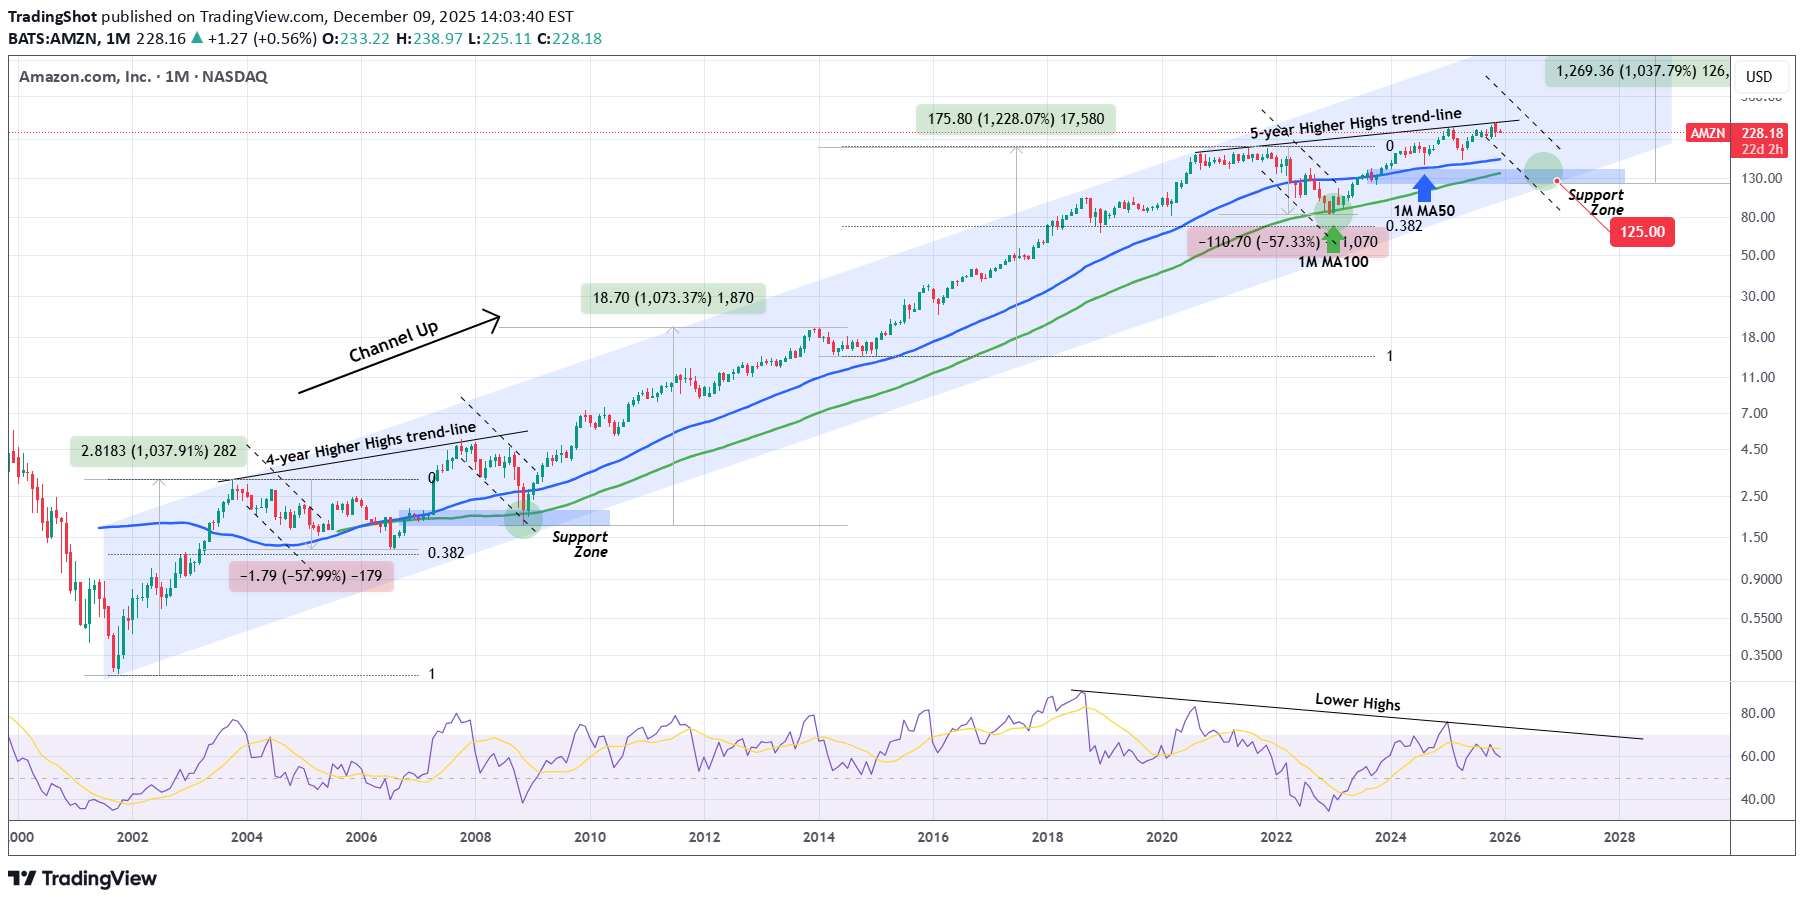
Amazon Inc. (AMZN) has been trading within a massive 24-year Channel Up ever since its October 2001 bottom of the Dotcom crash. This pattern, as you can see, has been following a very distinct structure with its 1M MA100 (green trend-line) being the major Support level (and providing the most efficient buy opportunities) since November 2006. What stands out here is the period from late 2020 until today and how it resembles the one from late 2003 to late 2007. Both traded under multi-year Higher Highs trend-lines and in October 2007 that formed a Top, causing a 2nd correction within that time-frame that bottomed once it hit the 1M MA100 within the Support Zone of the previous consolidation phase. Today's fractal has already made the 1st correction in 2022, which not surprisingly also bottomed on the 1M MA100 and kick-started the rally towards the Higher Highs trend-line again. We are now at the point where there are high probabilities that the 2nd correction will take place. If the market continues to follow the past pattern, we expect Amazon to bottom below the 1M MA100 this time and at the bottom of the Support Zone within the $130.00 - $125.00 range. This will make an ideal Higher Low right at the bottom of the 24-year Channel Up. So what can make you rich on this? Making a long-term buy of course and keeping it until 2030 - 2032 as the new Bullish Leg that will start, will effectively be the new Bull Cycle. And as this chart shows, these Cycles have had similar rises, with the 'weakest' one being +1037%. --- ** Please LIKE 👍, FOLLOW ✅, SHARE 🙌 and COMMENT ✍ if you enjoy this idea! Also share your ideas and charts in the comments section below! This is best way to keep it relevant, support us, keep the content here free and allow the idea to reach as many people as possible. ** --- 💸💸💸💸💸💸 👇 👇 👇 👇 👇 👇
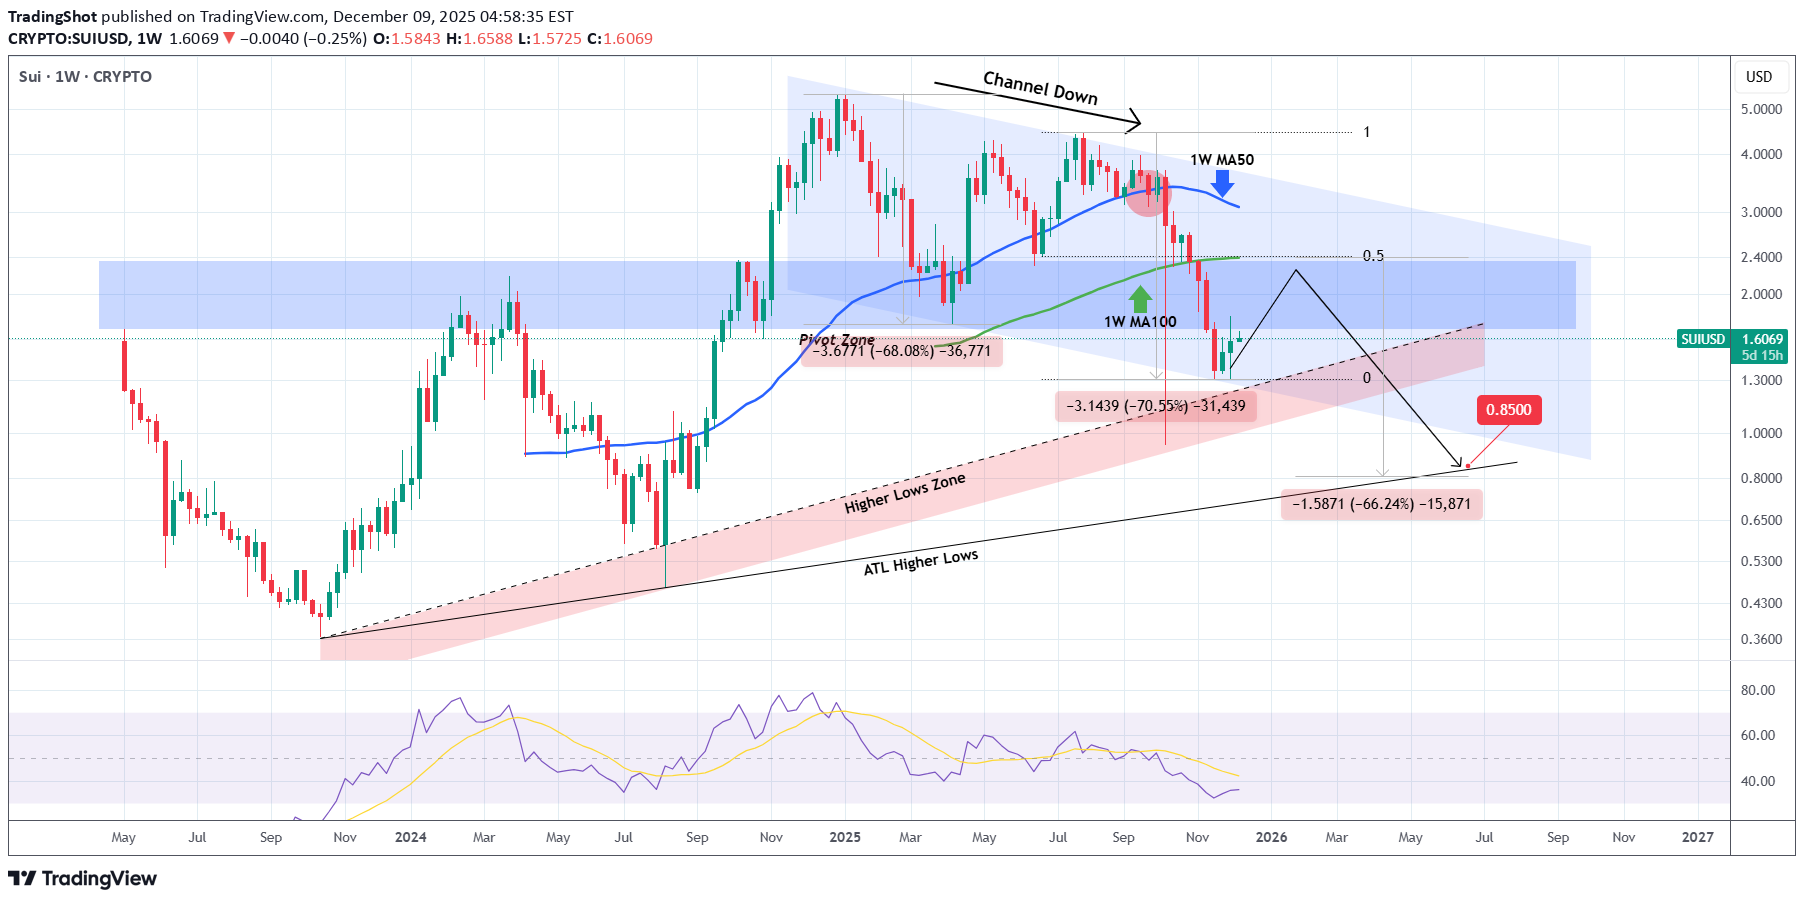
A month ago (November 05, see chart below) we gave a strong sell signal on Sui (SUIUSD), targeting 1.4320 right at the bottom of its 1-year Channel Down: The price made direct contact with the pattern's bottom (thus hitting our Target) and rebounded, pricing a Lower Low. Right now the market is in the process of forming the Bullish Leg of the Channel Up (1W RSI almost got oversold also), which we don't expect to be completed like the previous one as this is a dead-cat bounce at the time, limited by the 1W MA50 (blue trend-line), which is technically the Resistance during Bear Cycles. The 0.5 Fibonacci retracement level is also at a cluster level were the 1W MA50 could reject this bounce along with the 1W MA100 (green trend-line). We believe that the next Bearish Leg will likely break below the Channel Down and target the All Time Low Higher Lows trend-line around 0.8500, which will be a -66.00% decline from the top, similar to the previous two selling sequences. --- ** Please LIKE 👍, FOLLOW ✅, SHARE 🙌 and COMMENT ✍ if you enjoy this idea! Also share your ideas and charts in the comments section below! This is best way to keep it relevant, support us, keep the content here free and allow the idea to reach as many people as possible. ** --- 💸💸💸💸💸💸 👇 👇 👇 👇 👇 👇
Disclaimer
Any content and materials included in Finbeet's website and official communication channels are a compilation of personal opinions and analyses and are not binding. They do not constitute any recommendation for buying, selling, entering or exiting the stock market and cryptocurrency market. Also, all news and analyses included in the website and channels are merely republished information from official and unofficial domestic and foreign sources, and it is obvious that users of the said content are responsible for following up and ensuring the authenticity and accuracy of the materials. Therefore, while disclaiming responsibility, it is declared that the responsibility for any decision-making, action, and potential profit and loss in the capital market and cryptocurrency market lies with the trader.