
Trading_Soldier
@t_Trading_Soldier

What symbols does the trader recommend buying?
Purchase History
Trader Messages
Filter
Message Type
Trading_Soldier
Litecoin on ETF LTCC Approval day... Both sides rekt -10%
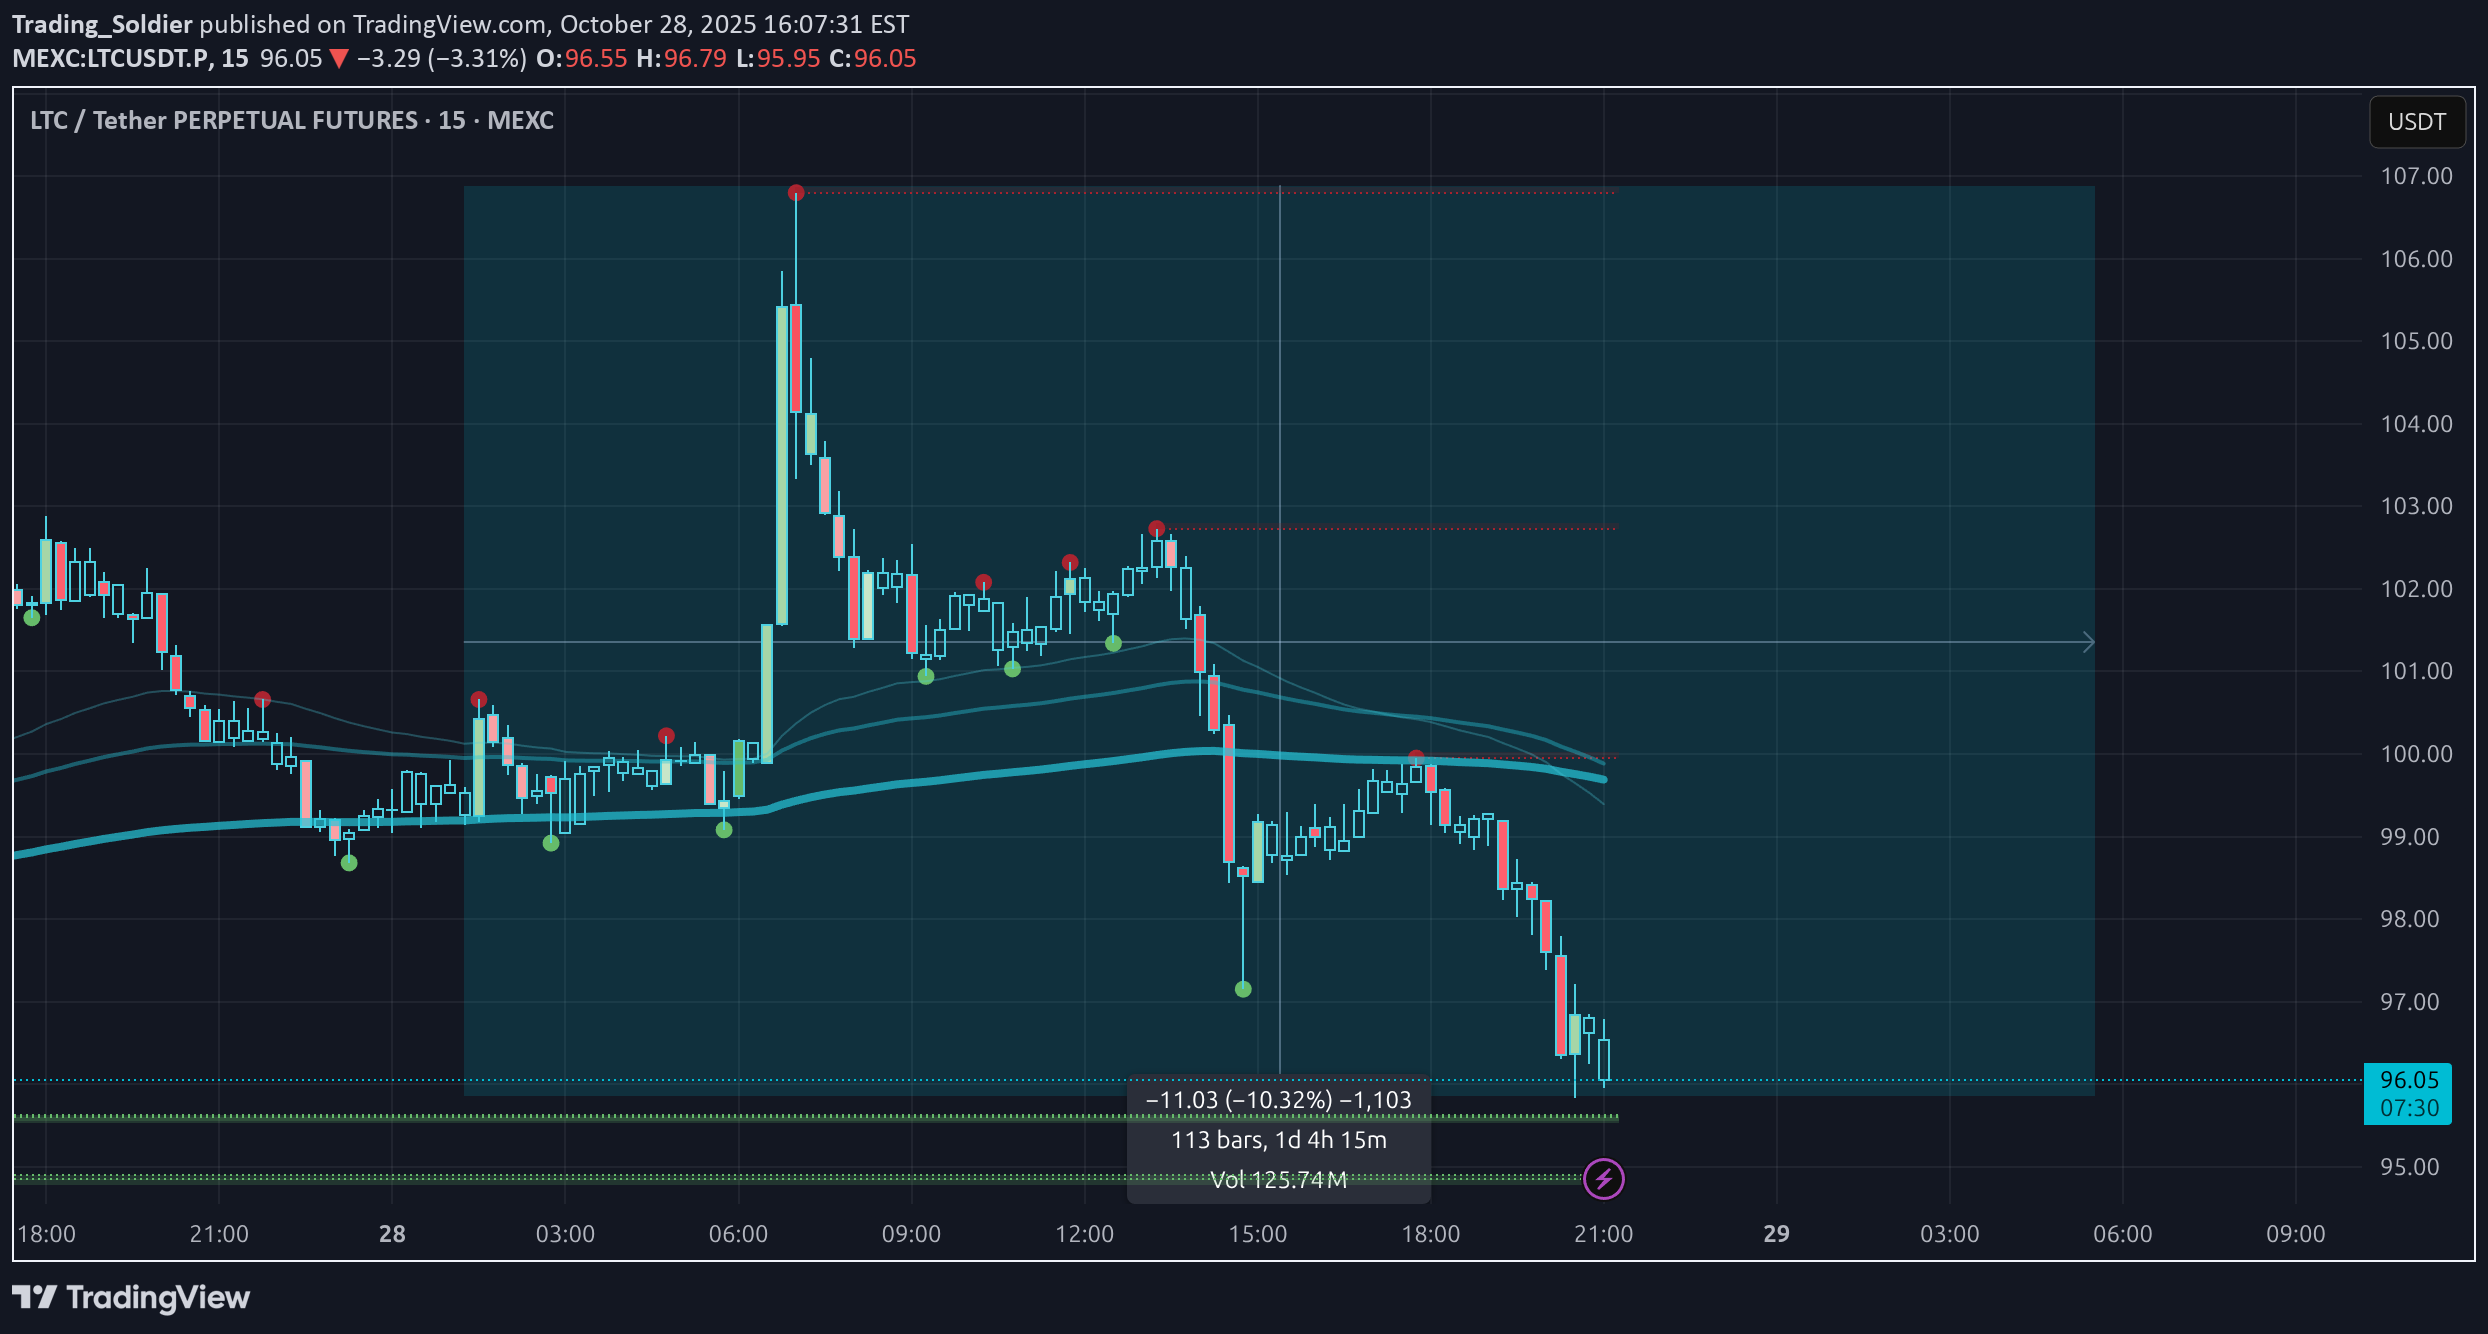
LTC started trading today on Wall Street...Guess what! -10% on the daily, and both sides rekt, shorts and longs. Litecoin as always, doing what it does best. Wreking people who trades the coin. Fading every move is the way. No sustainable trends allowed on this coin. It will have some demand becaise of ETF approval? Who knows, but it will be fun to see TradFi guy trying to trade Litecoin.
Trading_Soldier
Litecoin to $400... Just not yet moonboy!
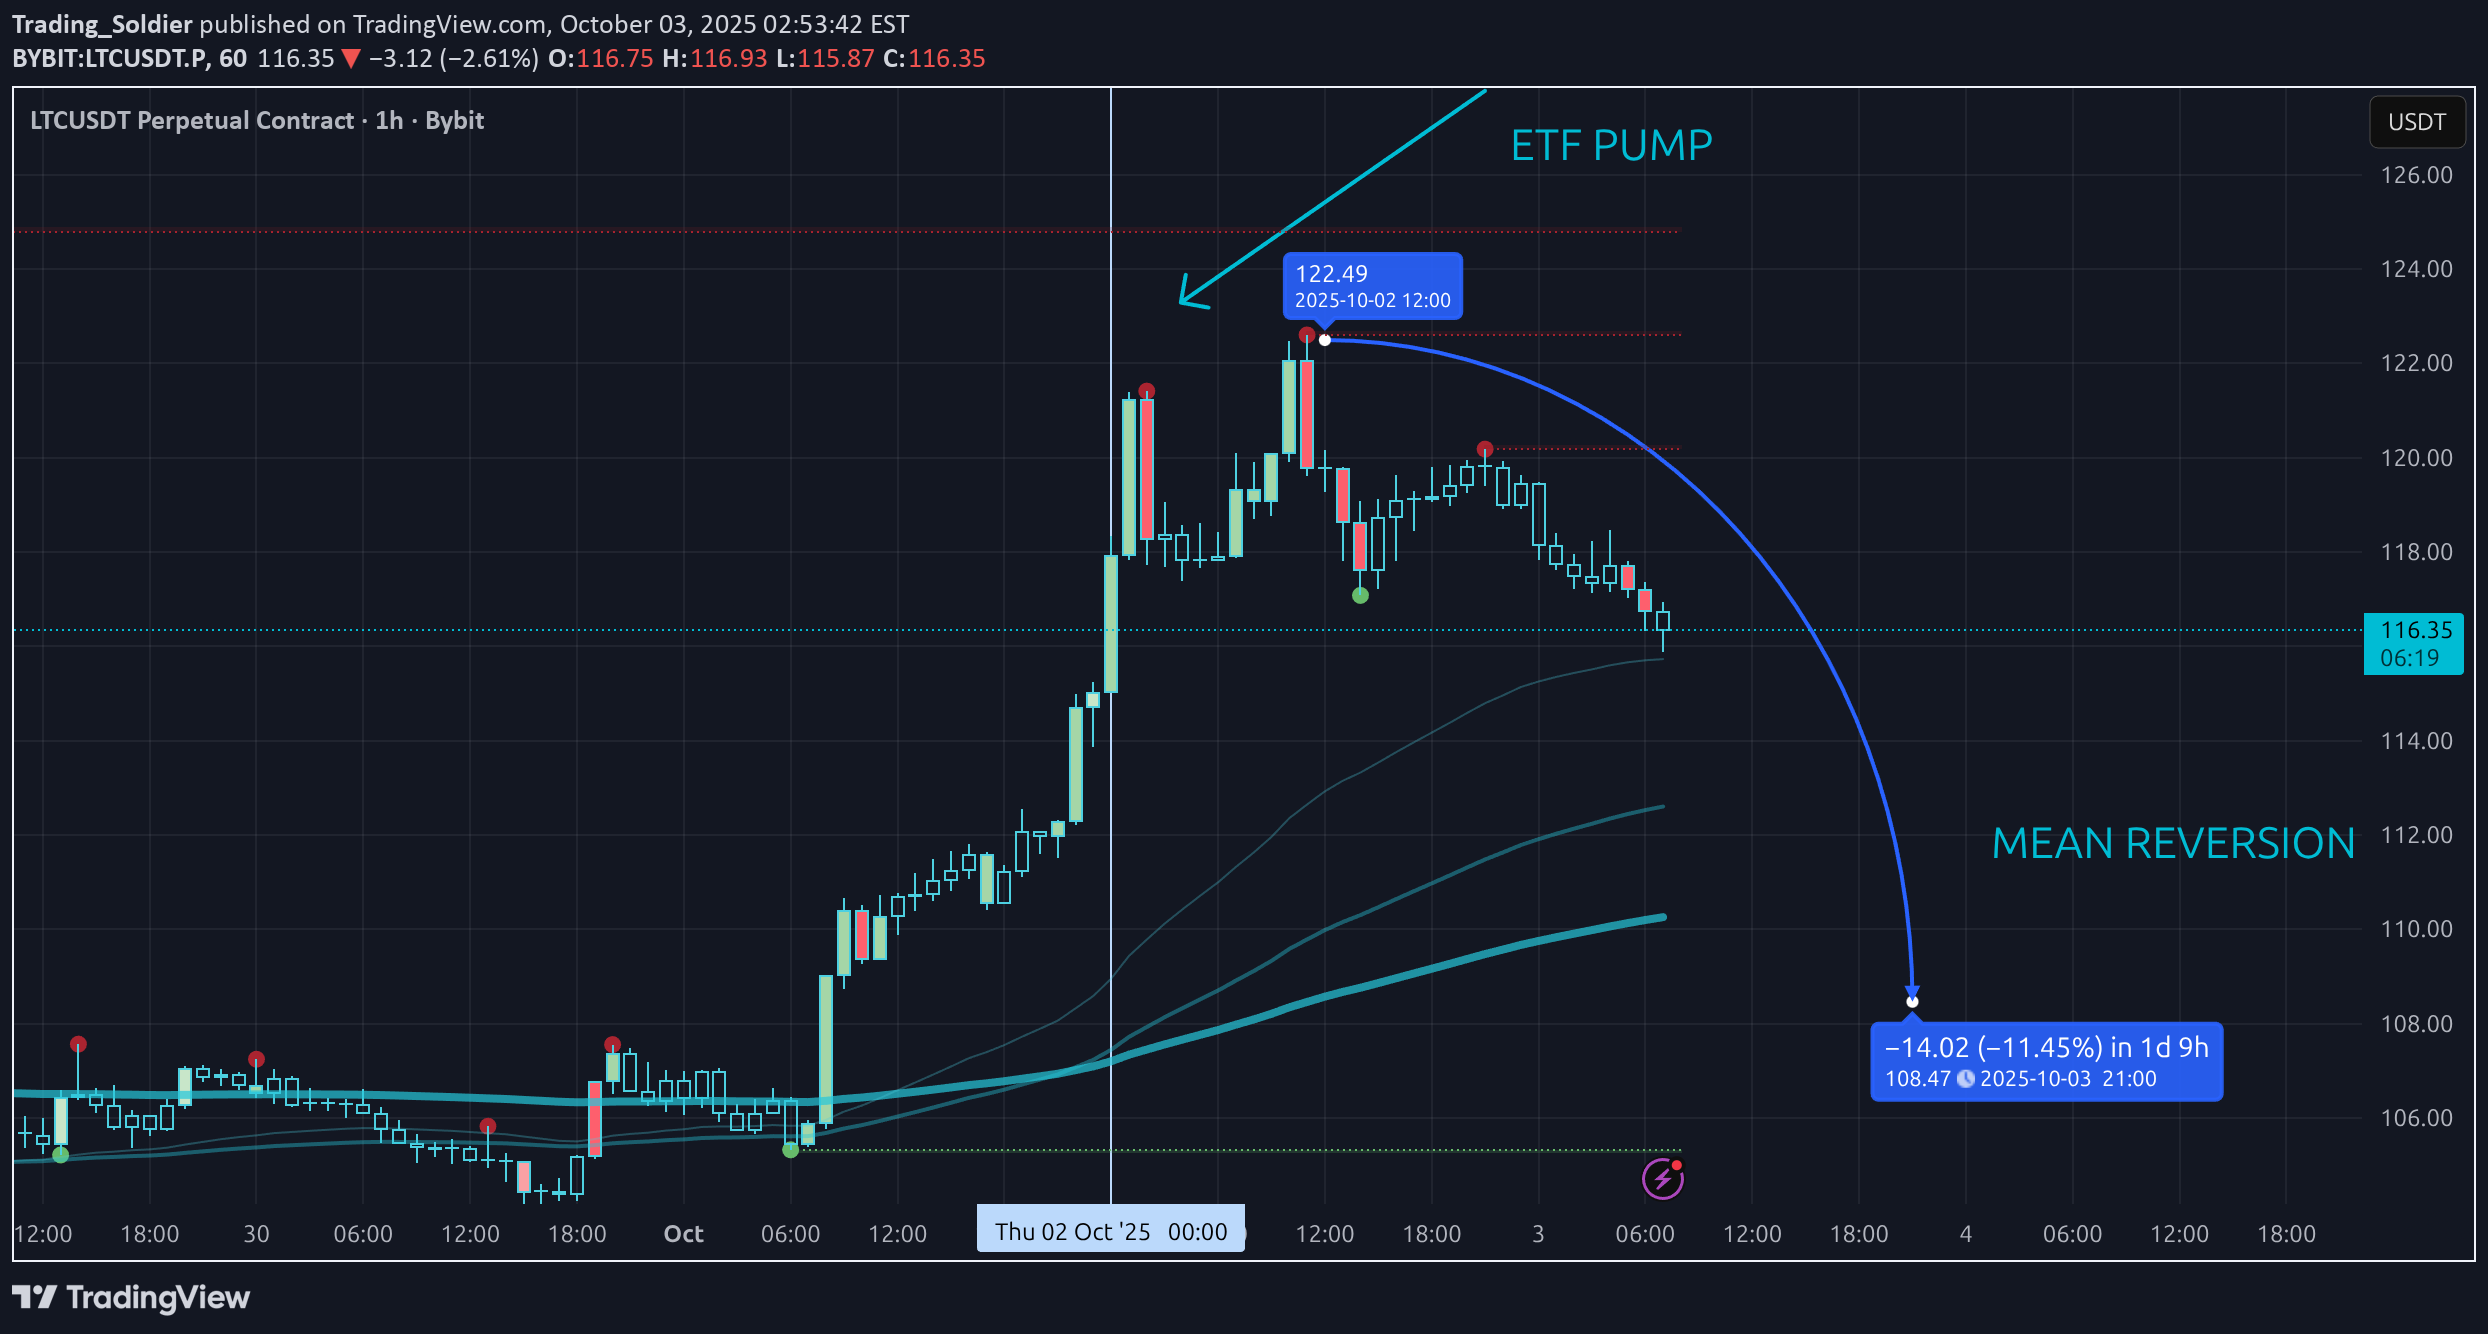
Yesterday (Oct 2, 2025) was supposed to be the big day for the Canary Funds LTC ETF. With the government shutdown stalling agencies, the SEC didn’t issue an approval, so the “event” turned into a non-event. Meanwhile seasonality kicked in—Q4 is often bullish—and we got the standard “new month/new quarter” squeeze across crypto. LTC tagged ~$122, then started giving it back. We’re roughly ~6% off the spike already as late longs get forced out. Here’s how I see it: Higher time frames look constructive. On the 4H/D1 charts, structure shows a bullish reversal after August’s washout. Price held the daily 200 EMA near $100 on the last retest and pushed up cleanly. That’s the anchor for any continued upside. Lower time frames need a reset. On the 1H, this was a textbook overextension. I’m expecting mean reversion back toward the 1H 200 EMA / prior breakout before any sustainable leg higher. Don’t get bullish into the wick highs—wait for pullbacks. Levels I’m watching Support: $108–$105 first, then the $100–$95 zone (daily 200 EMA). Lose that area with acceptance and LTC can do what it loves—round-trip—bringing $80 → $70–$65 back into view. Resistance: $122–$125 intraday supply, then the $135–$140 pocket near the descending trendline. A clean break/hold above $140 opens the door to $150. Bottom line: Short-term, I’m bearish into a pullback as price reverts toward the mean. On 4H/D1, I’m still bullish as long as $100–$95 holds—if we base there, I like the $140 magnet later this quarter. Just remember: Litecoin is notorious for mean-reverting. Trade the pullbacks; don’t chase the spikes.
Trading_Soldier
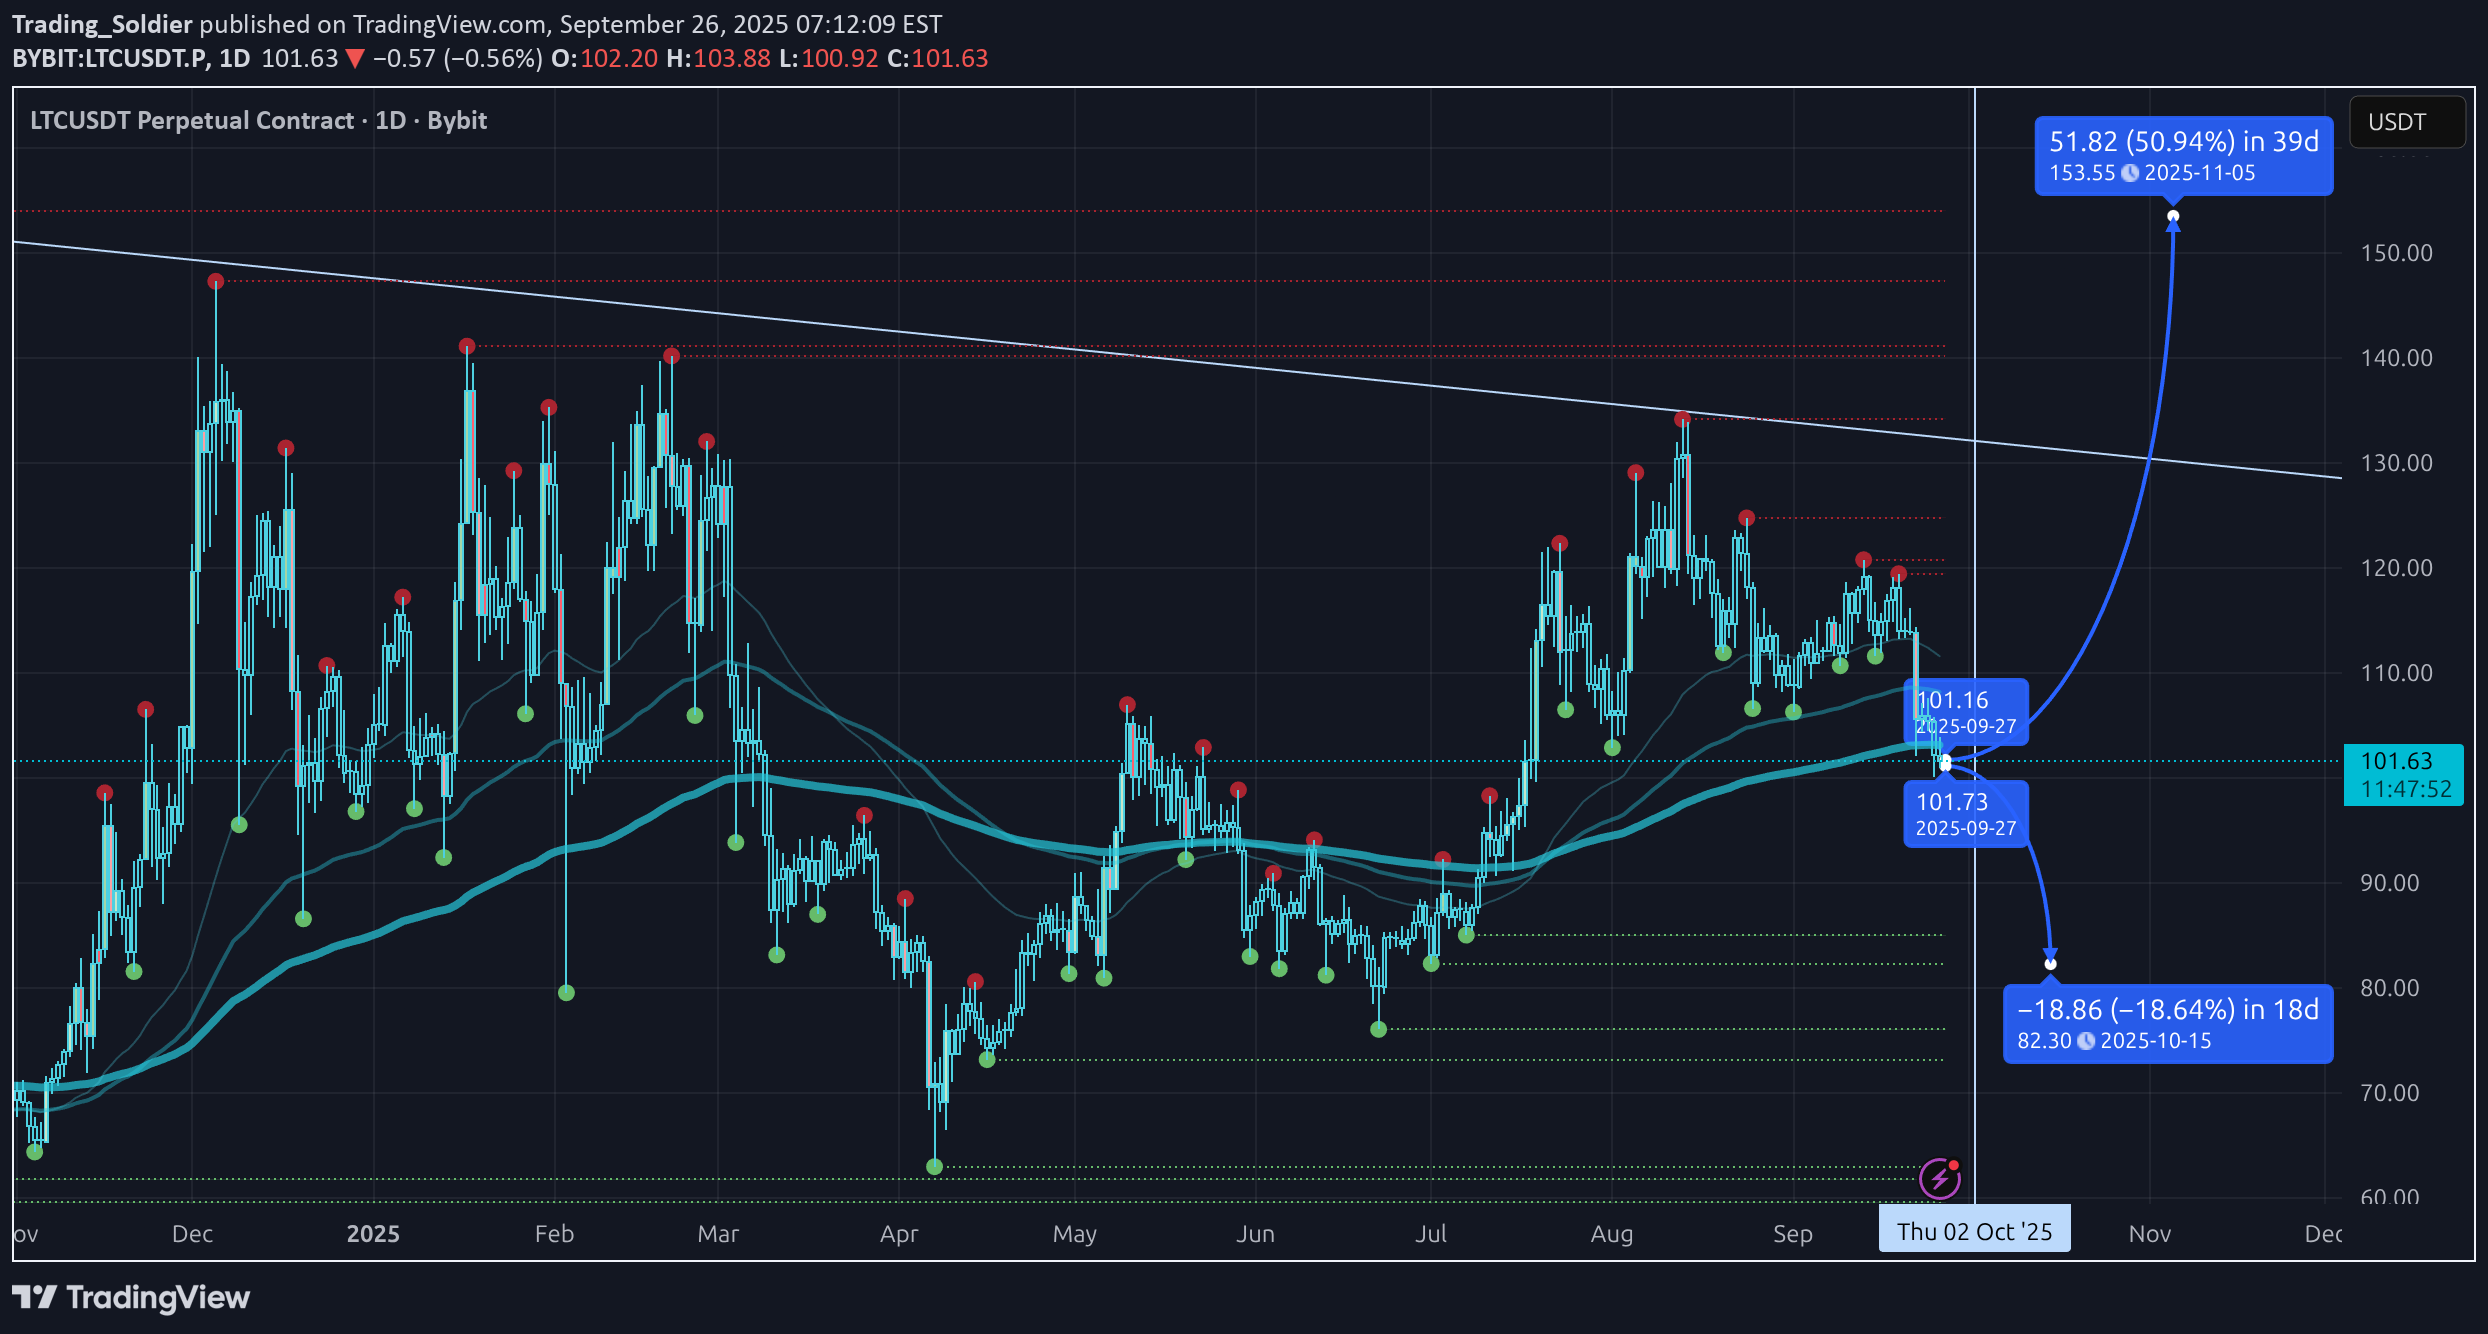
Litecoin did what Litecoin always does: ripped on big headlines, went sideways, and then gave most of it back. Around the election/ETF chatter we saw that spike, then the whole move basically round-tripped. LTC LTCUSDT is a mean-reverting machine—great for quick trades, a pain in the ass to hold when the music stops. Zooming in to now: since the April lows we built up, corrected, built up again into the Aug 13th ~$130 high, and we’re back in correction mode. On the daily, price is sitting on the 200 EMA (right around the psychological $100 area). That’s my line in the sand. Lose the 200 EMA and the $100/$95 shelf, and I think we’re staring at the classic LTC full round-trip into $80 → $70–$65. That would basically unwind the whole April→August leg—again. On the chart you can also see the macro descending trendline capping every pop (look how those red swing-high dots keep failing under it). Structure still hasn’t reclaimed the December 2024 highs, so bigger picture it’s still a downtrend until proven otherwise. For context, Litecoin has been compressing in a wide $65–$140 range for almost four years. Everyone wants the breakout to $200–$500…but the chart hasn’t confirmed a thing. Now, we’ve got the Oct 2, 2025 ETF deadline hanging over this. Two ways this can play out: Bear case (my concern right now): institutions bought April/June, sold the August euphoria to retailers, and are slowly unloading into every bounce while the narrative machine runs hot. That would explain why price can’t hold above the 200 EMA even with “bullish” headlines everywhere. If we lose $100/$95 with acceptance, I’m looking for that mean-reversion magnet at $70–$65 after a stop at $80. Bull case (needs confirmation): we hold the 200 EMA, ETF news hits positive, and price squeezes back through $120 and on toward $140–$150. That would be the first clean step toward breaking the four-year range, but it still has to beat the trendline overhead. Until then, it’s just another rally into resistance. Sentiment is noisy: Charlie Lee back on pods, the official accounts pushing hard, maxis loud on X—yet price isn’t following. When expectations are this high and the chart lags, it often means someone smarter is selling into it. Maybe I’m wrong and ETF demand lights the fuse—great, I’ll cheer it on—but next week feels like last resort. If LTC can’t bounce from the 200 EMA into the deadline, and instead rolls under $95, it likely does what it loves most: round-trip the pump. Bottom line: 200 EMA = line in the sand. Hold it and maybe we squeeze toward $140–$150. Lose it, and the path of least resistance is $80 → $70–$65. The chart, not the headlines, will tell us which one it is.
Trading_Soldier
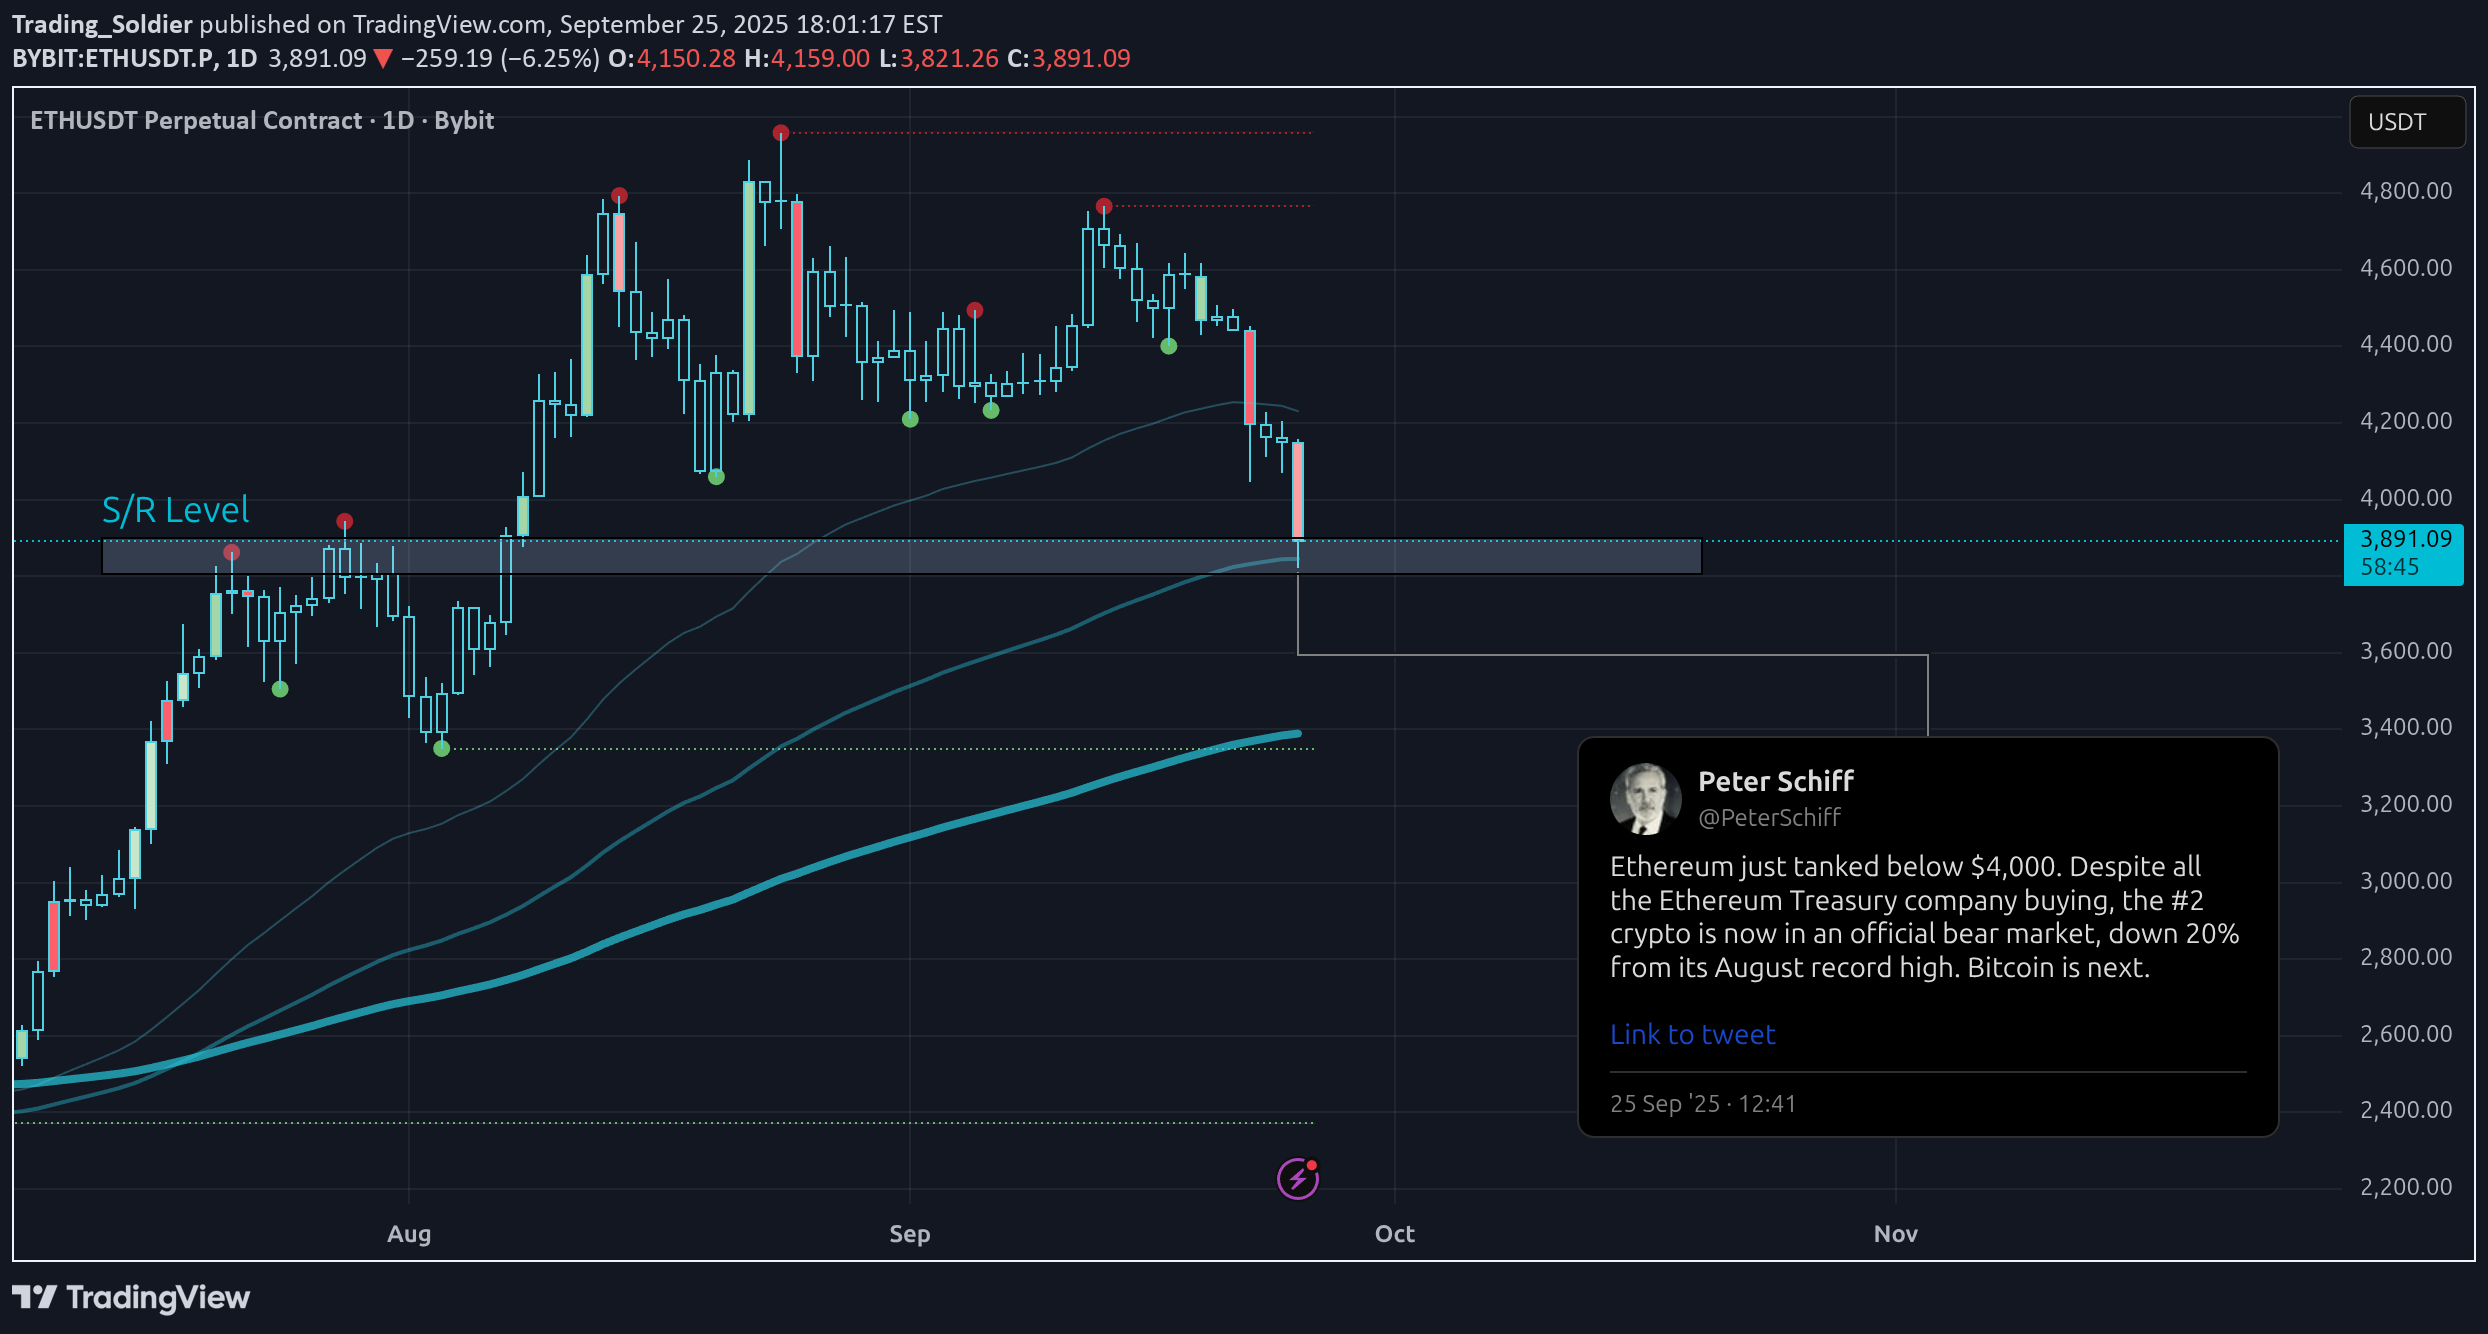
Interesting to see FUD at S/R levels Short support & sell the bottom Trade your charts not others opinions
Trading_Soldier
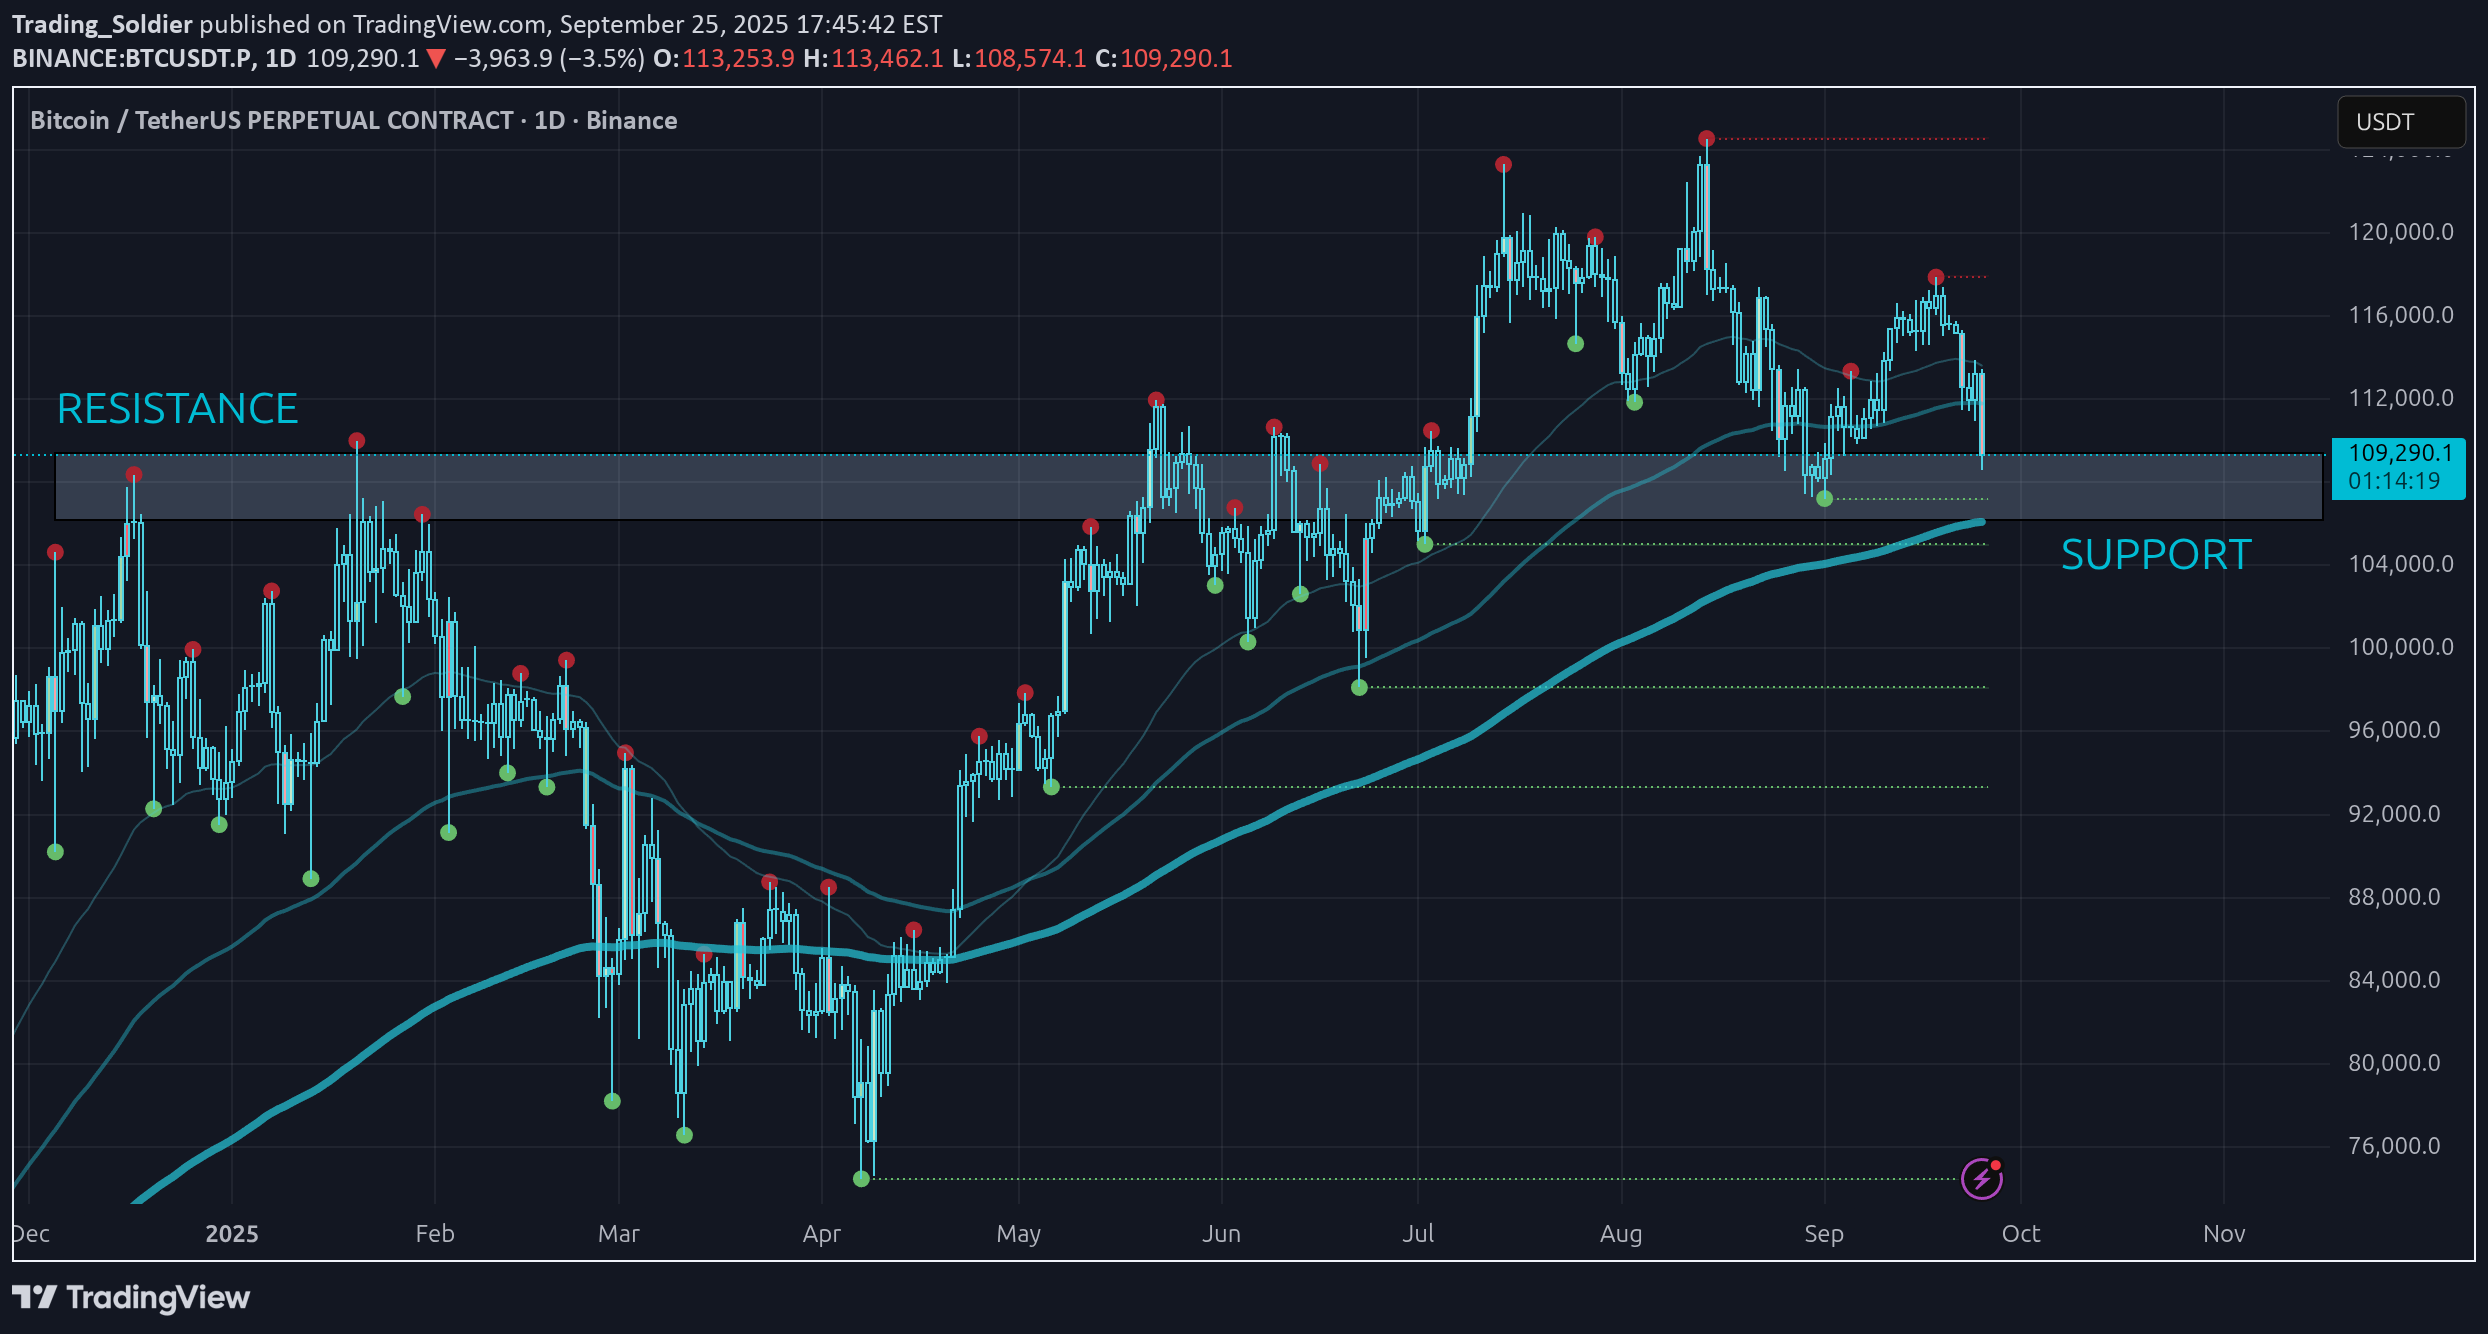
Previous resistance often times flips and becomes support. BTC is safe until we hold the gray box. Candles closing below the gray box will be bearish confirmation. Lots of confluence there as with 200EMA on D1 acting as dynamic support level. BTCUSDT.P
Trading_Soldier
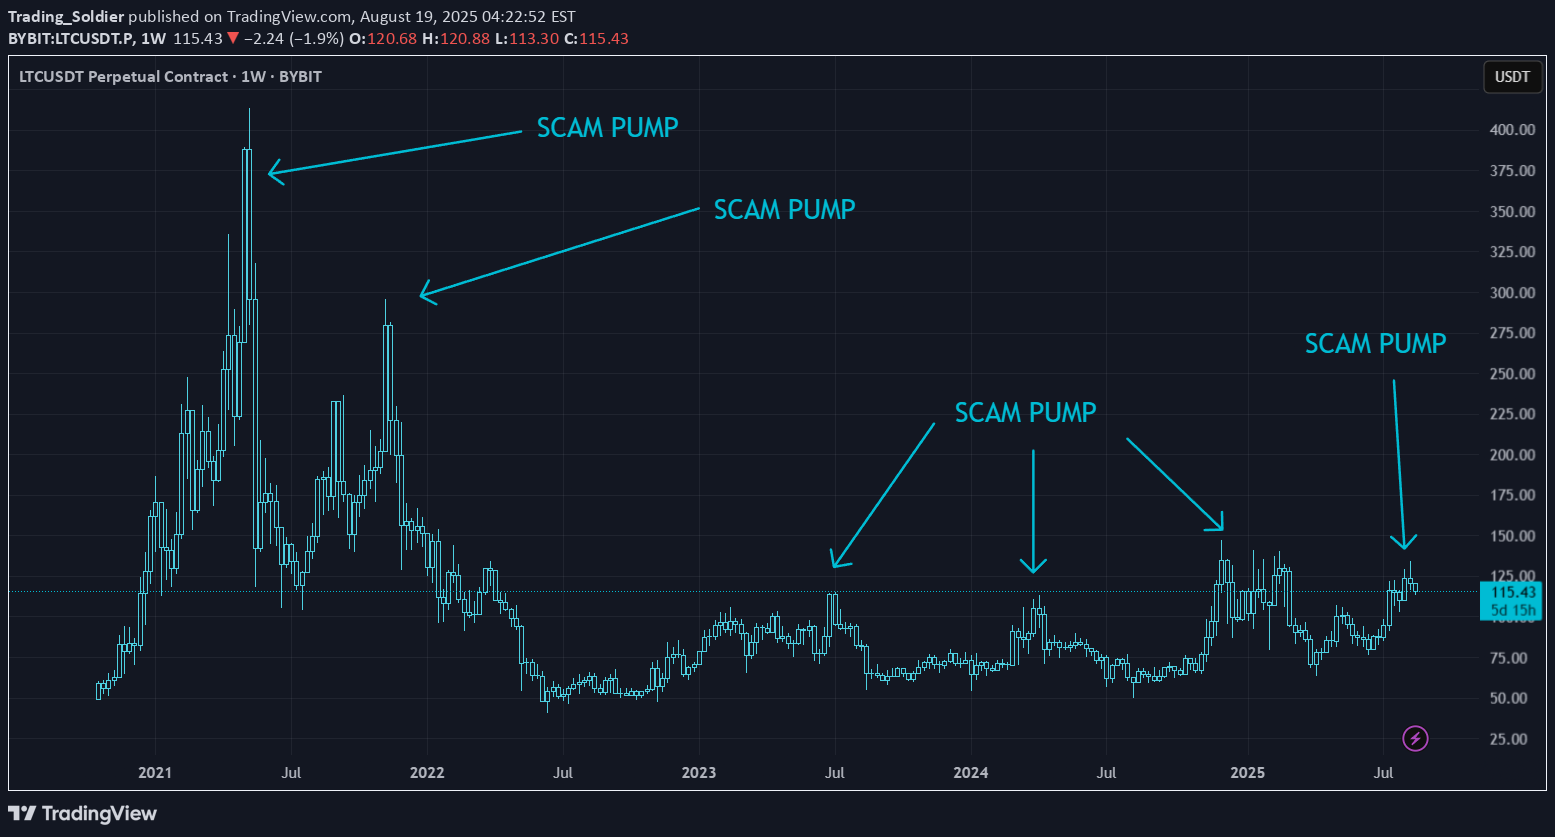
LTC has done a "SCAM PUMP" exit liquidity pattern again Litecoin has been mean-reverting every pump since 2021 This chart is pure pain for coin holders
Trading_Soldier
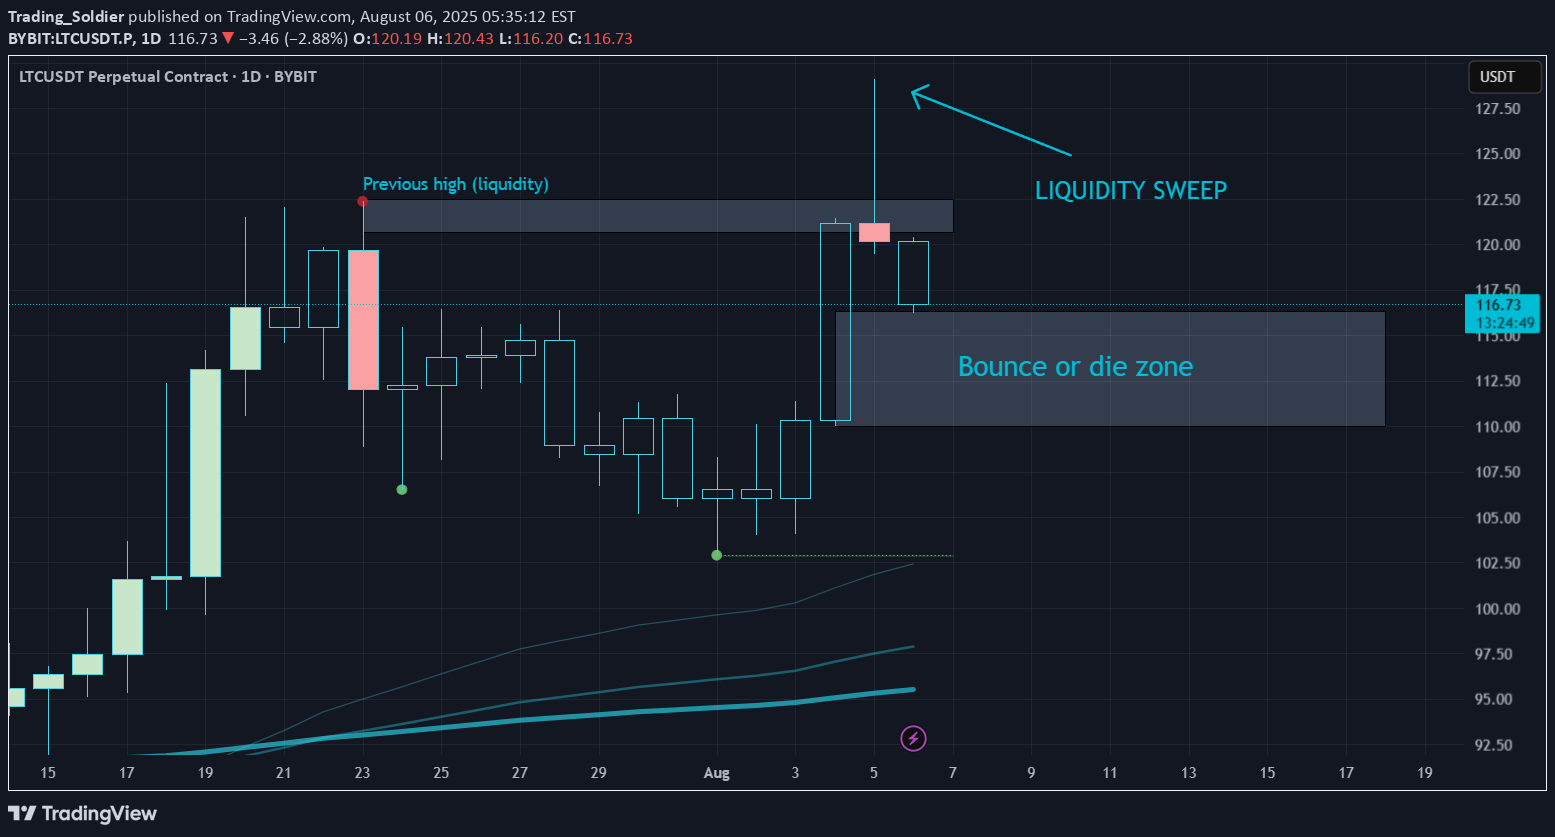
If LTC doesn't bounce from this area, the most likely outcome is that it reverts the whole pump. Litecoin cleared the previous high liquidity and now is losing steam, doing what it likes to do: Mean revert pumps.
Trading_Soldier
Not what bulls wanted to see.With massive gaps below, this kind of price action ain’t it.
Trading_Soldier
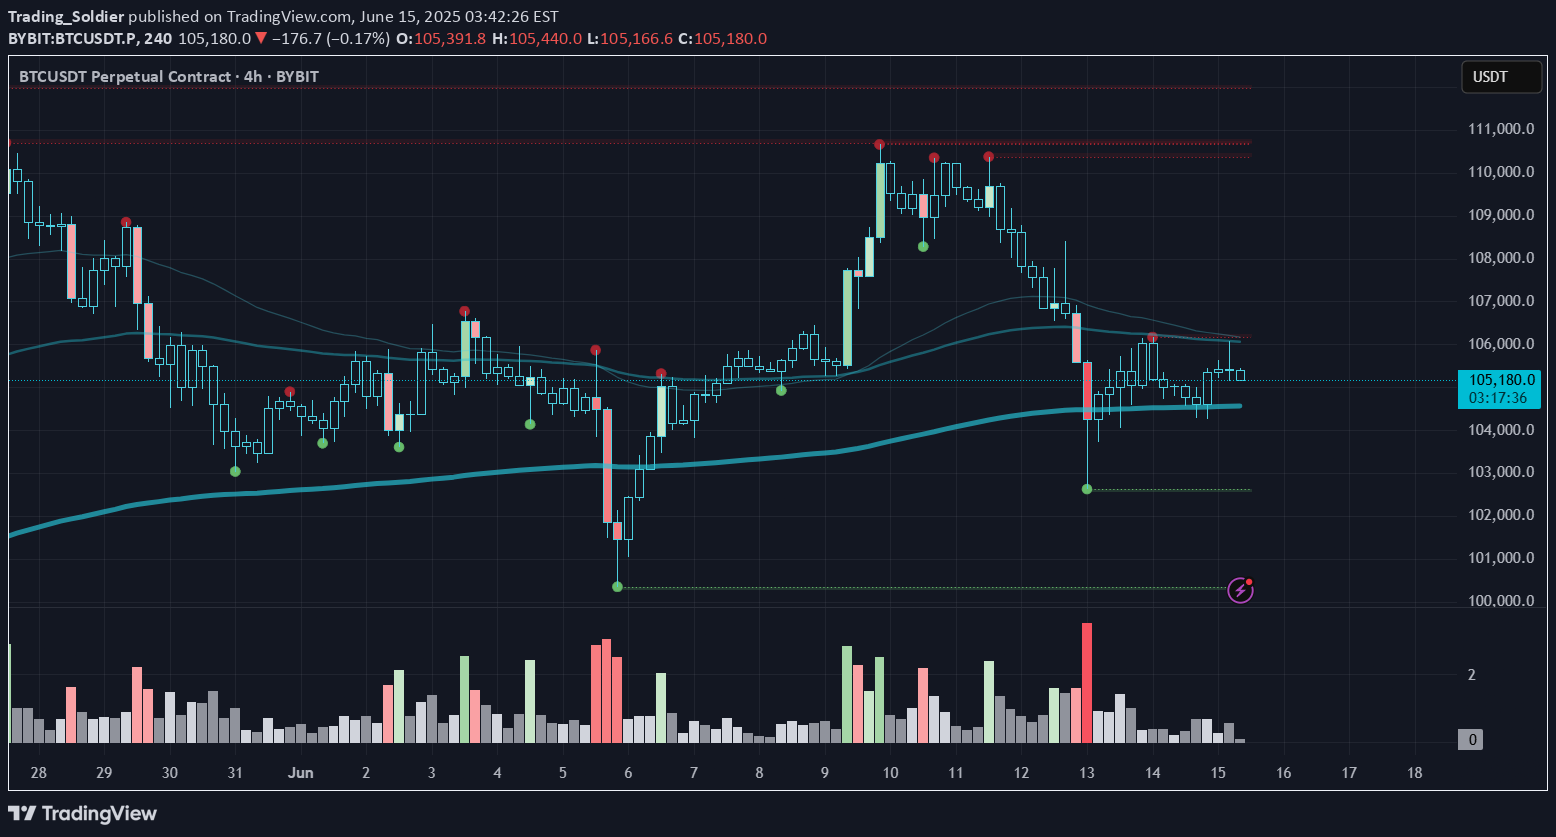
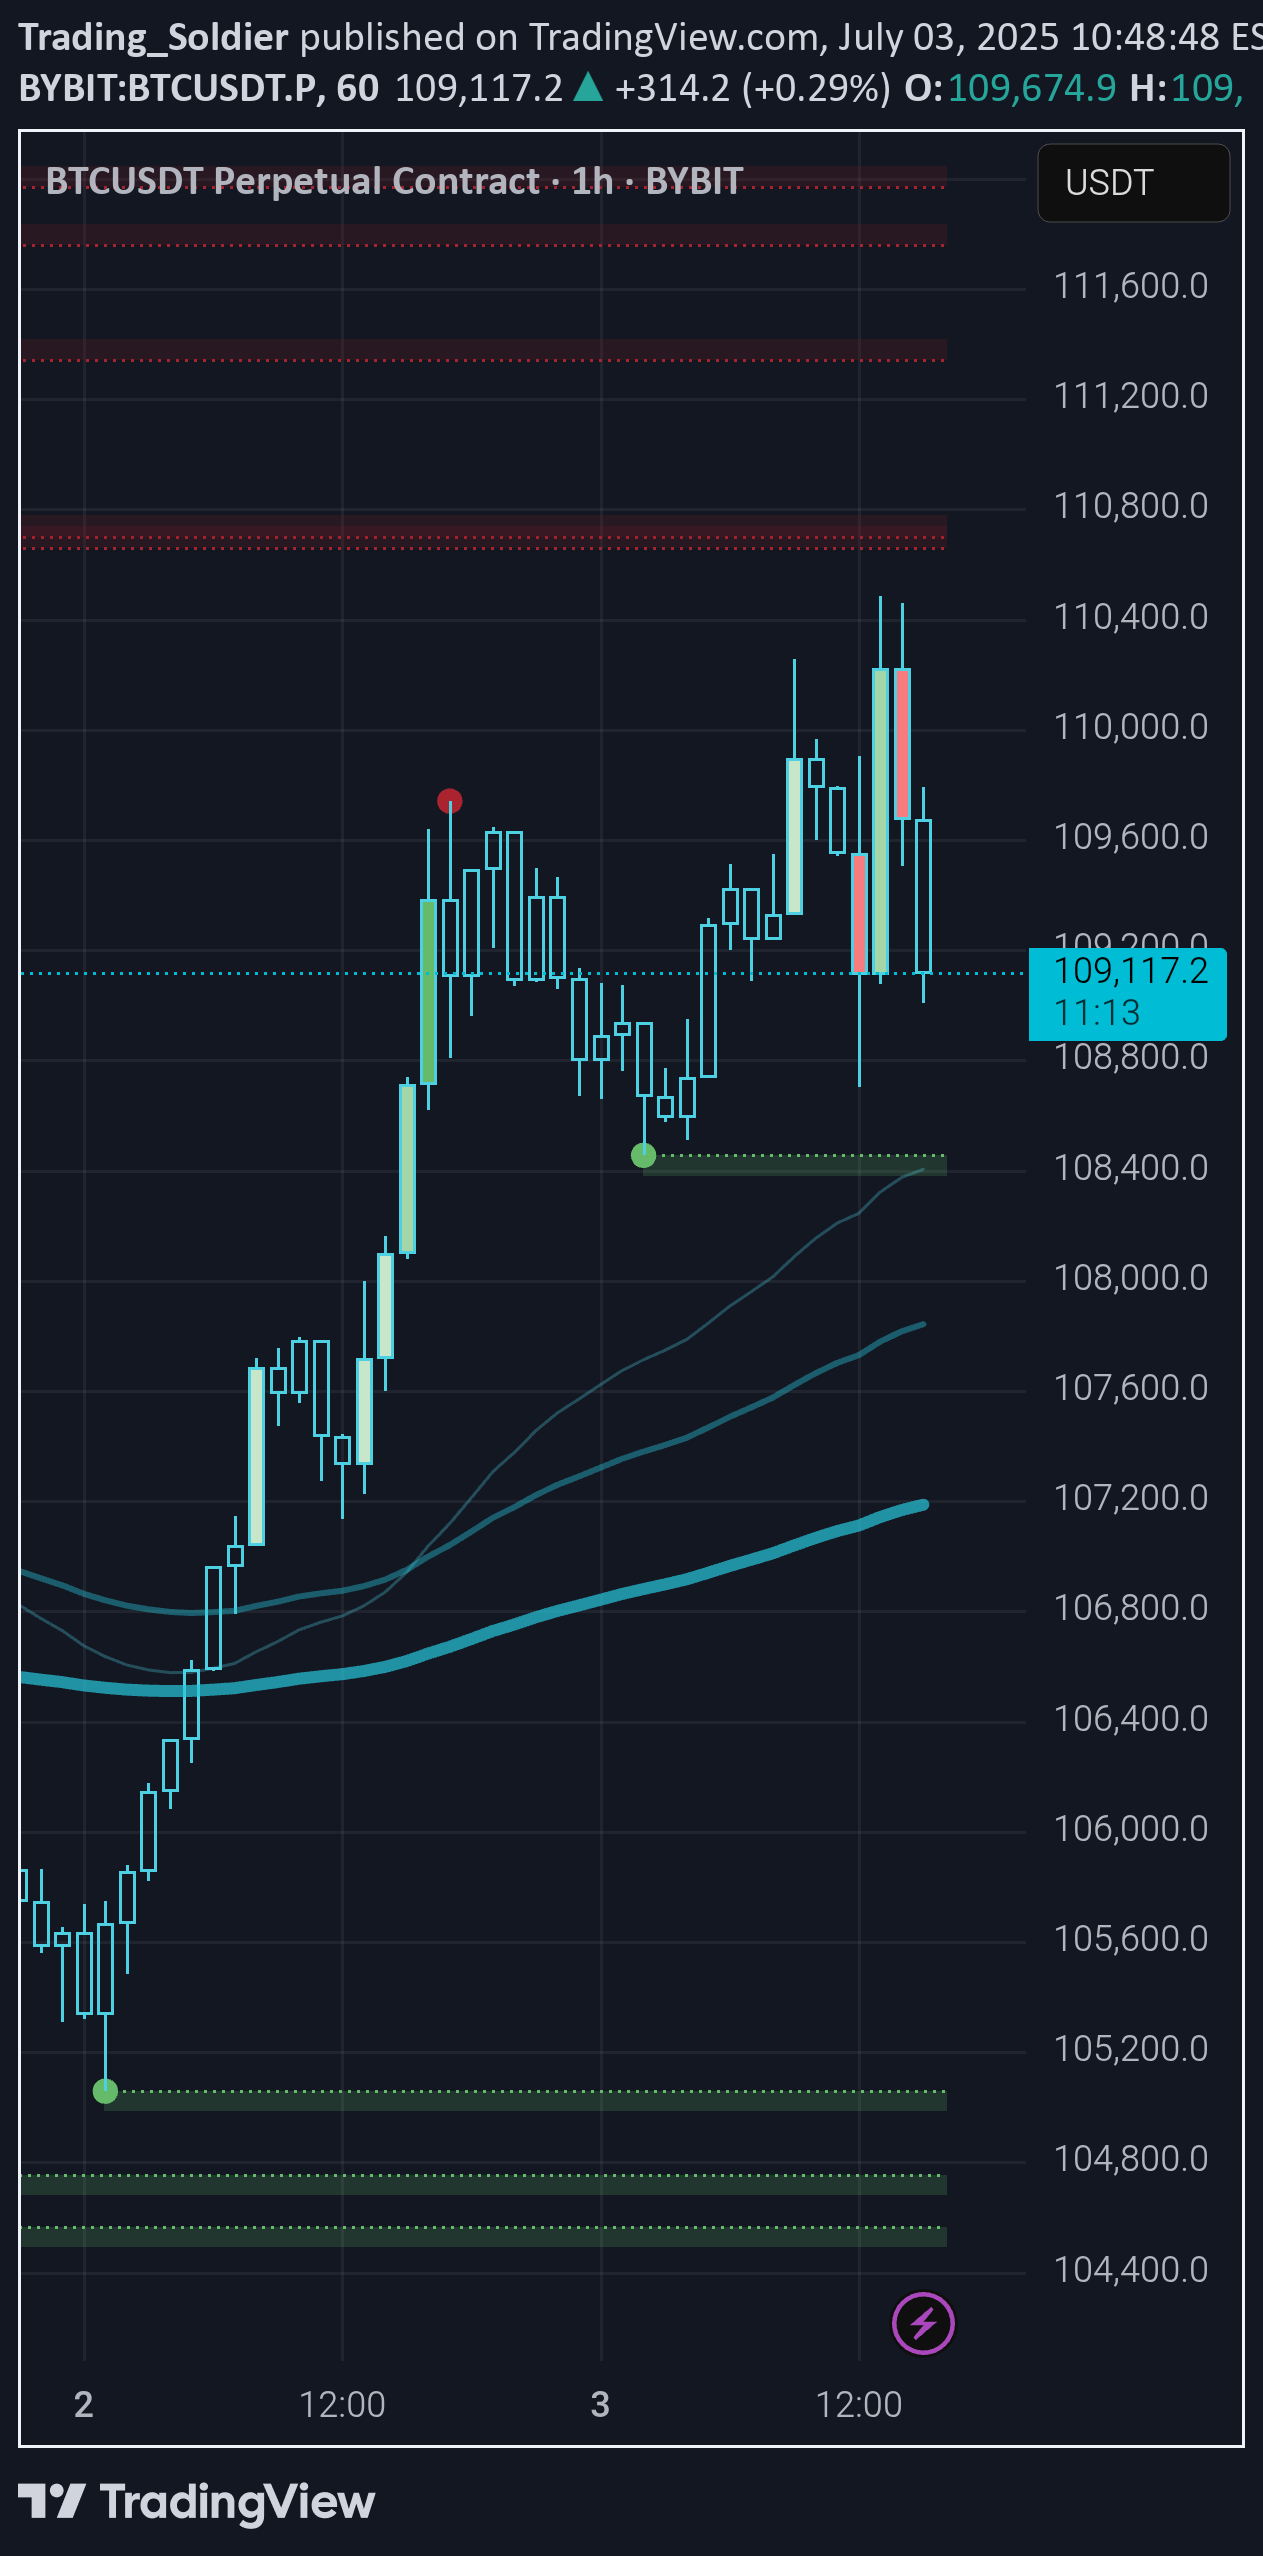
Despite war news and heavy sell volume, BTC held the 200 EMA on H4.Low-volume weekend = low liquidity, yet bears still couldn’t break it.🧠 Classic Effort vs. Result: big effort, weak result = hidden strength.🎯 If it holds: $106.5K → $108.2K → $110K in play.Structure intact. Bulls stealthily in control.
Trading_Soldier
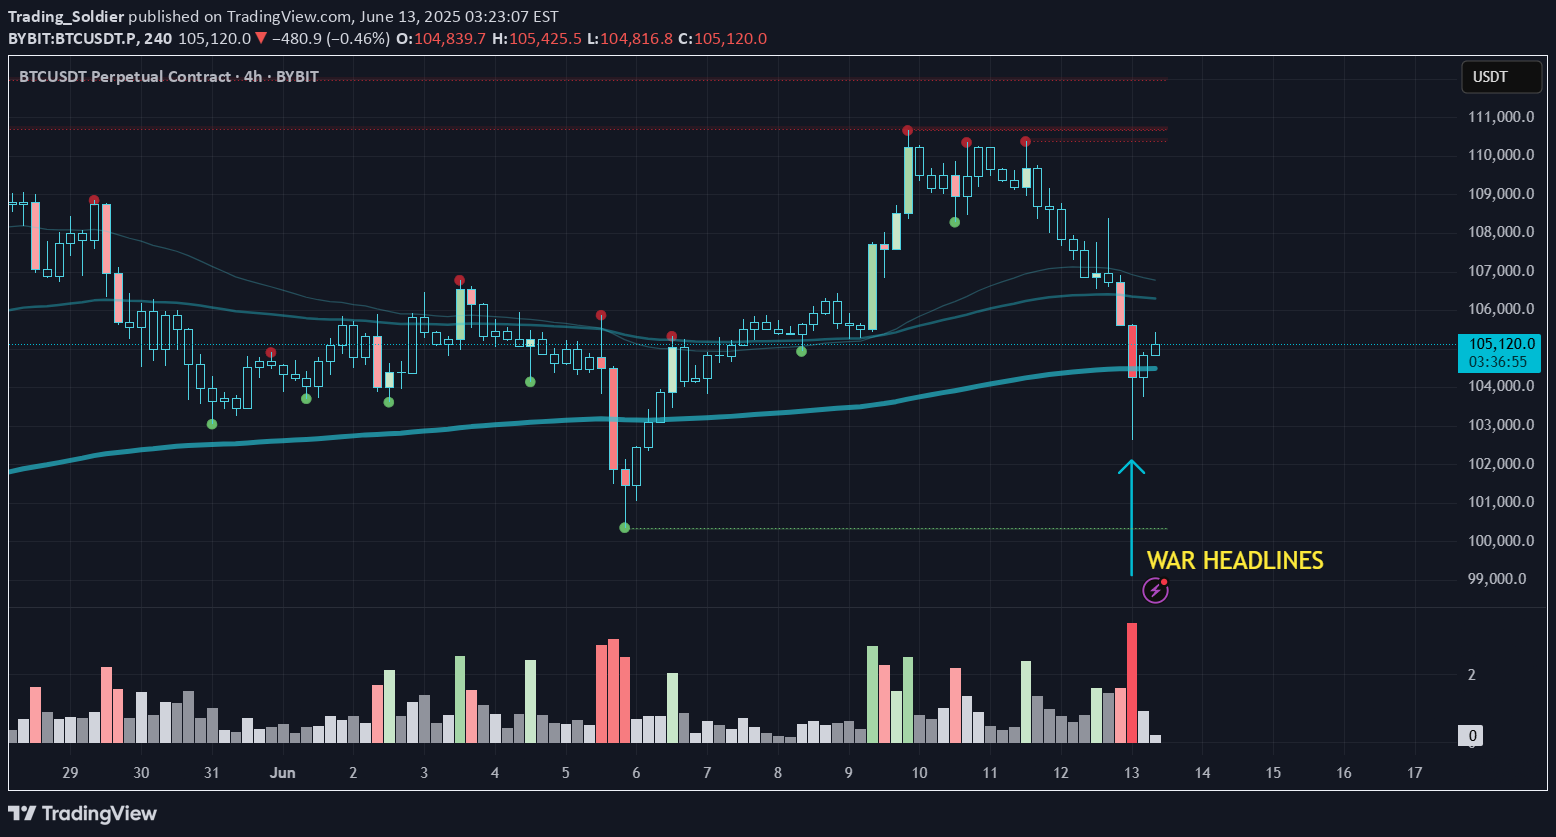
War news? Massive sell volume? No breakdown.✅ Held and reclaimed the 200 EMA✅ Price stayed elevated despite heavy effort to push it downThis is bullish divergence in action:Big effort, little result = strength.🎯 If this holds: $71.8K → $73.6K → $75K are in play.Bears failed. Structure stands. Follow price, not panic.
Disclaimer
Any content and materials included in Finbeet's website and official communication channels are a compilation of personal opinions and analyses and are not binding. They do not constitute any recommendation for buying, selling, entering or exiting the stock market and cryptocurrency market. Also, all news and analyses included in the website and channels are merely republished information from official and unofficial domestic and foreign sources, and it is obvious that users of the said content are responsible for following up and ensuring the authenticity and accuracy of the materials. Therefore, while disclaiming responsibility, it is declared that the responsibility for any decision-making, action, and potential profit and loss in the capital market and cryptocurrency market lies with the trader.