
TrendingMoves
@t_TrendingMoves

What symbols does the trader recommend buying?
Purchase History
Trader Messages
Filter
Message Type
TrendingMoves
LTC at the Edge? — Hold $100 and We May Have a Ride to $300+
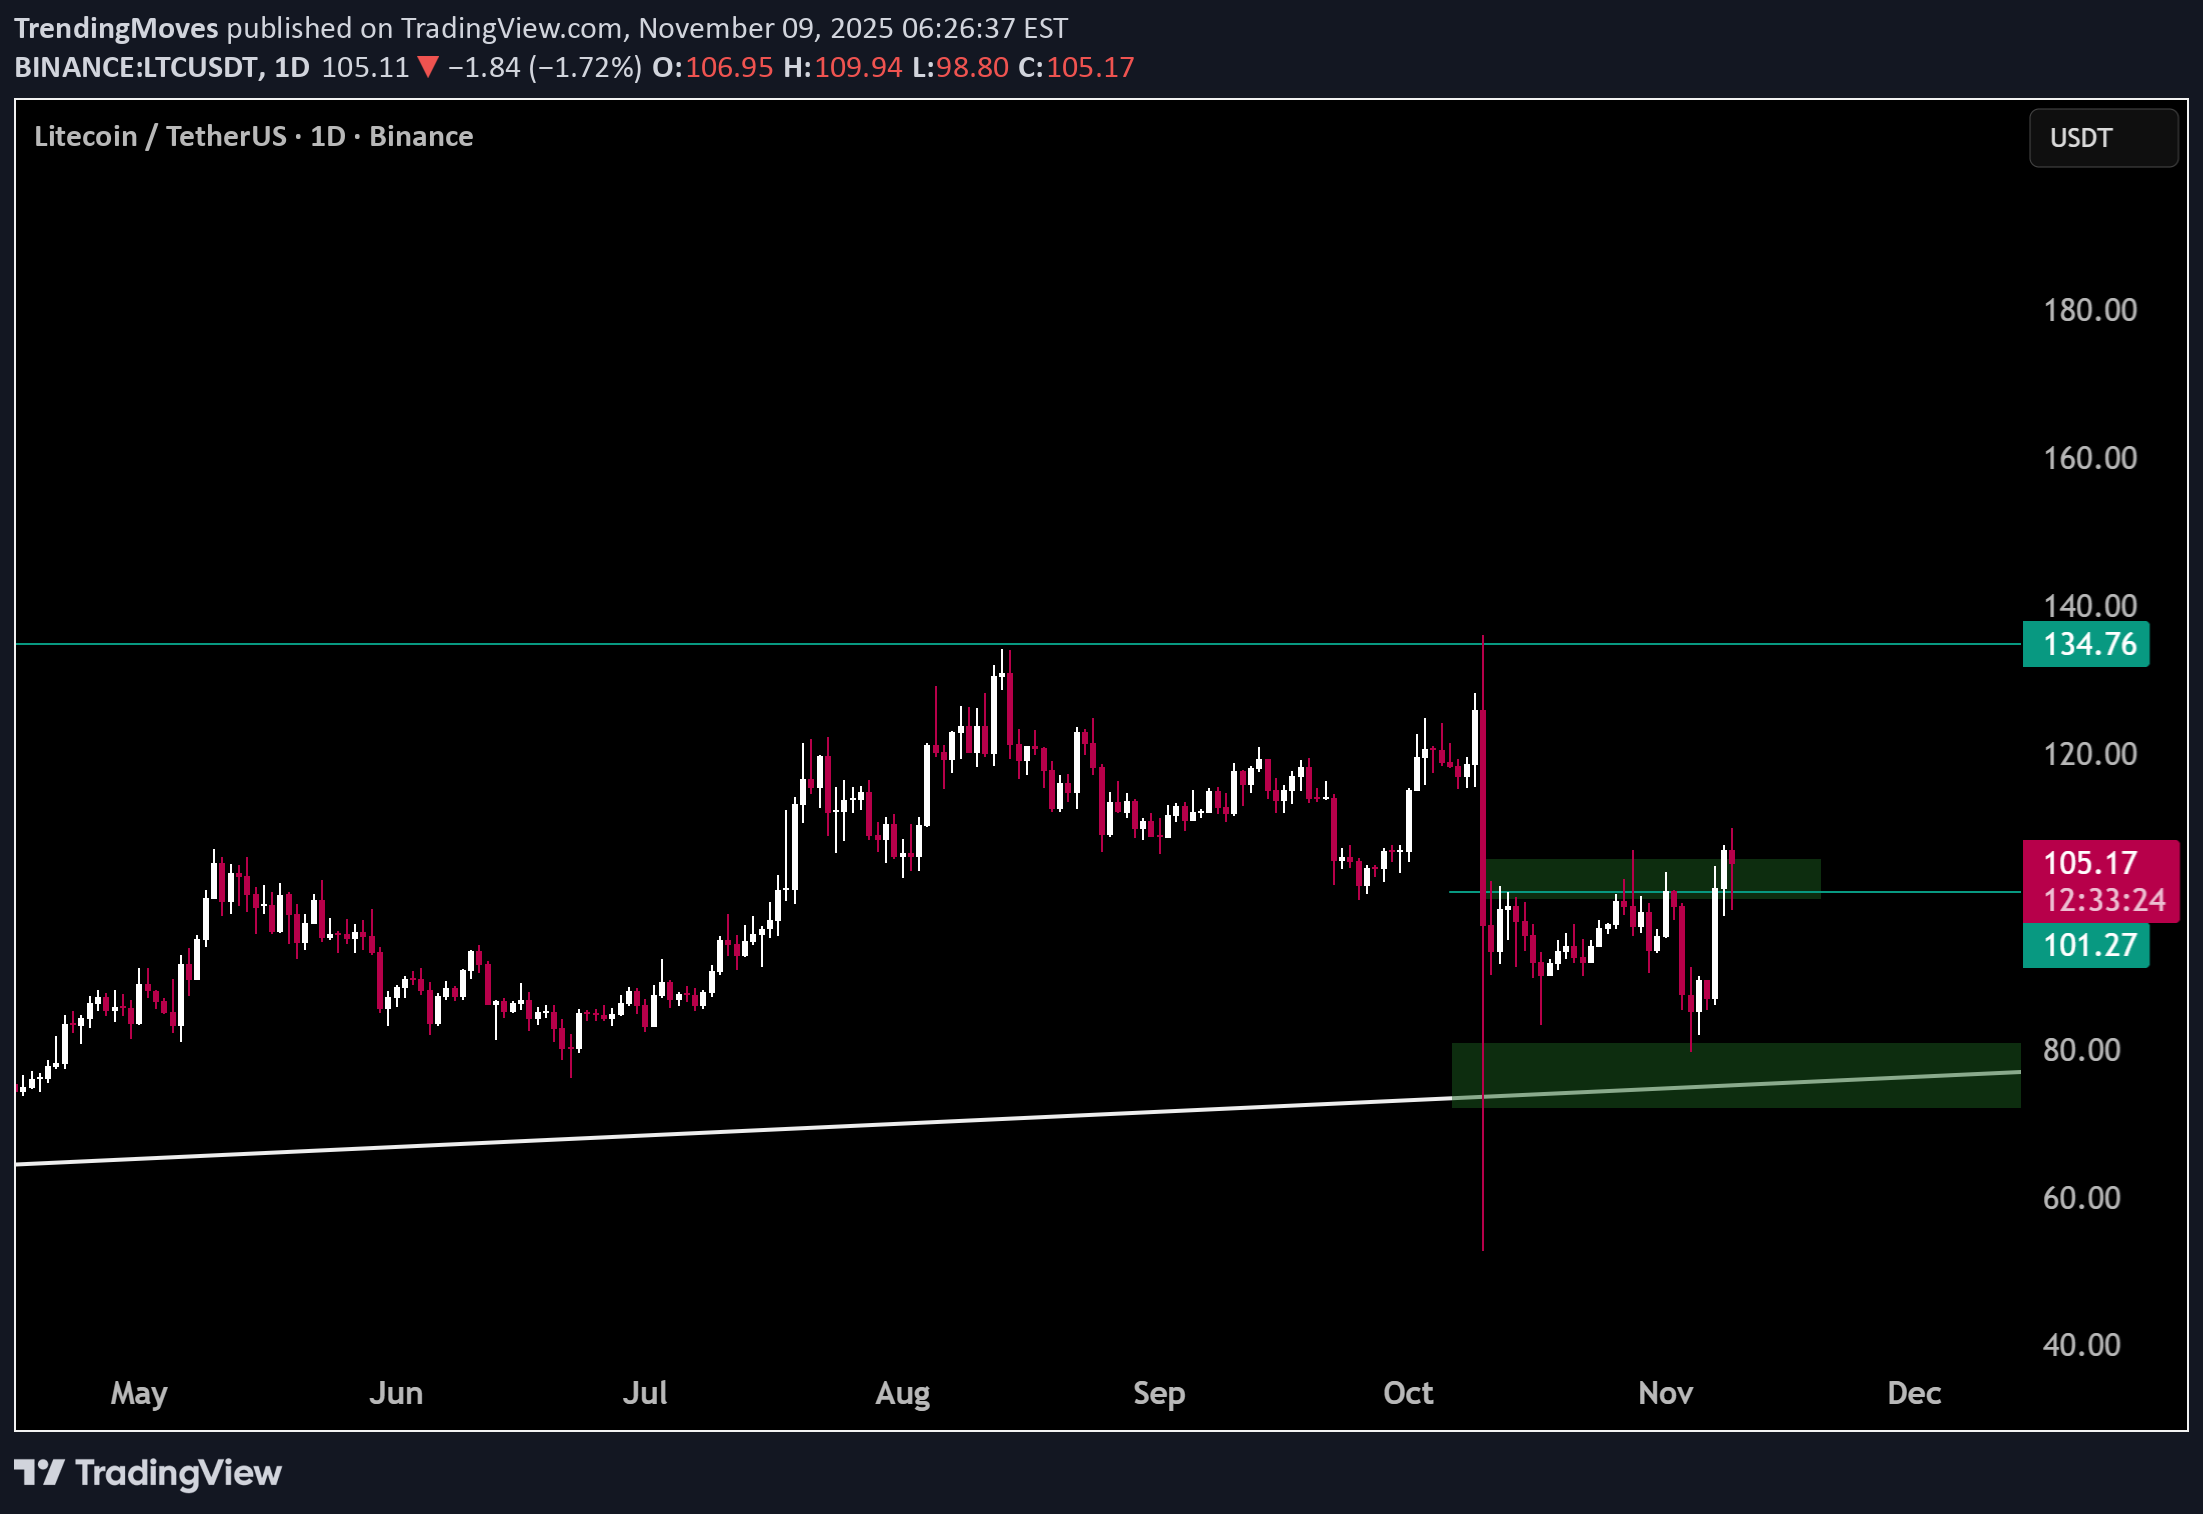
📊 LTC Price Update | Major Level on Watch Litecoin (LTCUSDT) is currently holding the $100 support — a crucial psychological and technical level. If buyers manage to hold above $100, momentum could build toward the next key resistance zone near $135. 🔹 Key Levels: Support: $100 (must hold for bullish structure) Resistance: $135 – breakout here confirms mid-term reversal Upside Target: $300+ possible if $135 breaks with volume 🔸 Market Outlook: Price consolidation above $100 is showing early signs of accumulation. A strong breakout above $135 could mark the beginning of a long-term uptrend, targeting the $250–$300 region. Failure to defend $100, however, would risk revisiting lower demand zones around $85. 🧭 Strategy: Watch for daily closes above $135 for trend confirmation. Until then, $100 remains the line in the sand for bulls.
TrendingMoves
$XMR About to Rip? — Hold $420 and We Fly
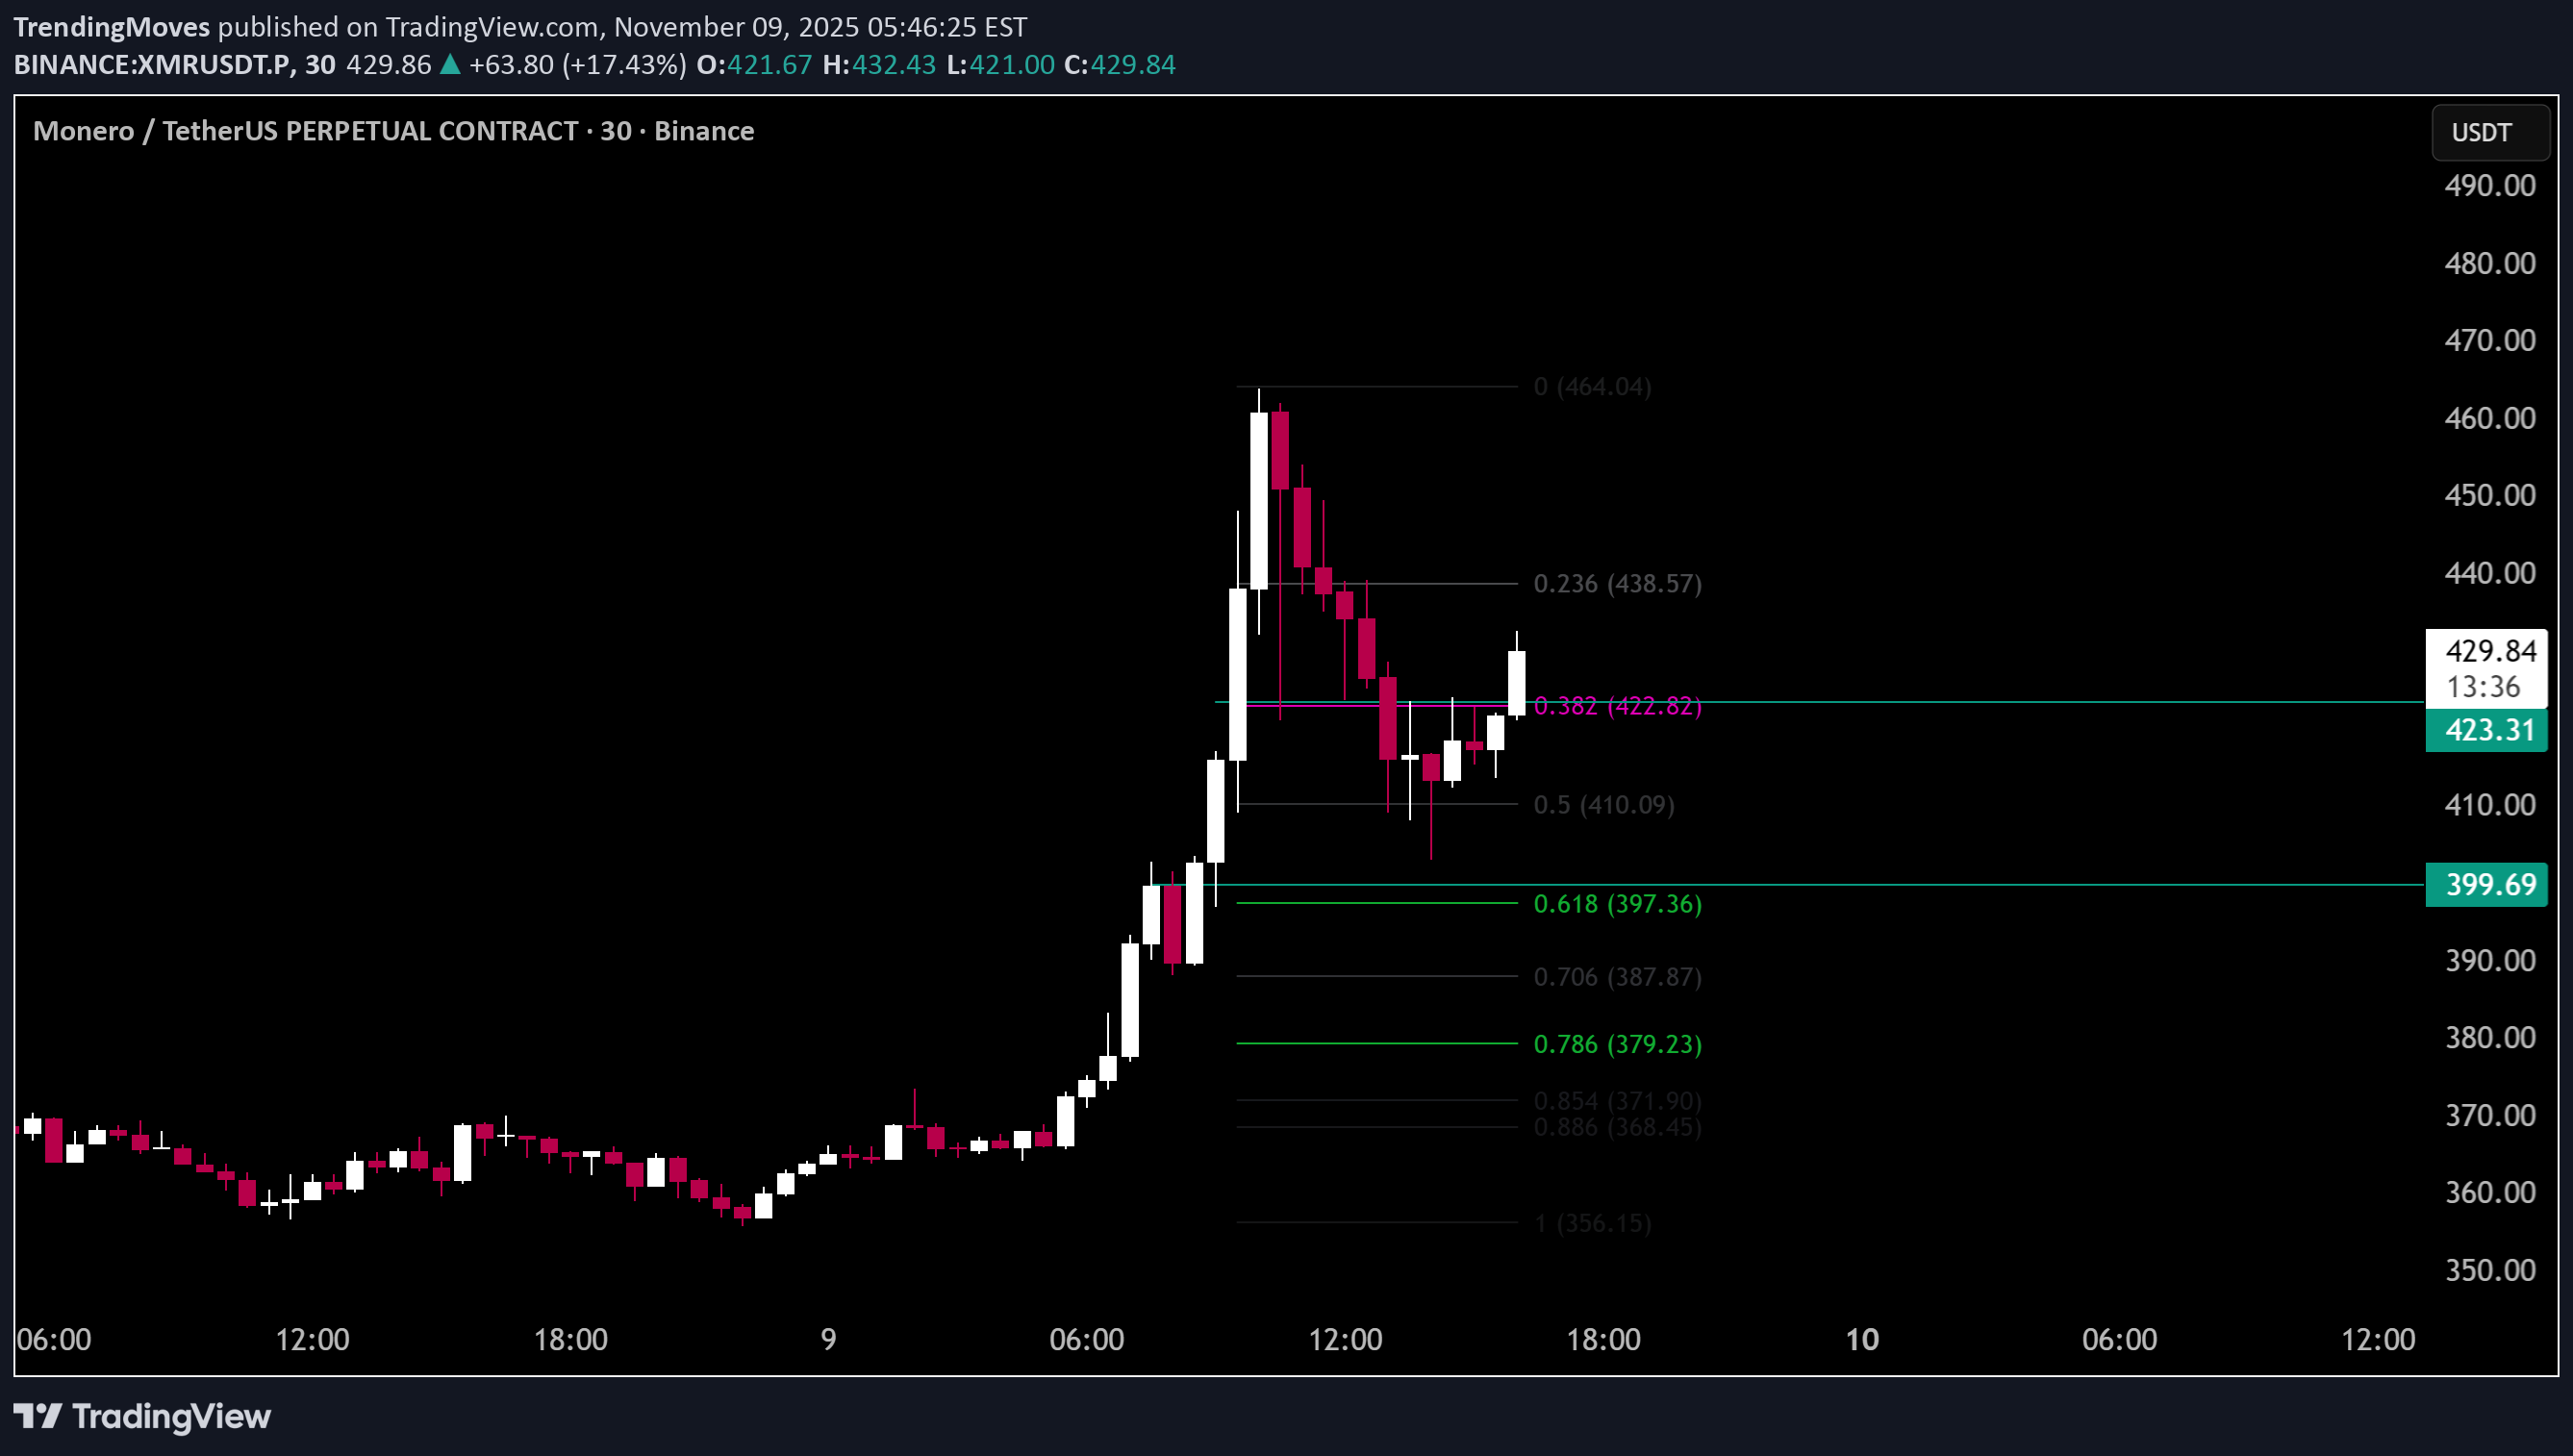
📊 XMR Price Update | Breakout Watch Monero (XMR) is trading above minor resistance, showing early signs of renewed strength. The key level to watch is $420 — a clean hold above this zone could signal the start of another leg up in the current move. 🔹 Key Levels: Immediate Support: $420 – needs to hold for momentum continuation Next Resistance Targets: $448 → $472 → $495 Invalidation: Drop back below $410 would weaken the setup 🔸 Outlook: Momentum is shifting bullish as price consolidates above resistance. Sustained closes over $420 may invite breakout traders and trigger fresh buying interest. If volume picks up, XMR could easily extend toward the $470–$490 zone in the next impulse. 🧭 Strategy: Look for confirmation candles and volume expansion above $420 before adding exposure. Dips toward $420 may offer good re-entry opportunities as long as structure stays intact. ⚡ Suggested Catchy Titles: “XMR Breaking Out — $420 Hold Could Ignite the Next Rally 🚀” “Monero Waking Up: $420 Is the Key to the Next Leg Up” “XMR Bulls Back in Control — Watch $420 for the Breakout!”
TrendingMoves
Watch ZEC Supports Level Next Stops? | ZECUSDT | BTCUSDT | ZCash
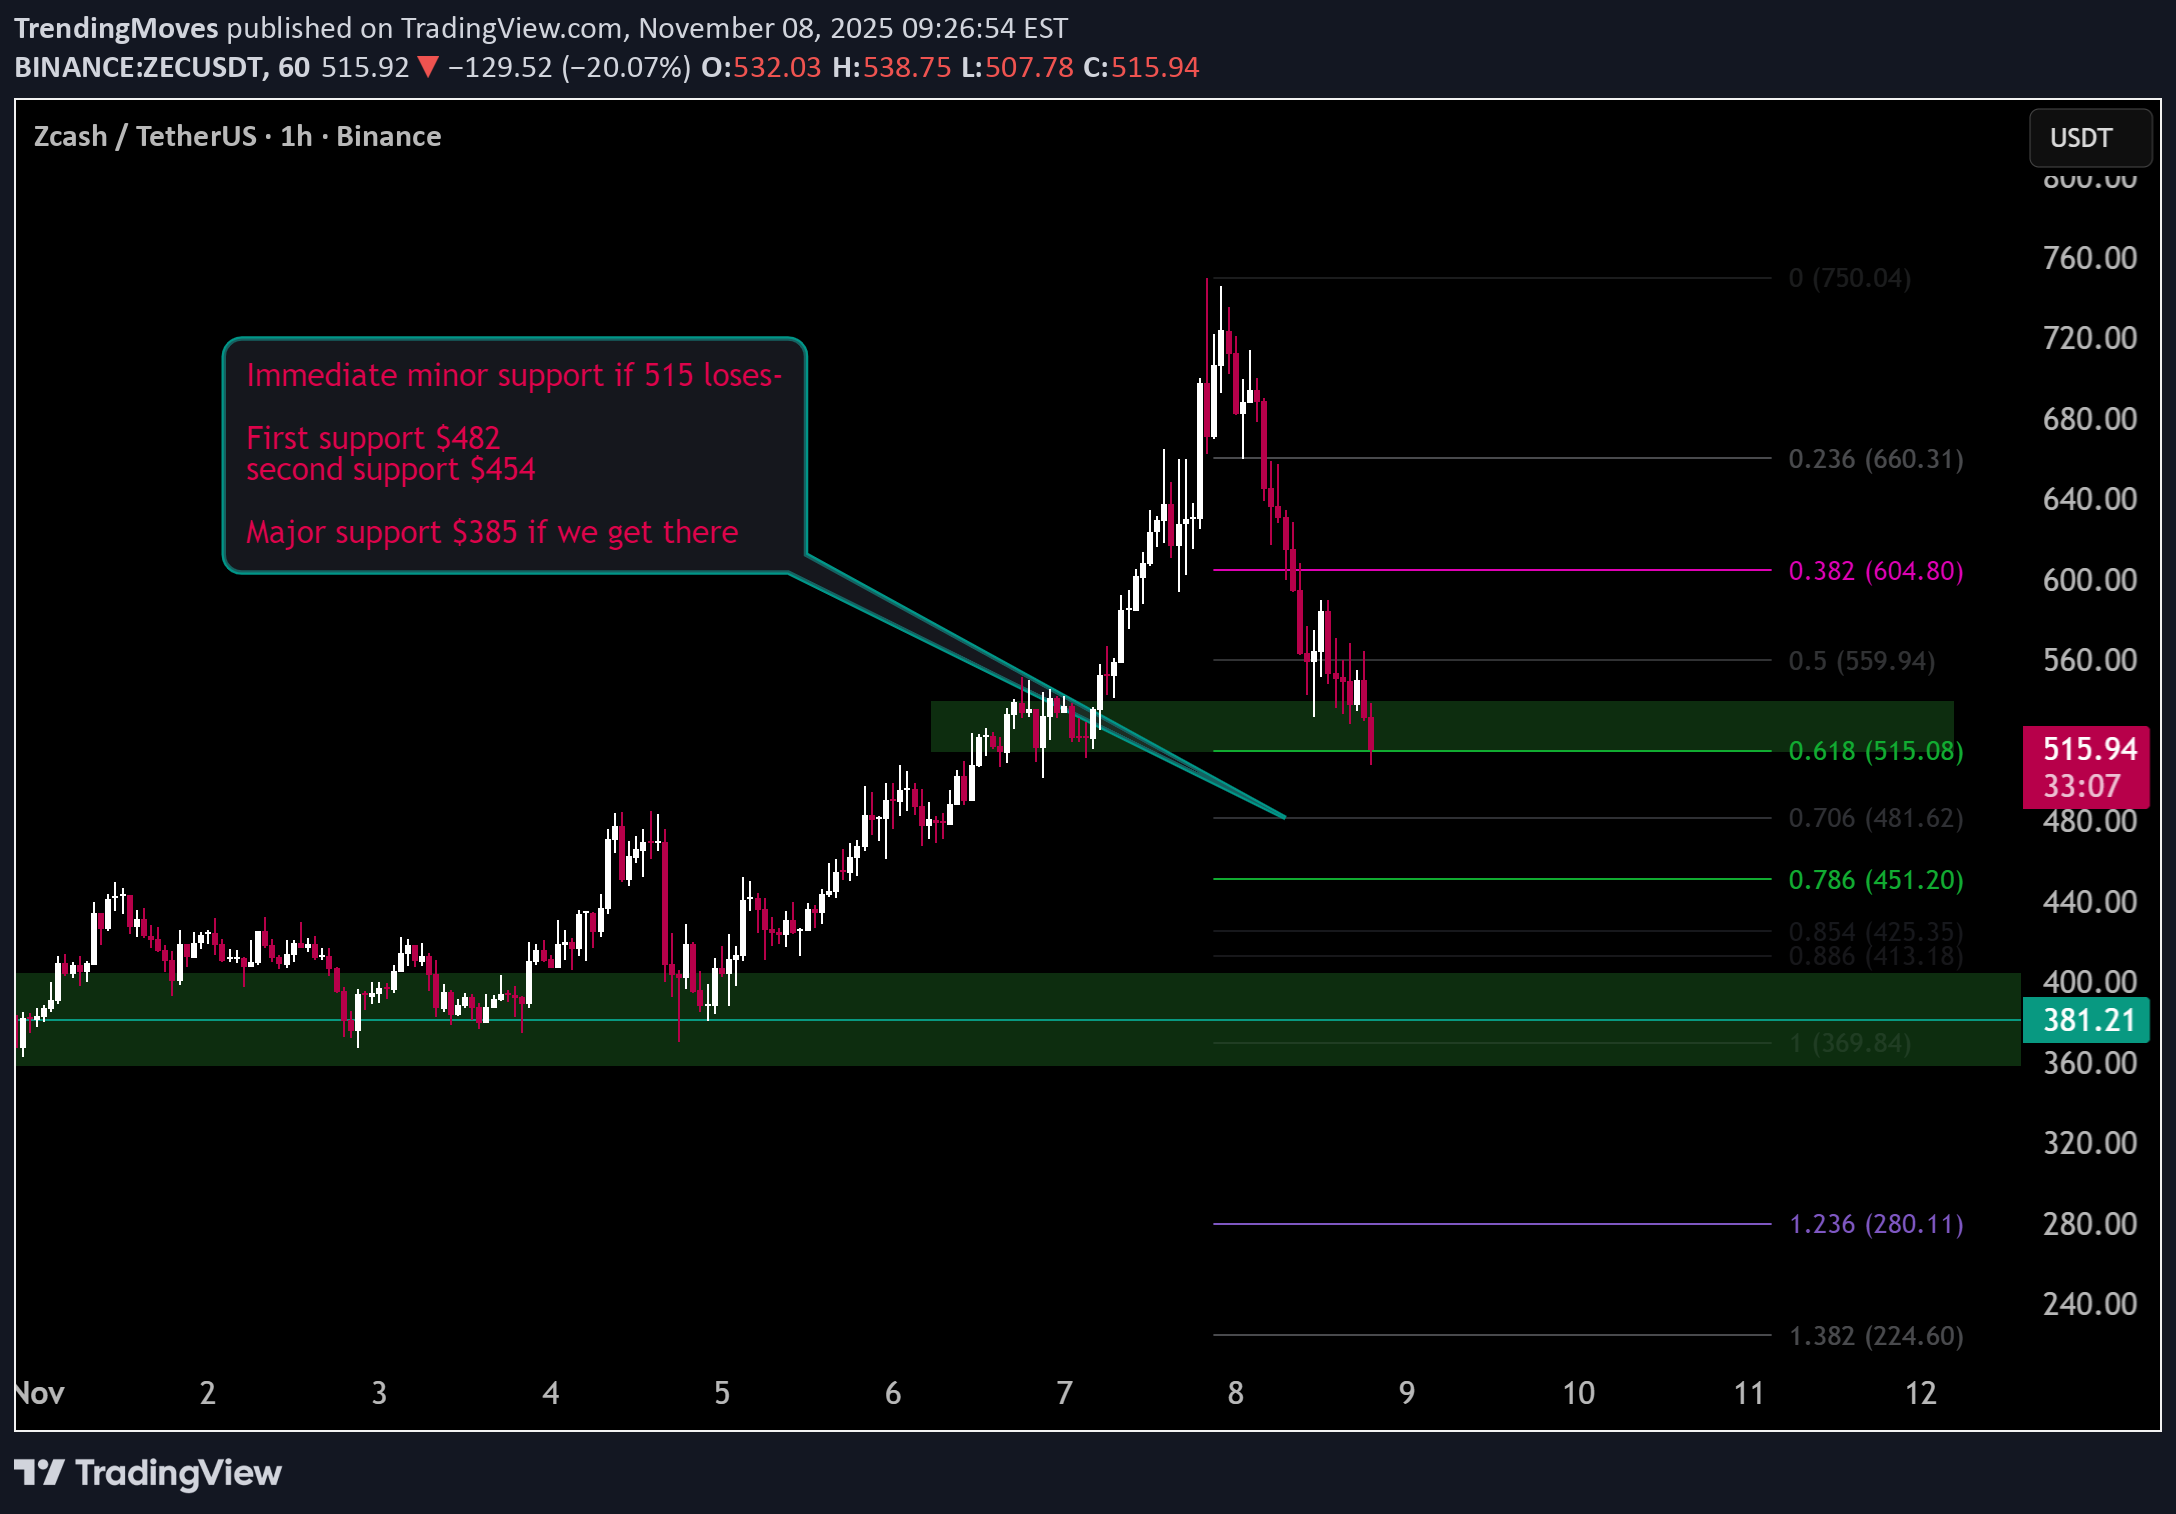
📊 Market Update | Zcash Key Support Levels Ahead The price action is currently hovering near the $515 zone, which coincides with the 0.618 retracement — acting as immediate minor support. If this level fails to hold, we could see a short-term continuation toward deeper Fibonacci zones. 🔹 Support Structure: $515 (.618 Fib) → Minor support. Losing this could trigger a quick selloff. $482 (.706 Fib) → First strong support area; expect buyers to test momentum here. $454 (.786 Fib) → Secondary support; deeper correction zone if sentiment weakens further. $385 → Major support and potential reversal zone. If price reaches this area, it could mark a long-term accumulation opportunity. 🔸 Market Outlook: Momentum remains cautious with sellers showing dominance near resistance zones. However, watch for volume spikes or bullish divergence on lower timeframes around the $482–$454 range, as that’s where potential short-term reversal setups could emerge. As long as $515 holds, structure remains healthy for a possible bounce. A clean breakdown below it, however, would confirm weakness and open doors toward the next supports. 🧭 Strategy: Traders may consider scaling in gradually between $482–$454 with tight risk management, or wait for a confirmed retest above $515 for a safer re-entry.Jumped from 515 support. taking profit here. right now trading above 9ema daily. hold on to that and we can see some more up
TrendingMoves
BTC Current Analysis | ETH | ZEC
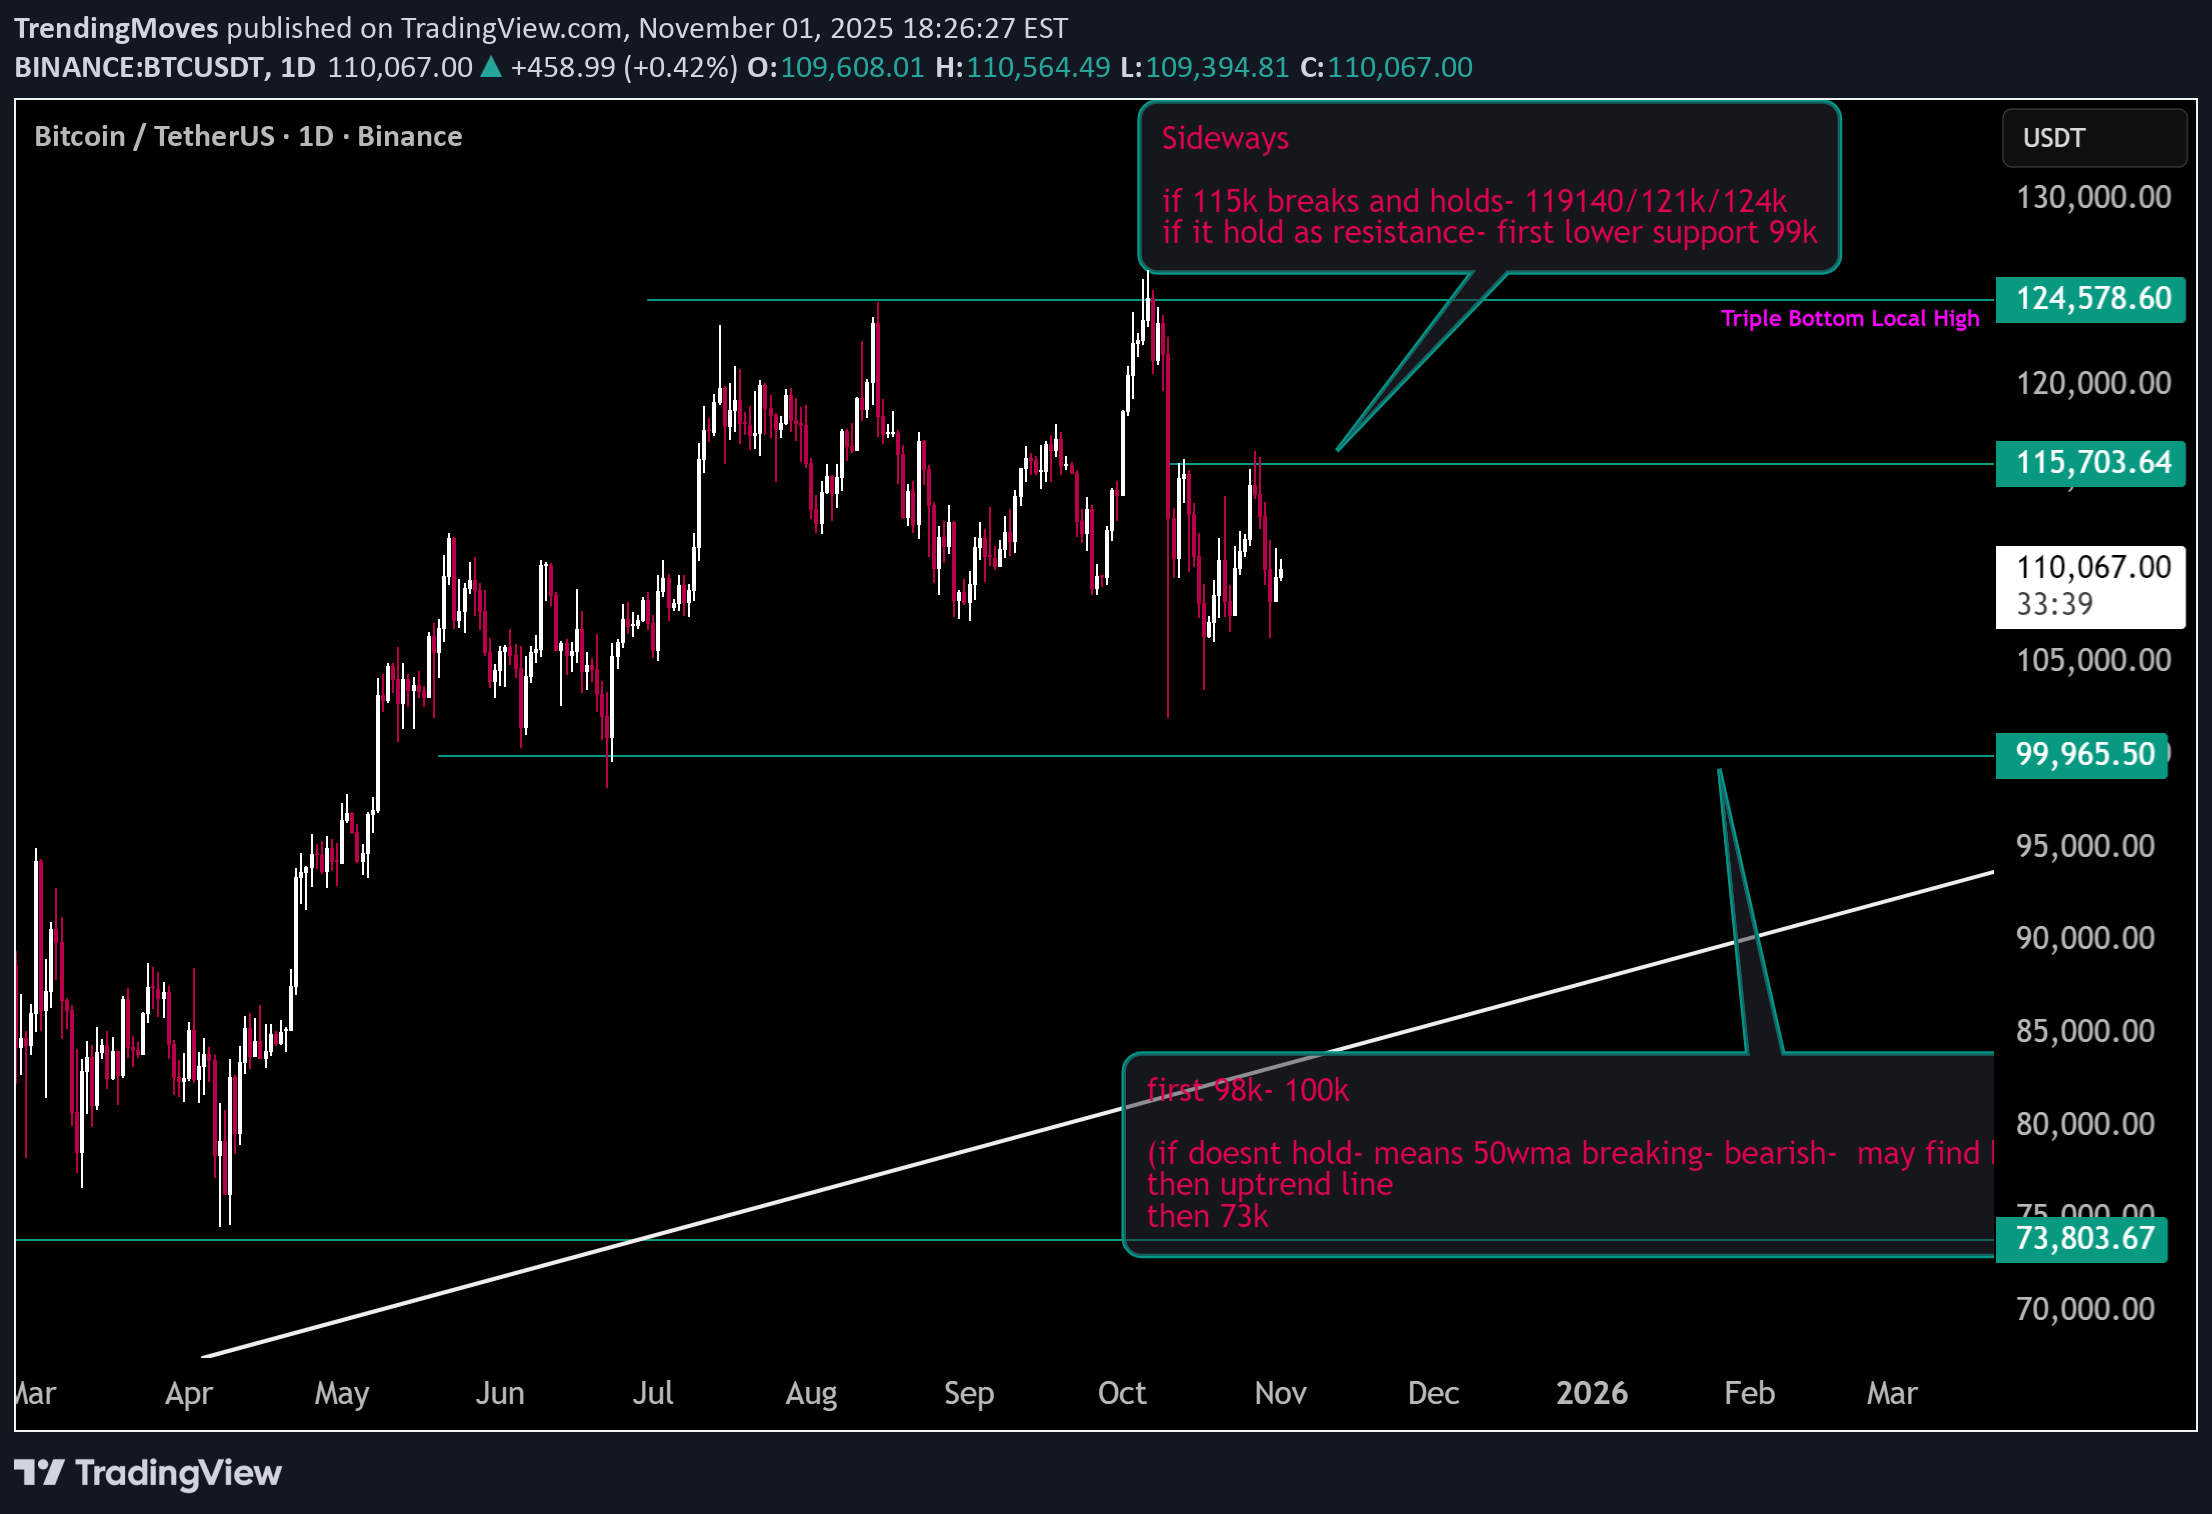
TL;DR: ✅ 98K–100K = must-hold bullish base. ⚠️ 115K = breakout confirmation or rejection pivot. ⛔️ Break below 50WMA → 73K target. 🎯 Above 115K → 119K → 121K → 124K. 1. Structure Summary Current: Sideways with a bullish tone on daily. Key Zones: Support: 98K–100K Resistance: 115K Upper targets: 119.1K / 121K / 124K Deeper supports: 100WMA ≈ 73K 🔍 2. Short-Term (Daily Chart) BTC is consolidating sideways — likely forming a bullish continuation pattern (a flat range). Momentum (RSI/MACD) likely shows neutral divergence. As long as price stays above 98K–100K, bulls maintain control. A clean daily close above 115K would confirm range breakout, opening the path to 119–124K. → Bias: Bullish-neutral (accumulation before potential breakout). 🧱 3. Mid-Term (Weekly Chart) 50WMA acting as dynamic support; a breakdown below it often signals the start of a mid-term correction. If 50WMA breaks and holds below, the next logical demand zone aligns with 100WMA (to ~73K) — a deep retracement zone. Uptrend line support also converges near that level, increasing the probability of strong buying interest there. → Bias: Bullish until 50WMA breaks. If broken, expect a 25–30% correction to the 73K zone.100k Holding for now as said earlier Next Support if it didn't 94k
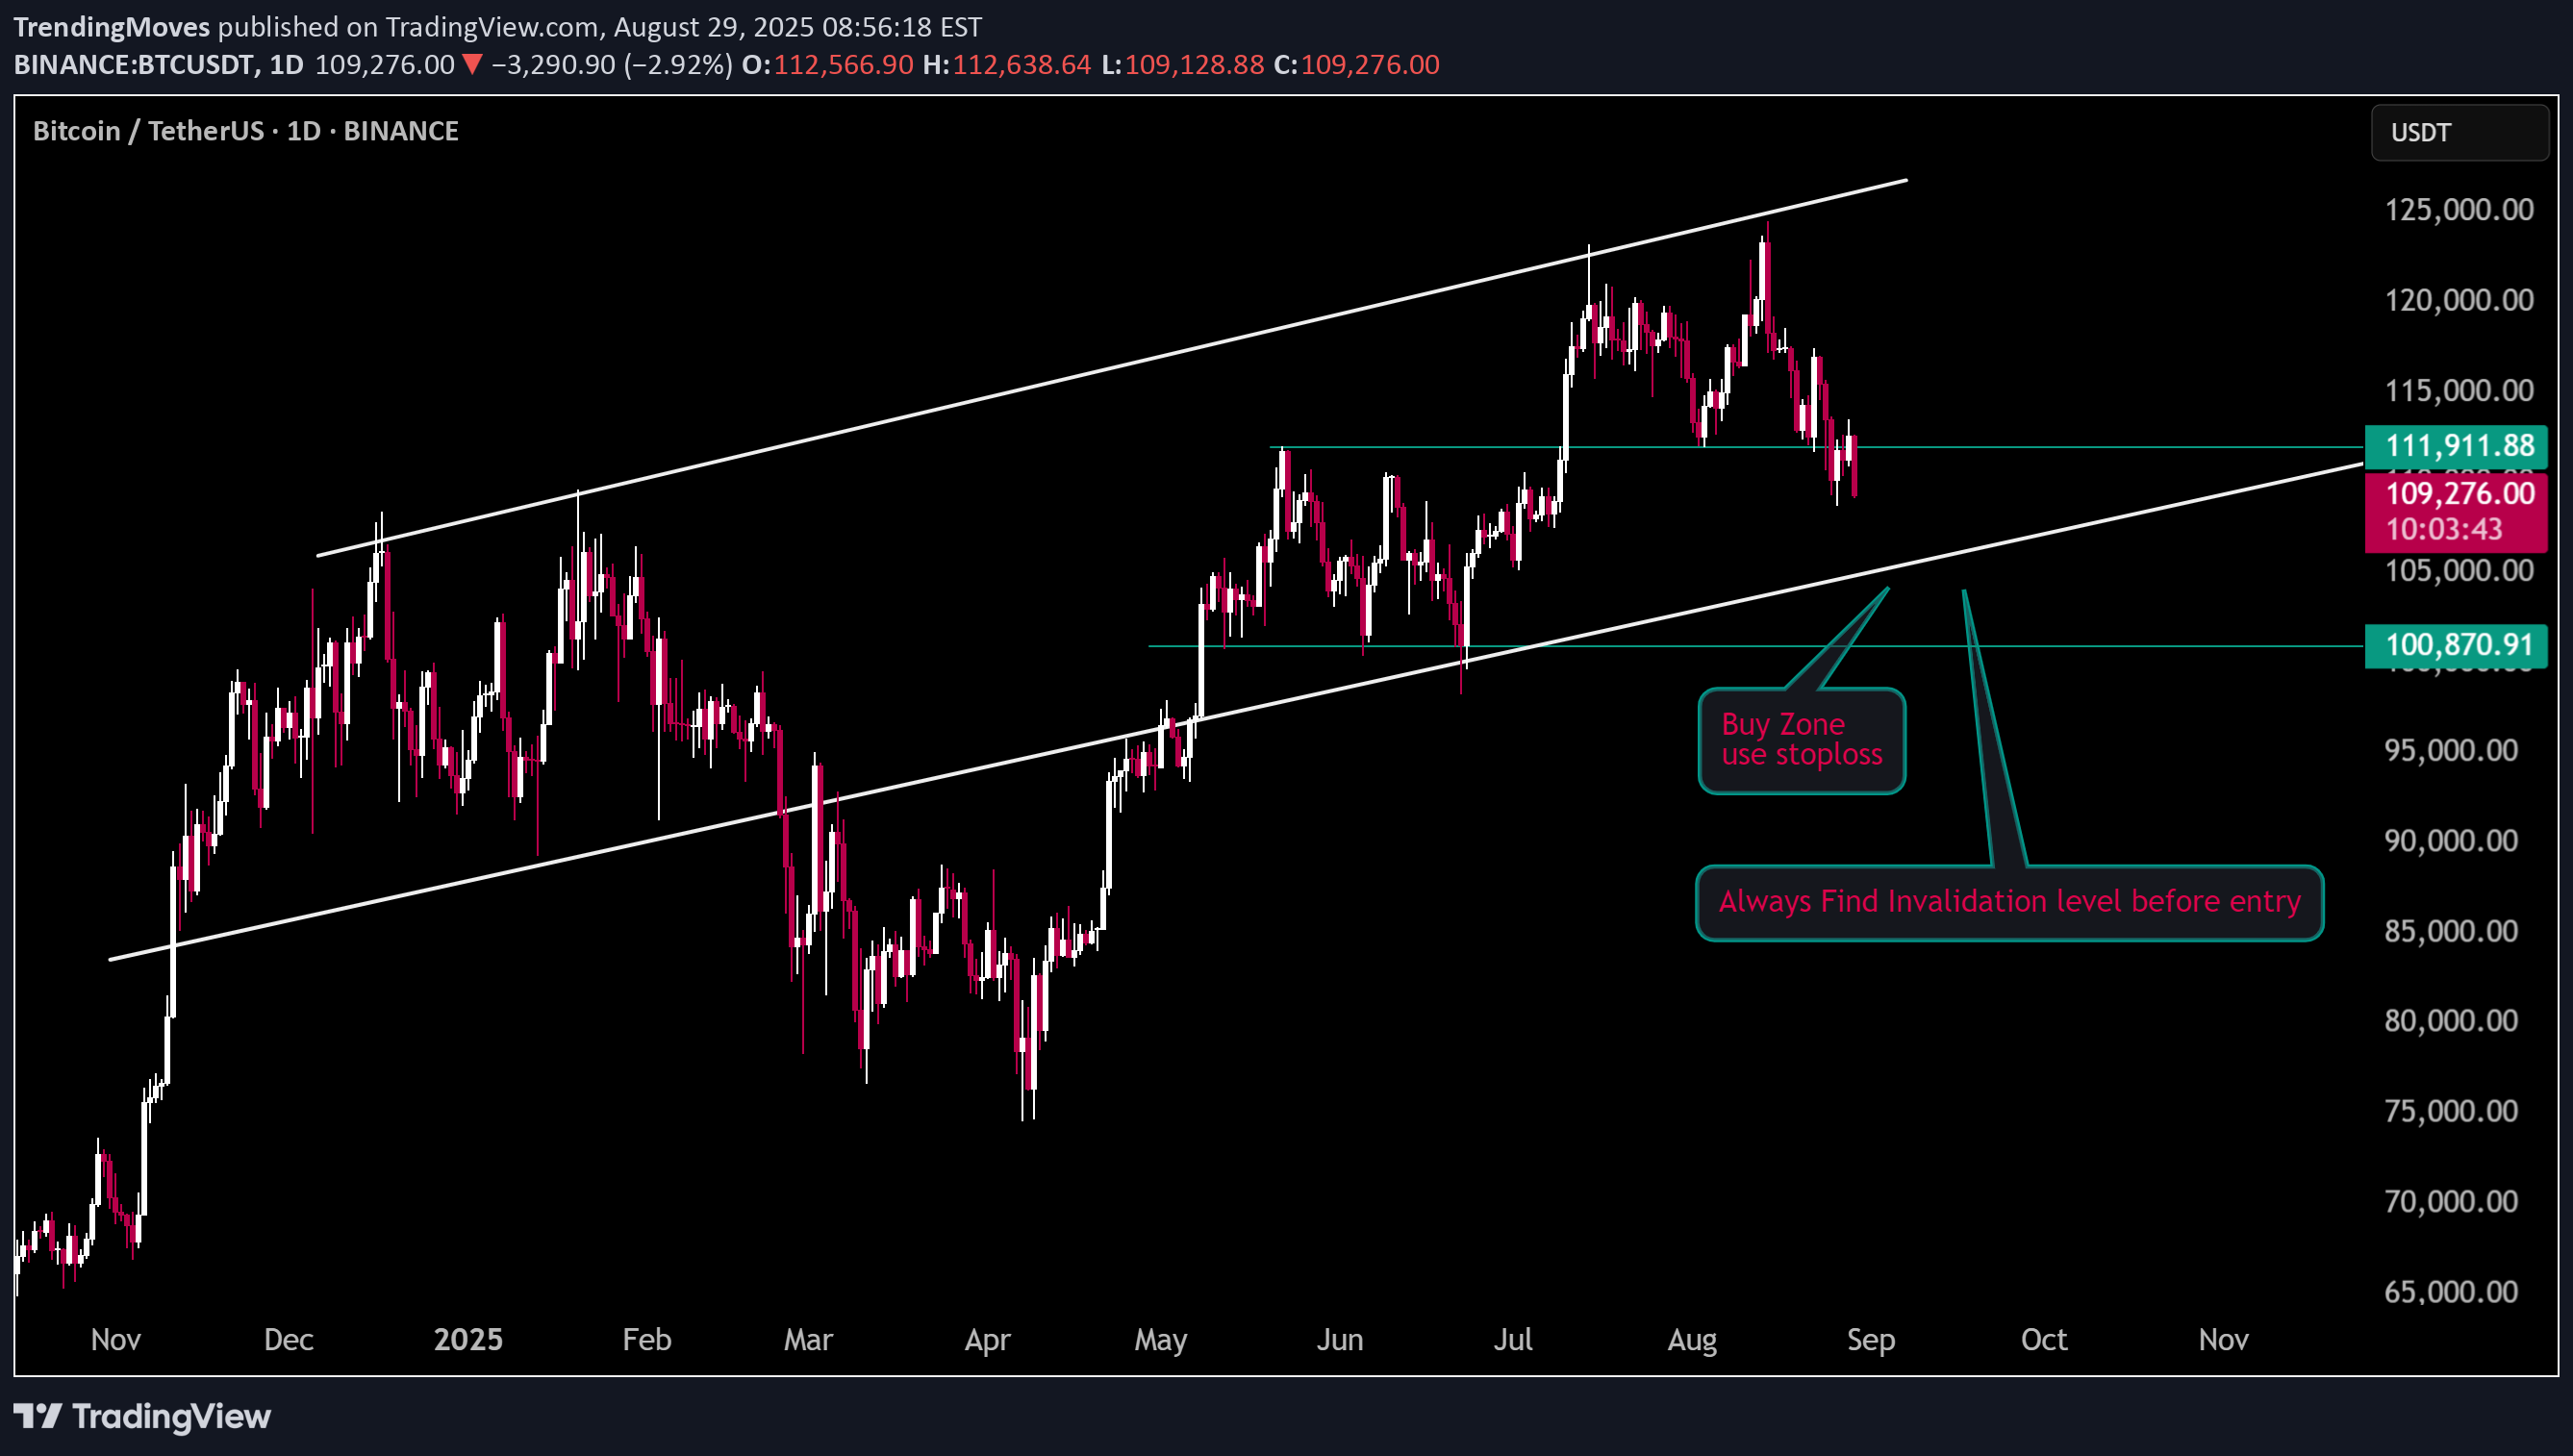
TrendingMoves
Longing here BTC at 111700

Trendline support is still intact — price continues to respect it. As long as 109,500 holds, we could see a potential move toward the recent local highs. 🟢 Bias: Long on dips 📉 Stop Loss: 109,500 🎯 Target: Retest of local highs area (above current range)
TrendingMoves
BTC Trading above 26EMA Weekly. Buying here around 105900$ with stoploss BTC will go sideways and ALTs will start to popup
TrendingMoves

Trading at $8 if it breaks downtrend line 1st resistance 8.75
TrendingMoves

I really want to buy this meme coin because of significance it holds. these are levels where it can bounce or where i am buying or adding or using stop below last 10.7 level Right now holding 11.30 level and 100MA 4hr . it may break resistance . keeping an eye on it and adding more bags
TrendingMoves

If ETHFI breaks 710 resistance a potential target is 200 4hr MA Use stop loss if there is fakeout.
TrendingMoves
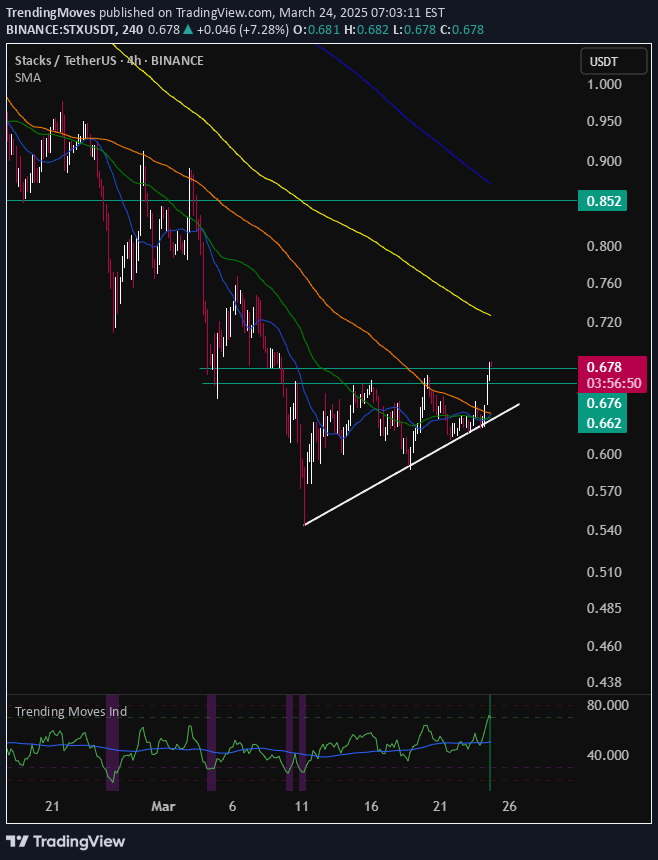
STX breaking local resistance and closed 4hr candle above it if Price holding here would see a run to 4hr 200MA and then Next target around .830 will buy if its retrace to 15min 50ma
Disclaimer
Any content and materials included in Finbeet's website and official communication channels are a compilation of personal opinions and analyses and are not binding. They do not constitute any recommendation for buying, selling, entering or exiting the stock market and cryptocurrency market. Also, all news and analyses included in the website and channels are merely republished information from official and unofficial domestic and foreign sources, and it is obvious that users of the said content are responsible for following up and ensuring the authenticity and accuracy of the materials. Therefore, while disclaiming responsibility, it is declared that the responsibility for any decision-making, action, and potential profit and loss in the capital market and cryptocurrency market lies with the trader.