
bebush
@t_bebush

What symbols does the trader recommend buying?
Purchase History
Trader Messages
Filter
Message Type
Tron/TRX on the Verge of a Drop
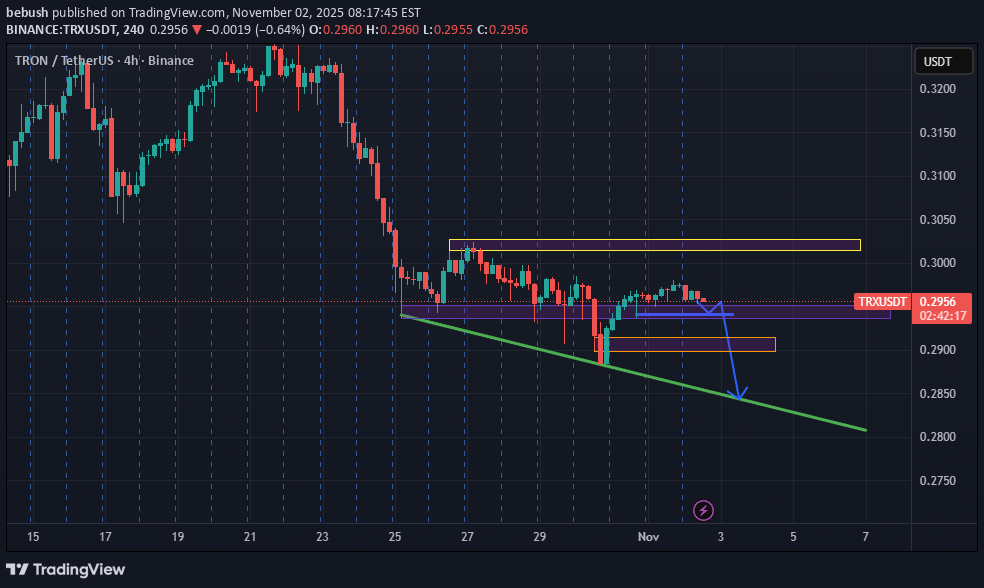
The first expected level is the blue one, where breaking it makes the orange zones and the green trend line important, with a higher likelihood of reaction on the trend line. During the reaction for an upward move, if it hits the purple zone and lacks the strength to break it, there's a chance of continued decline. And when the price crosses the yellow zone, it signals that the uptrend is beginning. TRXUSDT
Ripple on the Verge of a Heavy Drop
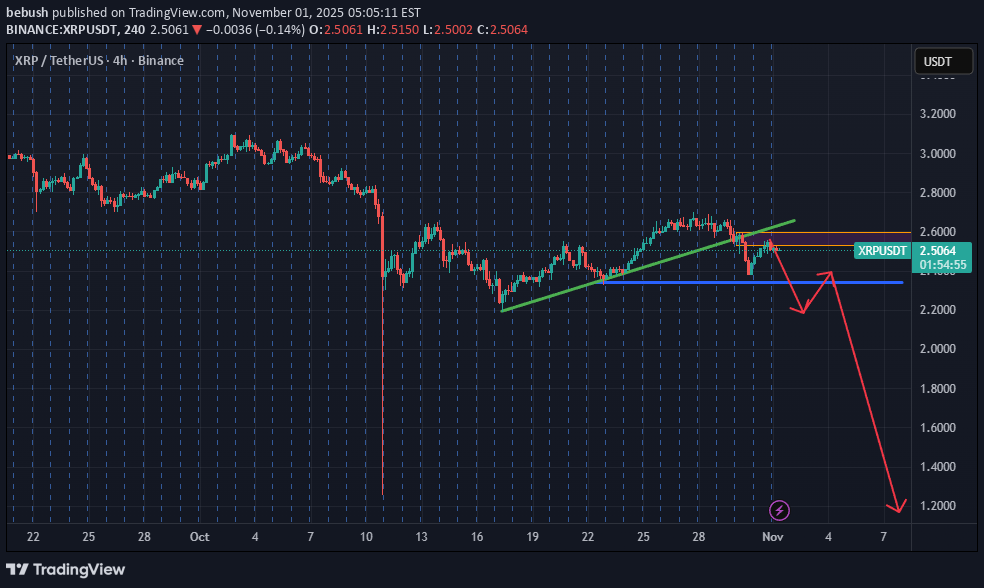
Given the breakdown of the trend line (green line), the formation of a supply zone (orange zone), and the price pulling back to the supply zone with a reaction at the supply level, our first support area is the blue line zones. This is because, after breaking the trend line, the price tends to oscillate between the trend line and the next level. If the price breaks below the blue level, it will reach the marked areas, indicating that Ripple could potentially drop to around 1.16. XRPUSDT
IOTA on the Brink of a Massive Surge in the Next Bull Run: Key L
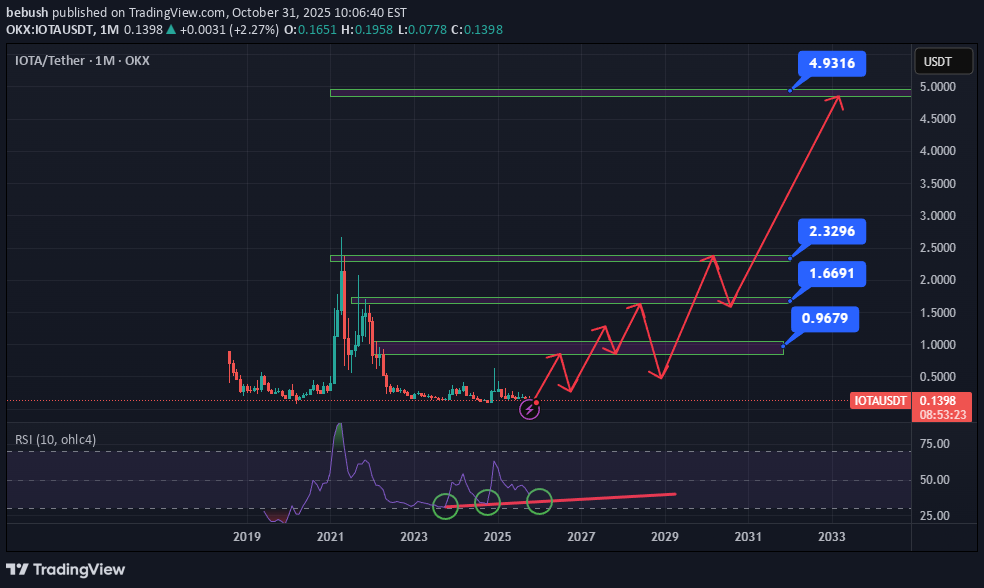
This is a long-term analysis of the IOTA cryptocurrency. All key levels have been identified, and considering the divergence formed in the RSI along with the marked collision points, the safe entry point is at the third collision with the RSI trend line and the reaction to it. I predict it will reach that area in January or February and start reacting. IOTAUSDT
Gold at a Critical Crossroads: Surge to $4700 or Drop to $3500?
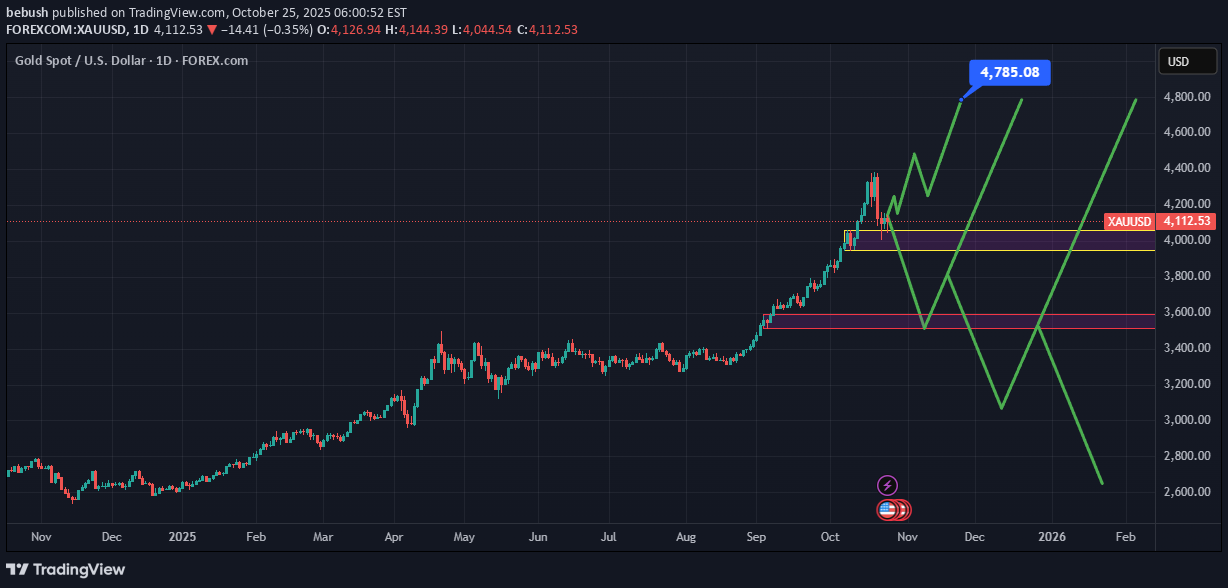
If the price breaks through the yellow zone, it could reach the red zone range. And if it doesn't cross the yellow zone, there's a chance it could head toward the 4700 range
Cardano/ADA Primed for Explosion: Key Targets Up to $5

The chart should display sufficient key points and important levels while maintaining simplicity and order, avoiding clutter – this is what true analysis means. These levels in the monthly timeframe provide ideal zones for long-term investors to enter and exit, and offer traders a broader movement perspective since we're in a higher timeframe ADAUSD
APPLE/AAPL Stock: Movement Scenarios and Key Reaction Points

These are all the key stock levels for Apple that are fully and precisely displayed in the image – including supports, resistances, and potential reaction points for traders AAPL
Bitcoin: Possible Scenarios on the Daily Chart

🔴 Watch the red line! If BTC breaks above — bulls take control. If not — expect another drop. Always manage your risk around reversal zones! 💥 #Bitcoin #BTC #Crypto #BTCUSD #CryptoTrading #TradingSetup #DailyChart #PriceAction
Disclaimer
Any content and materials included in Finbeet's website and official communication channels are a compilation of personal opinions and analyses and are not binding. They do not constitute any recommendation for buying, selling, entering or exiting the stock market and cryptocurrency market. Also, all news and analyses included in the website and channels are merely republished information from official and unofficial domestic and foreign sources, and it is obvious that users of the said content are responsible for following up and ensuring the authenticity and accuracy of the materials. Therefore, while disclaiming responsibility, it is declared that the responsibility for any decision-making, action, and potential profit and loss in the capital market and cryptocurrency market lies with the trader.