
cryptownian
@t_cryptownian

What symbols does the trader recommend buying?
Purchase History
Trader Messages
Filter
Message Type
cryptownian
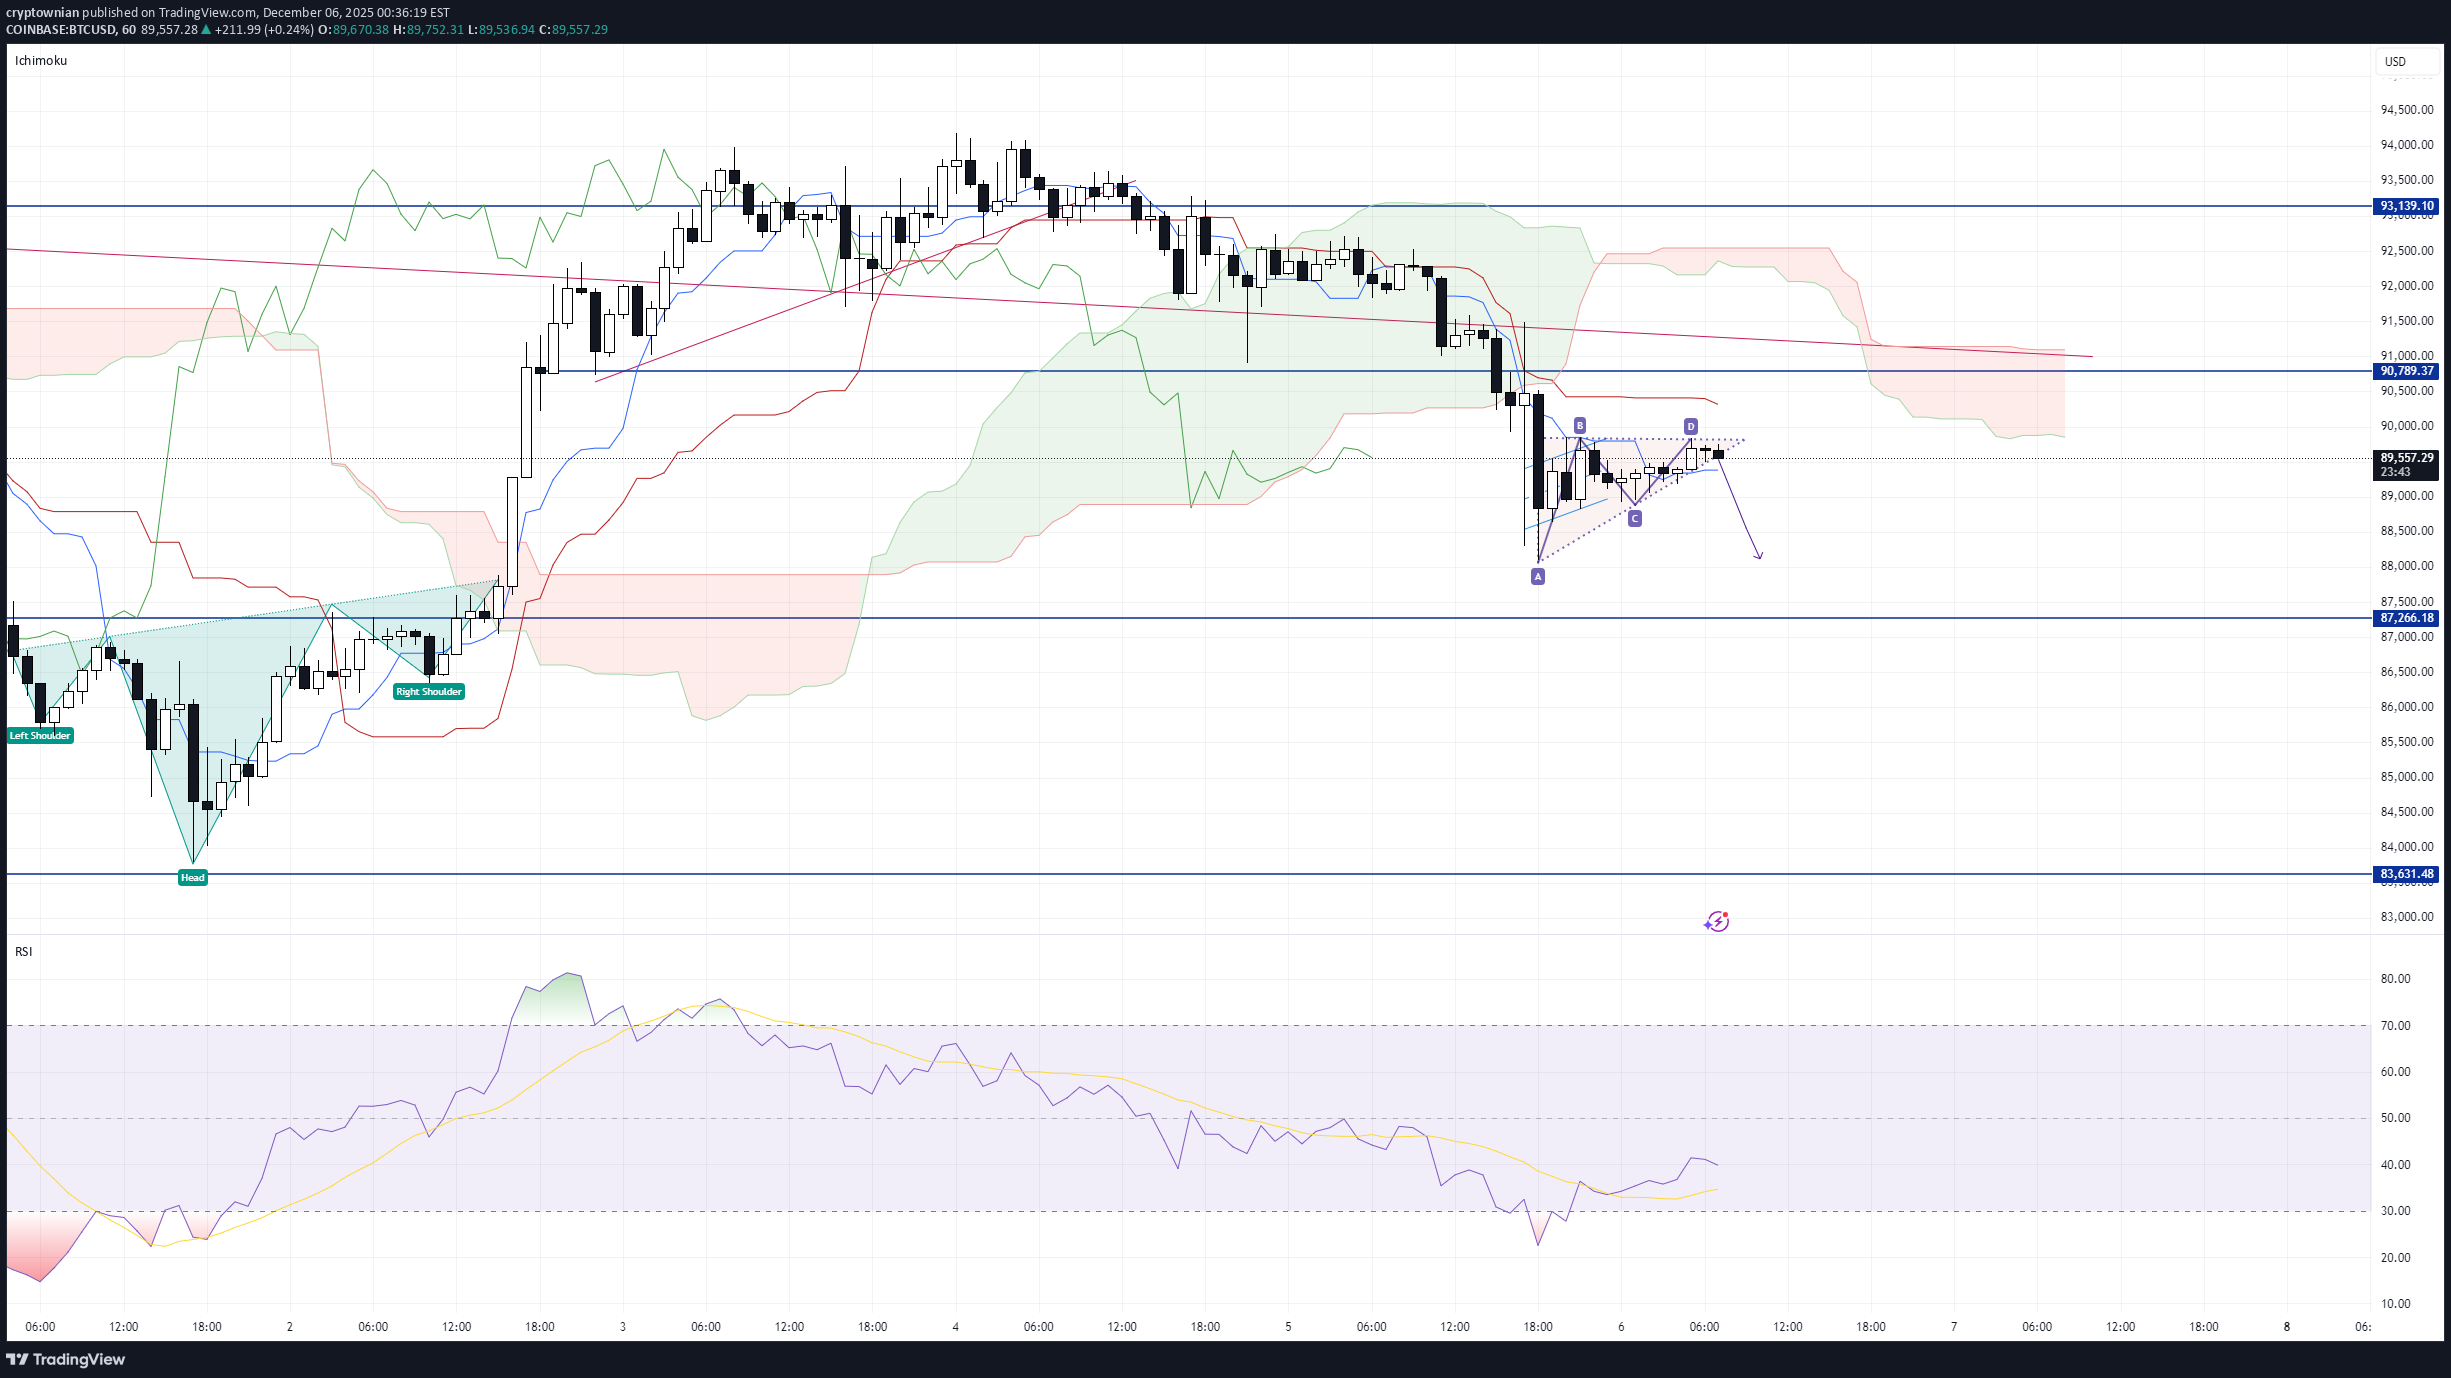
lets have a look at standard candle patterns and see what is possible at this current stage 1 btc usd ha made a double bottom and is testing the inner high of the W shape we see a double touch on the 30 min we see a bullish ingulfing pattern we see rejectoin at tis level it does not seem strong at this point but i think the importance of the level will reveal it self . the confirmation to me is a srtong candle above 90k on the 30 min time line the ris is sitting low the adx is showing a sign of dropping on the 1h the macd is still bearish along with the rsi so lets see where the buy is coming from at this point there is no clear buy so wating is the best option lets see where we are at 9pm south african time
cryptownian
bitcoin bearish pendant
bitcoin has created a bearish pendant a break below could see more down swing lets see what happens
cryptownian
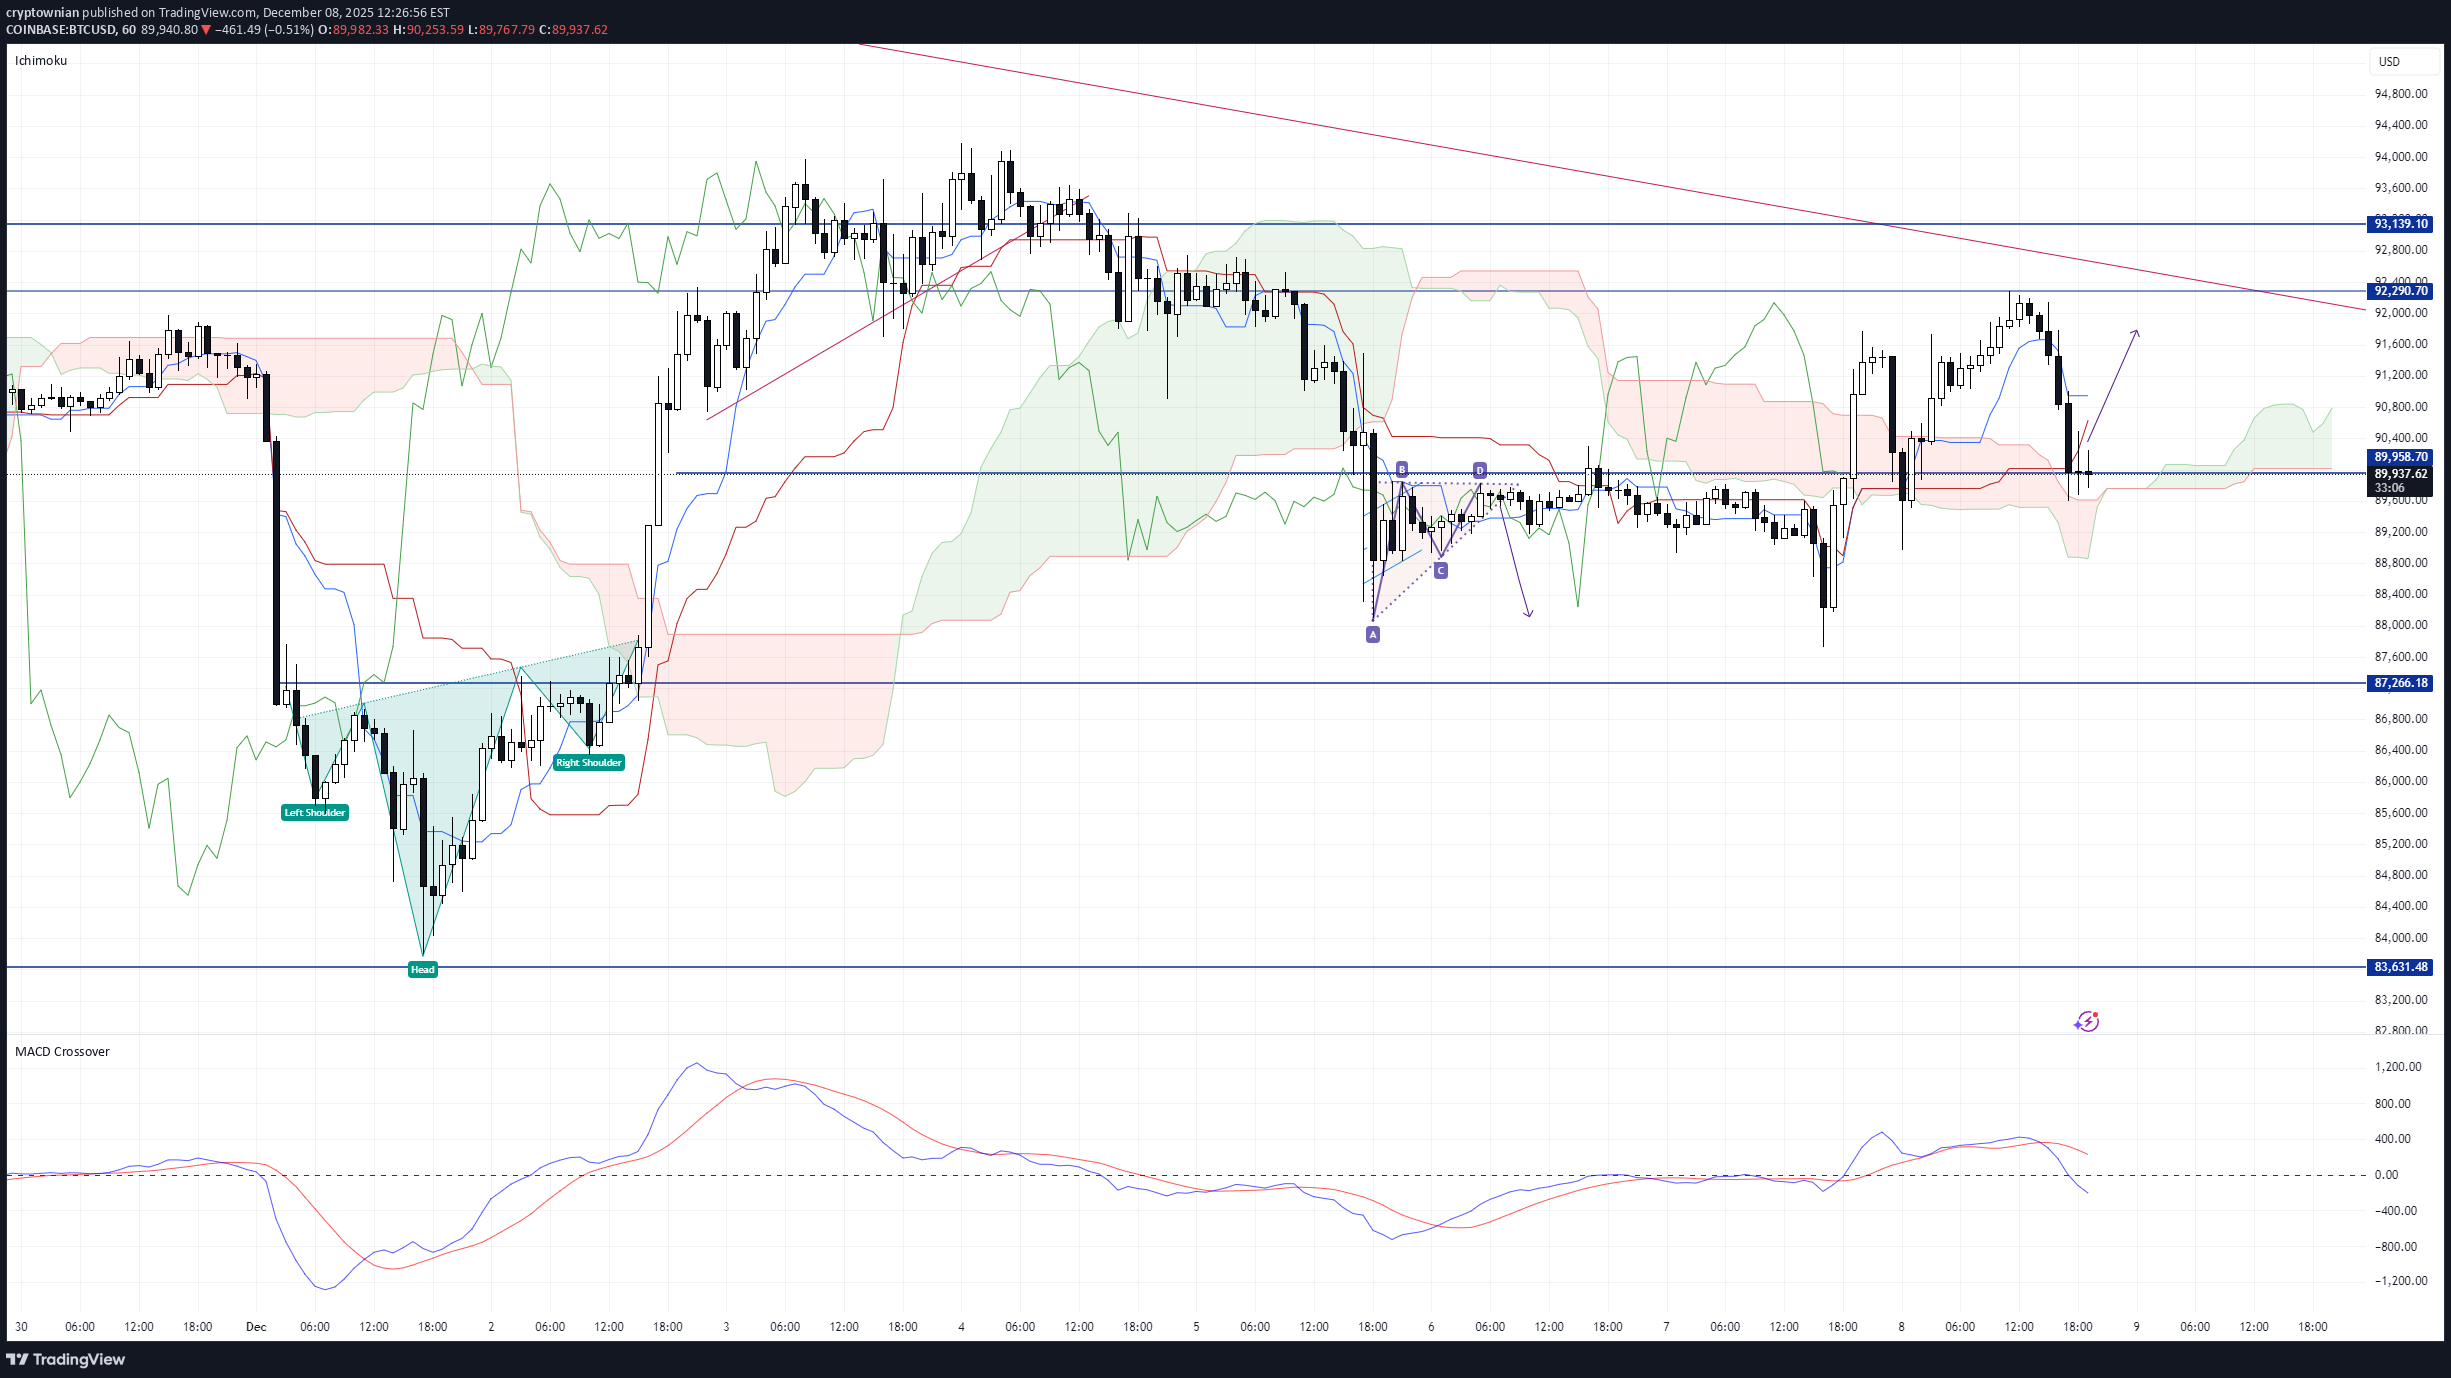
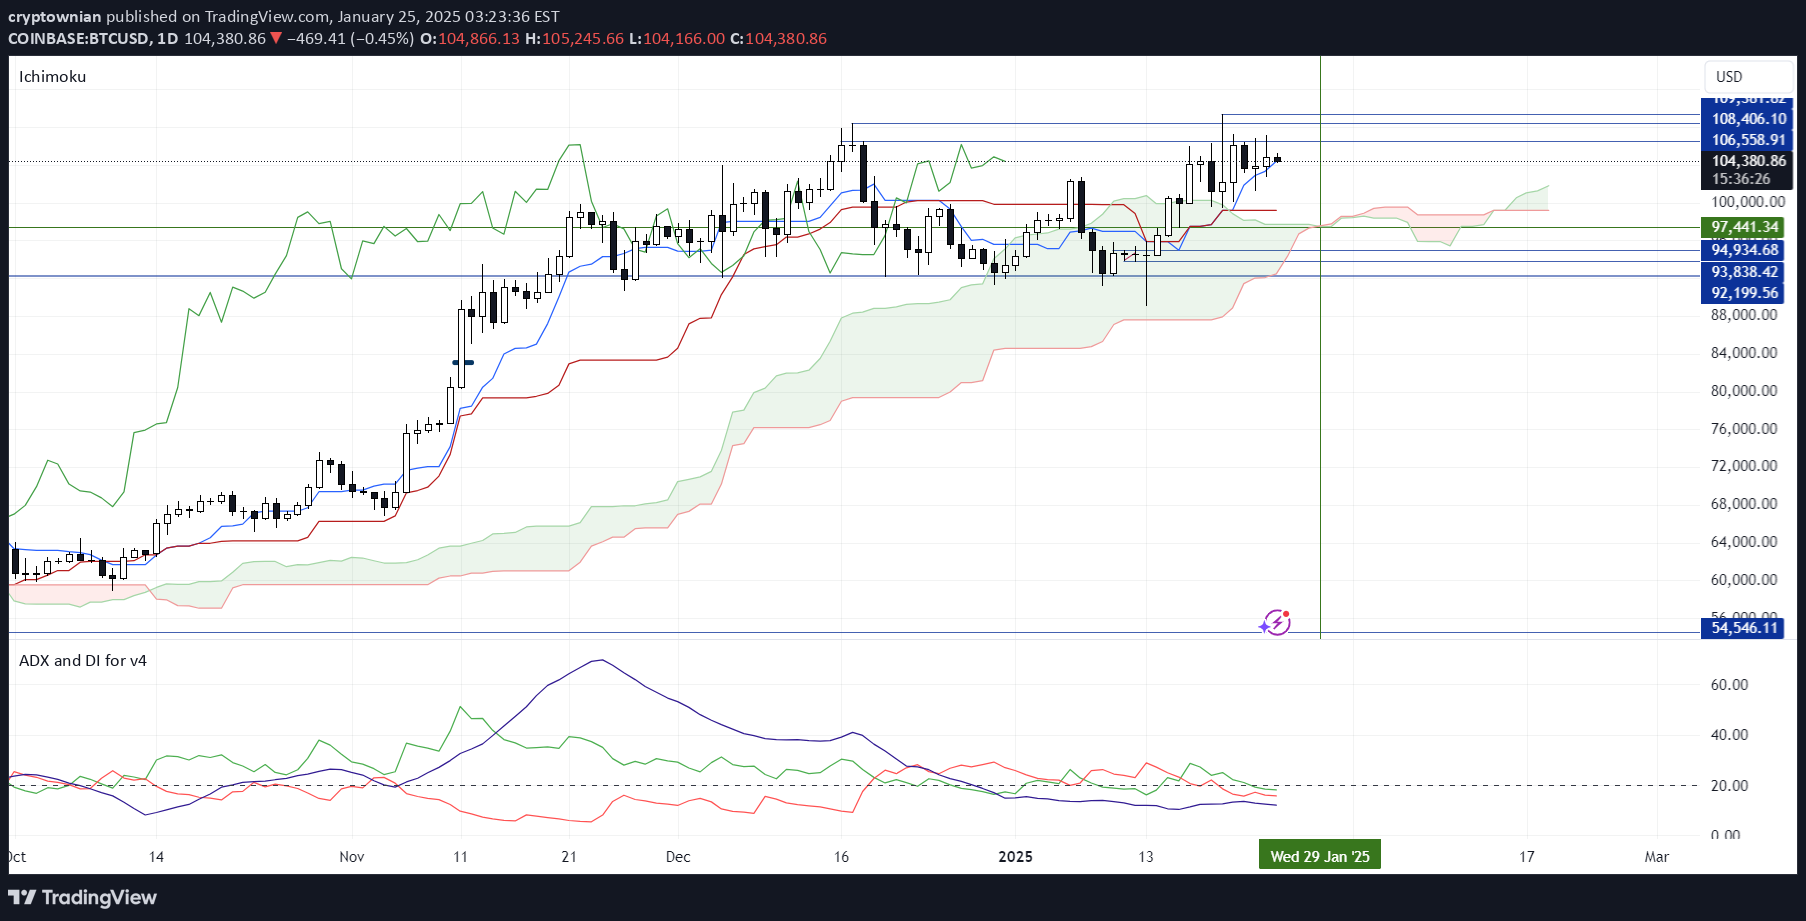
BITCOIN TOUCHED WEEKLY SUPPORT POSSIBLE BUY POSTION AVAIABLE
BITCOIN touched weekly support again and moved up touching dynamic trend line ichimoku indicate more downswing on lower time lines a break and close on the 4h time frame above 95k could mean more upswing for btc in terms of candle stick patterns we that there is a indication of dojis forming at the level that is pressing against the bottom of the cloud the cloud and dynamic resistance level is confirming a resistance leve at 95k the macd is showing that there is a slight change for some upswing the rsi is above the 50 line are we looking at a return to 100k for btc are we going to see a break below support at 92k if so look more a drop between 78 and 74
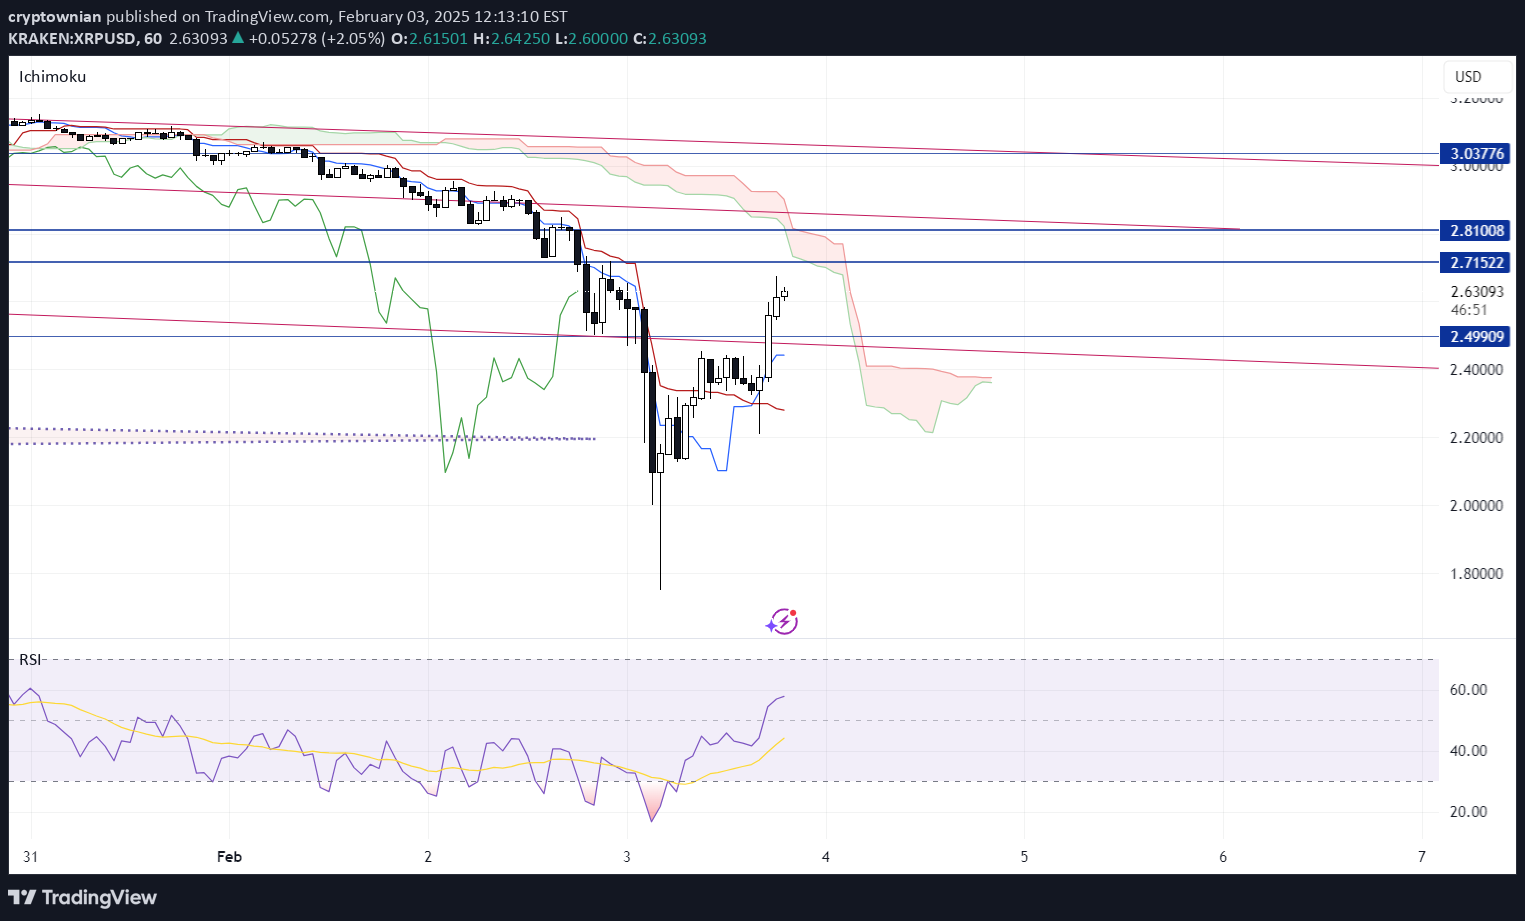
cryptownian
ripple is showing bullish signs but we need stronger confirmation at this point to be happy if a trade at 2.4 or lower has been entered i would say look close and wait for a close above 2.8 and 3.4 to be fully content happy trading and leave a comment if this was usefull
cryptownian
hi allif the previous analysis helped you to get out early in ripple please let me know.we could see ripple moving up to over 5dollars if it returns to 3dollars and break 3.3 highwe are seeing a bullflag even though it broke lowi think the flag is still valid because the market came back up in rangeso lease leave a comment if this helped you out in any way thanks and happy trading
cryptownian
hi guys the following video is a case study of pass movement to see if btc will break through the current high it has created please like if the video has given you any info that can assist you on your trading journeyand please trade save
cryptownian
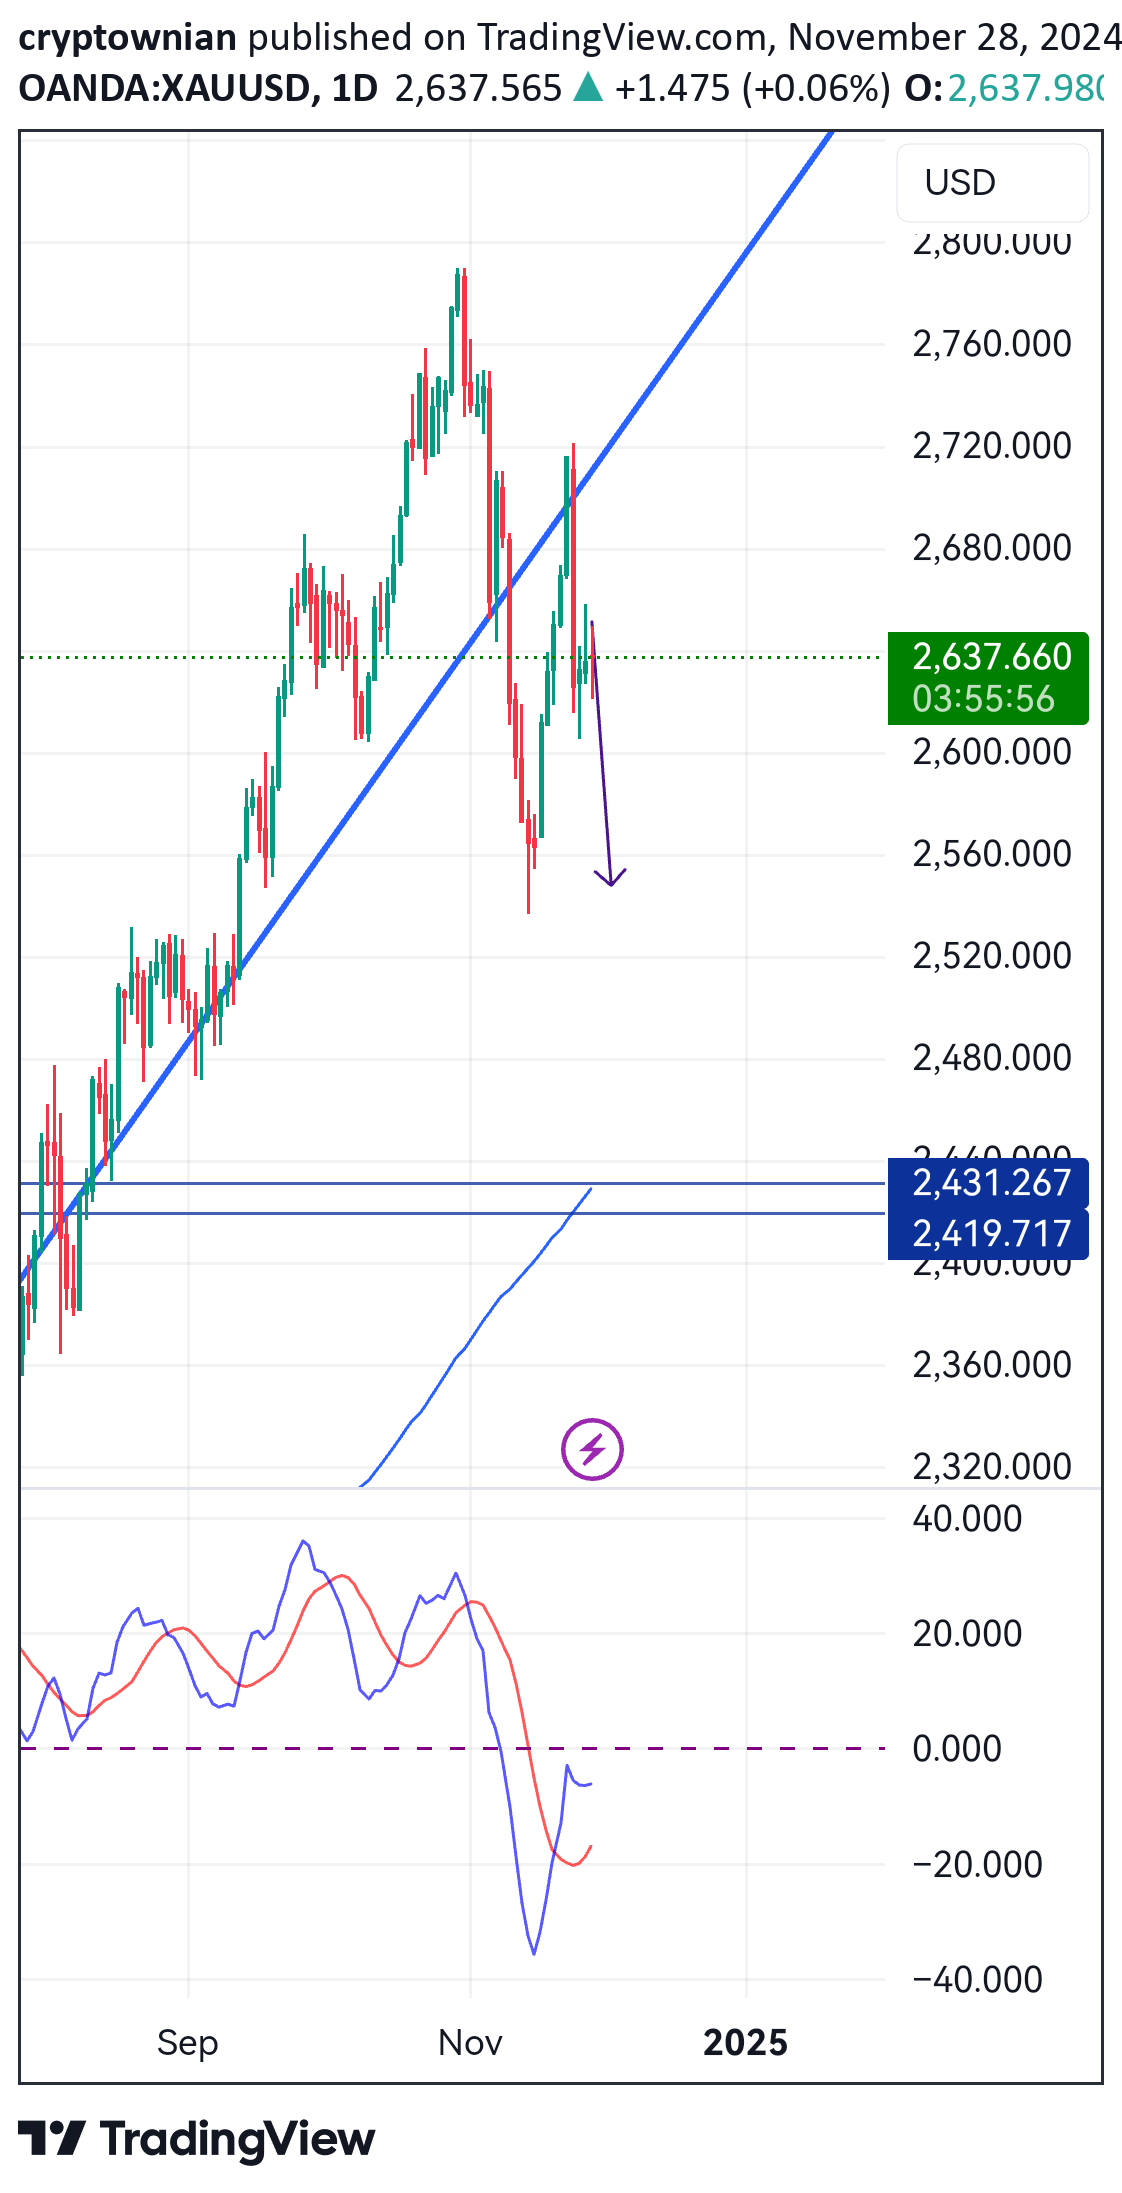
GOLD we cold see more drop in Gold We could be in the begining of a wave pattern before we see some bullish movement or more bearishCurrently on the 4h and dailyWe can see a break and test of a trend line Well we could see a drop to the 200 ma before the mo e up again
Disclaimer
Any content and materials included in Finbeet's website and official communication channels are a compilation of personal opinions and analyses and are not binding. They do not constitute any recommendation for buying, selling, entering or exiting the stock market and cryptocurrency market. Also, all news and analyses included in the website and channels are merely republished information from official and unofficial domestic and foreign sources, and it is obvious that users of the said content are responsible for following up and ensuring the authenticity and accuracy of the materials. Therefore, while disclaiming responsibility, it is declared that the responsibility for any decision-making, action, and potential profit and loss in the capital market and cryptocurrency market lies with the trader.