
dRends35
@t_dRends35

What symbols does the trader recommend buying?
Purchase History
Trader Messages
Filter
Message Type
dRends35
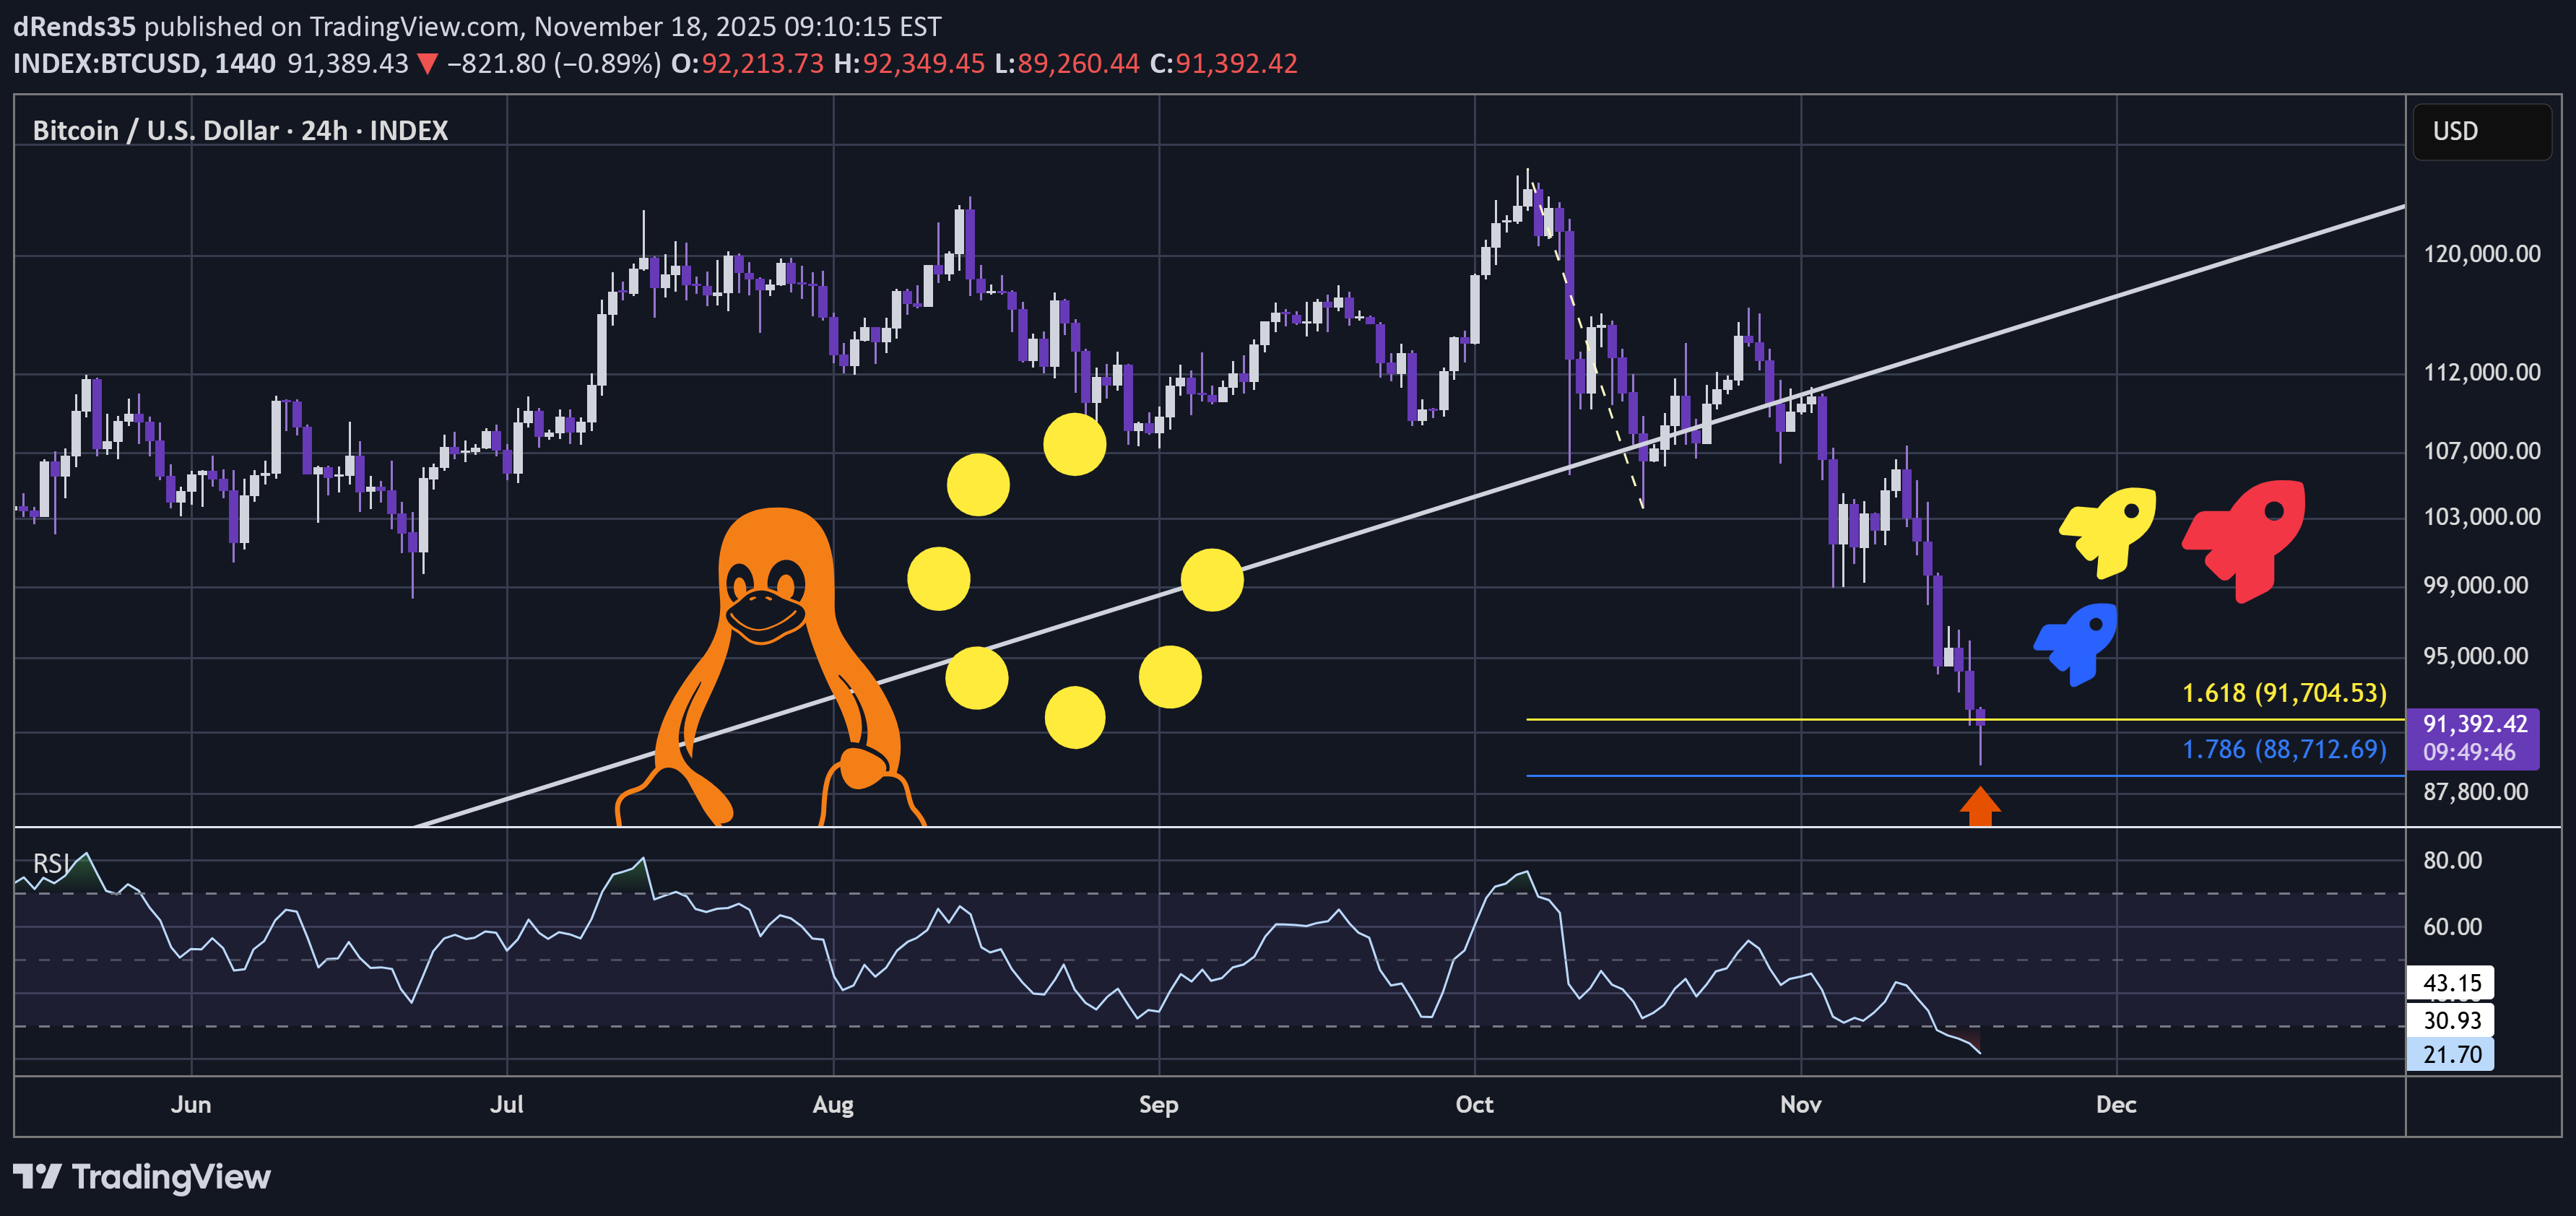
BTC - Regressive Wave Completion?
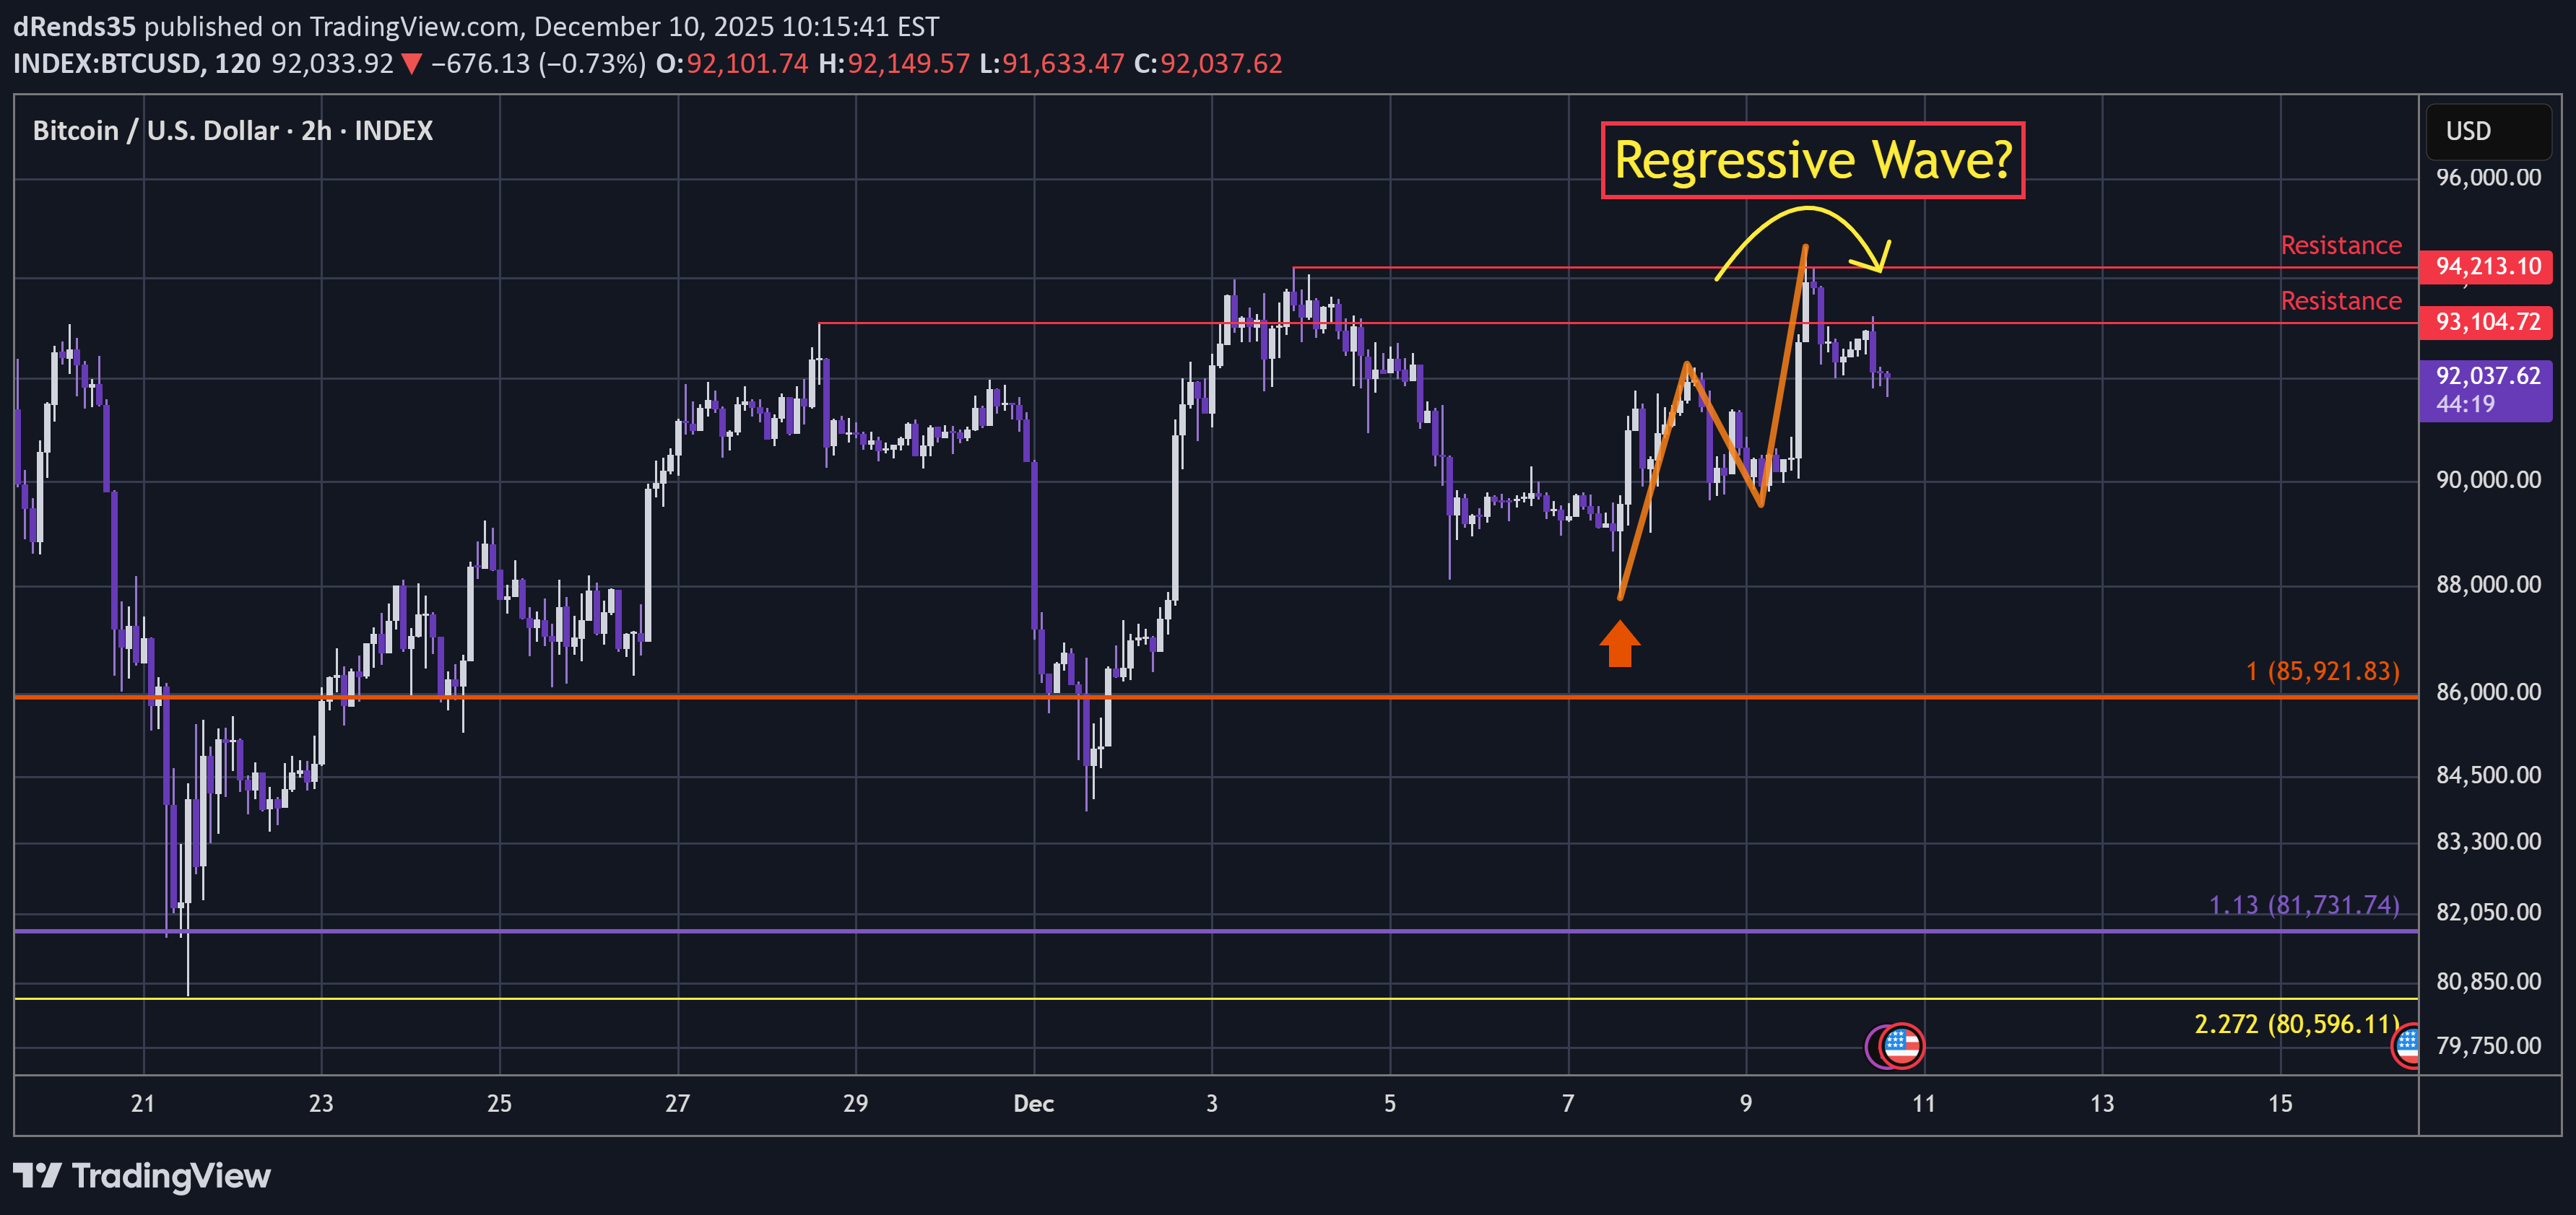
Notice the lower wicked downside shakeout before the 3 wave pop (arrow). That looks likely to be a regressive wave (short squeeze) to achieve a very fast upside move that sweeps liquidity at the highs. But if it is a regressive wave then it will entirely exhaust in this area and the bearish trend can slump down. ... In contrast to this, this area should be deep I think, and I would imagine we are close to being on the brink of a real breakout. And that is the cat & mouse game in high and low time frames. For my trading, this is an area not to be flat but instead to hold strong coins. More wild ones like meme coins may print more bearish action if this is a regressive wave completion. So we'll see - if it is a regressive wave then we just have to wait and see when the trend gets picked up again. It may well slump back down to $88K lows with bounces along the way... But the bots are highly exotic and this could be a bear trap before the next wave up. Bullish HTF, somewhat bearish LTF. Holding coins that have more chance to drift sideways, avoiding the more wild coins that have more chance to print bearish 🧐.
dRends35
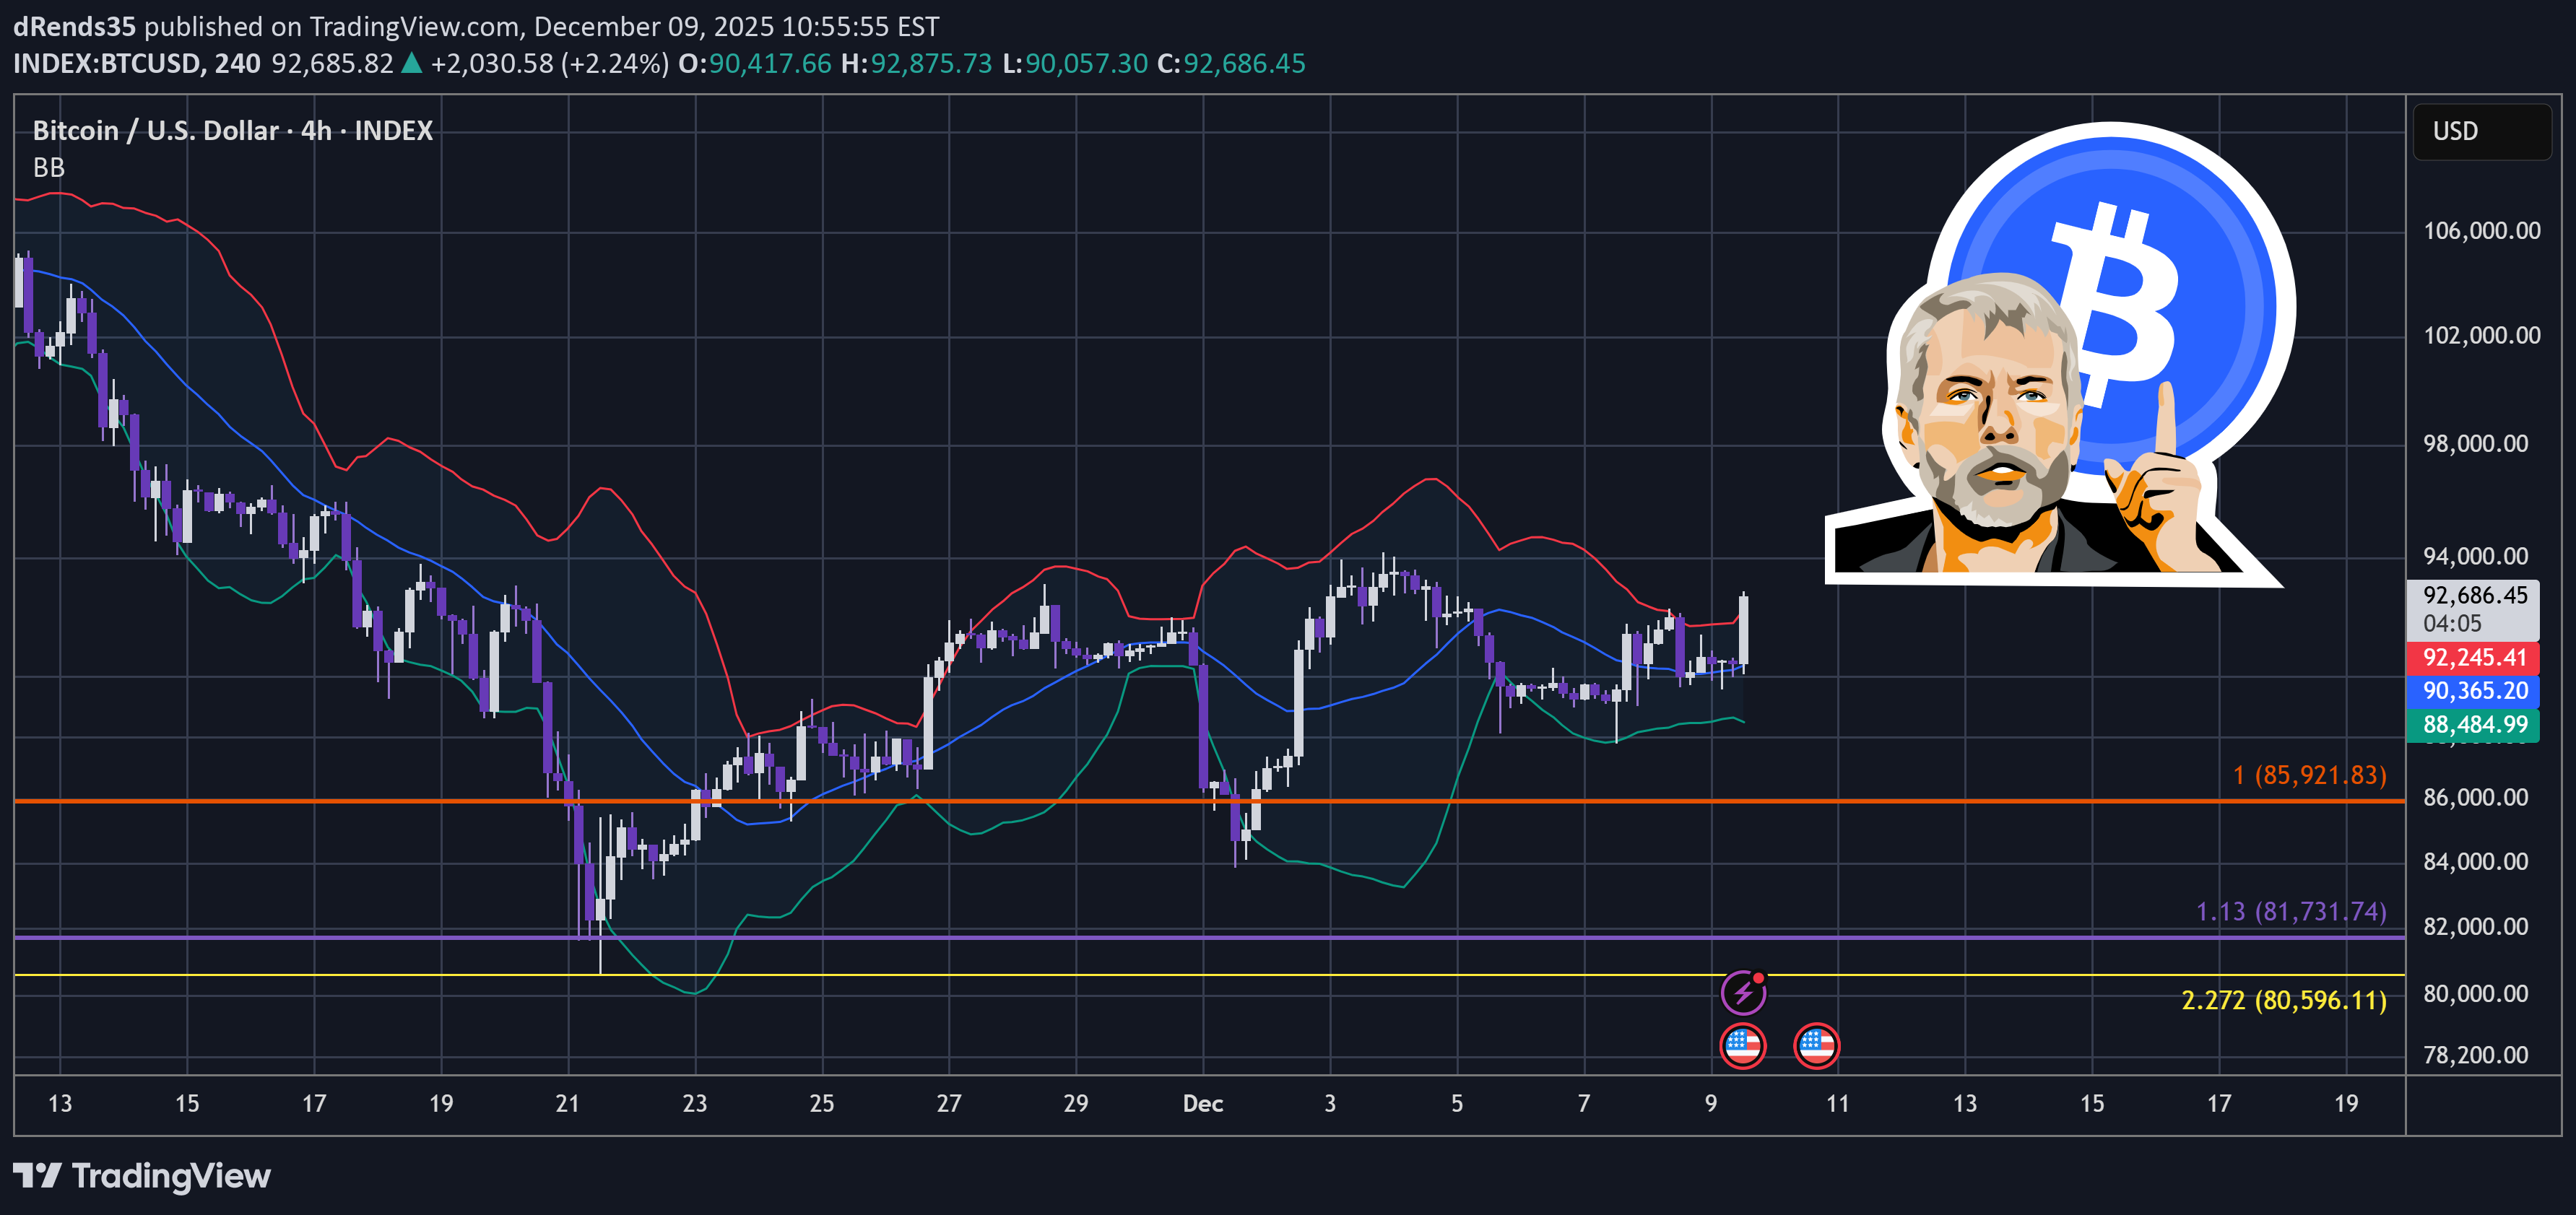
Trend is drifting sideways and decreasing chop is printing narrower Bollinger Bands. This may be signalling that an impulse is coming. Since it is deep and printing typical recovery structure, I think the impulse would be to the upside 🧐. This analysis is shared for educational purposes only and does not constitute financial advice. Please conduct your own research before making any trading decisions.Now piercing the upper Bollinger Band with impulse. This might be the start of the next wave up.
dRends35
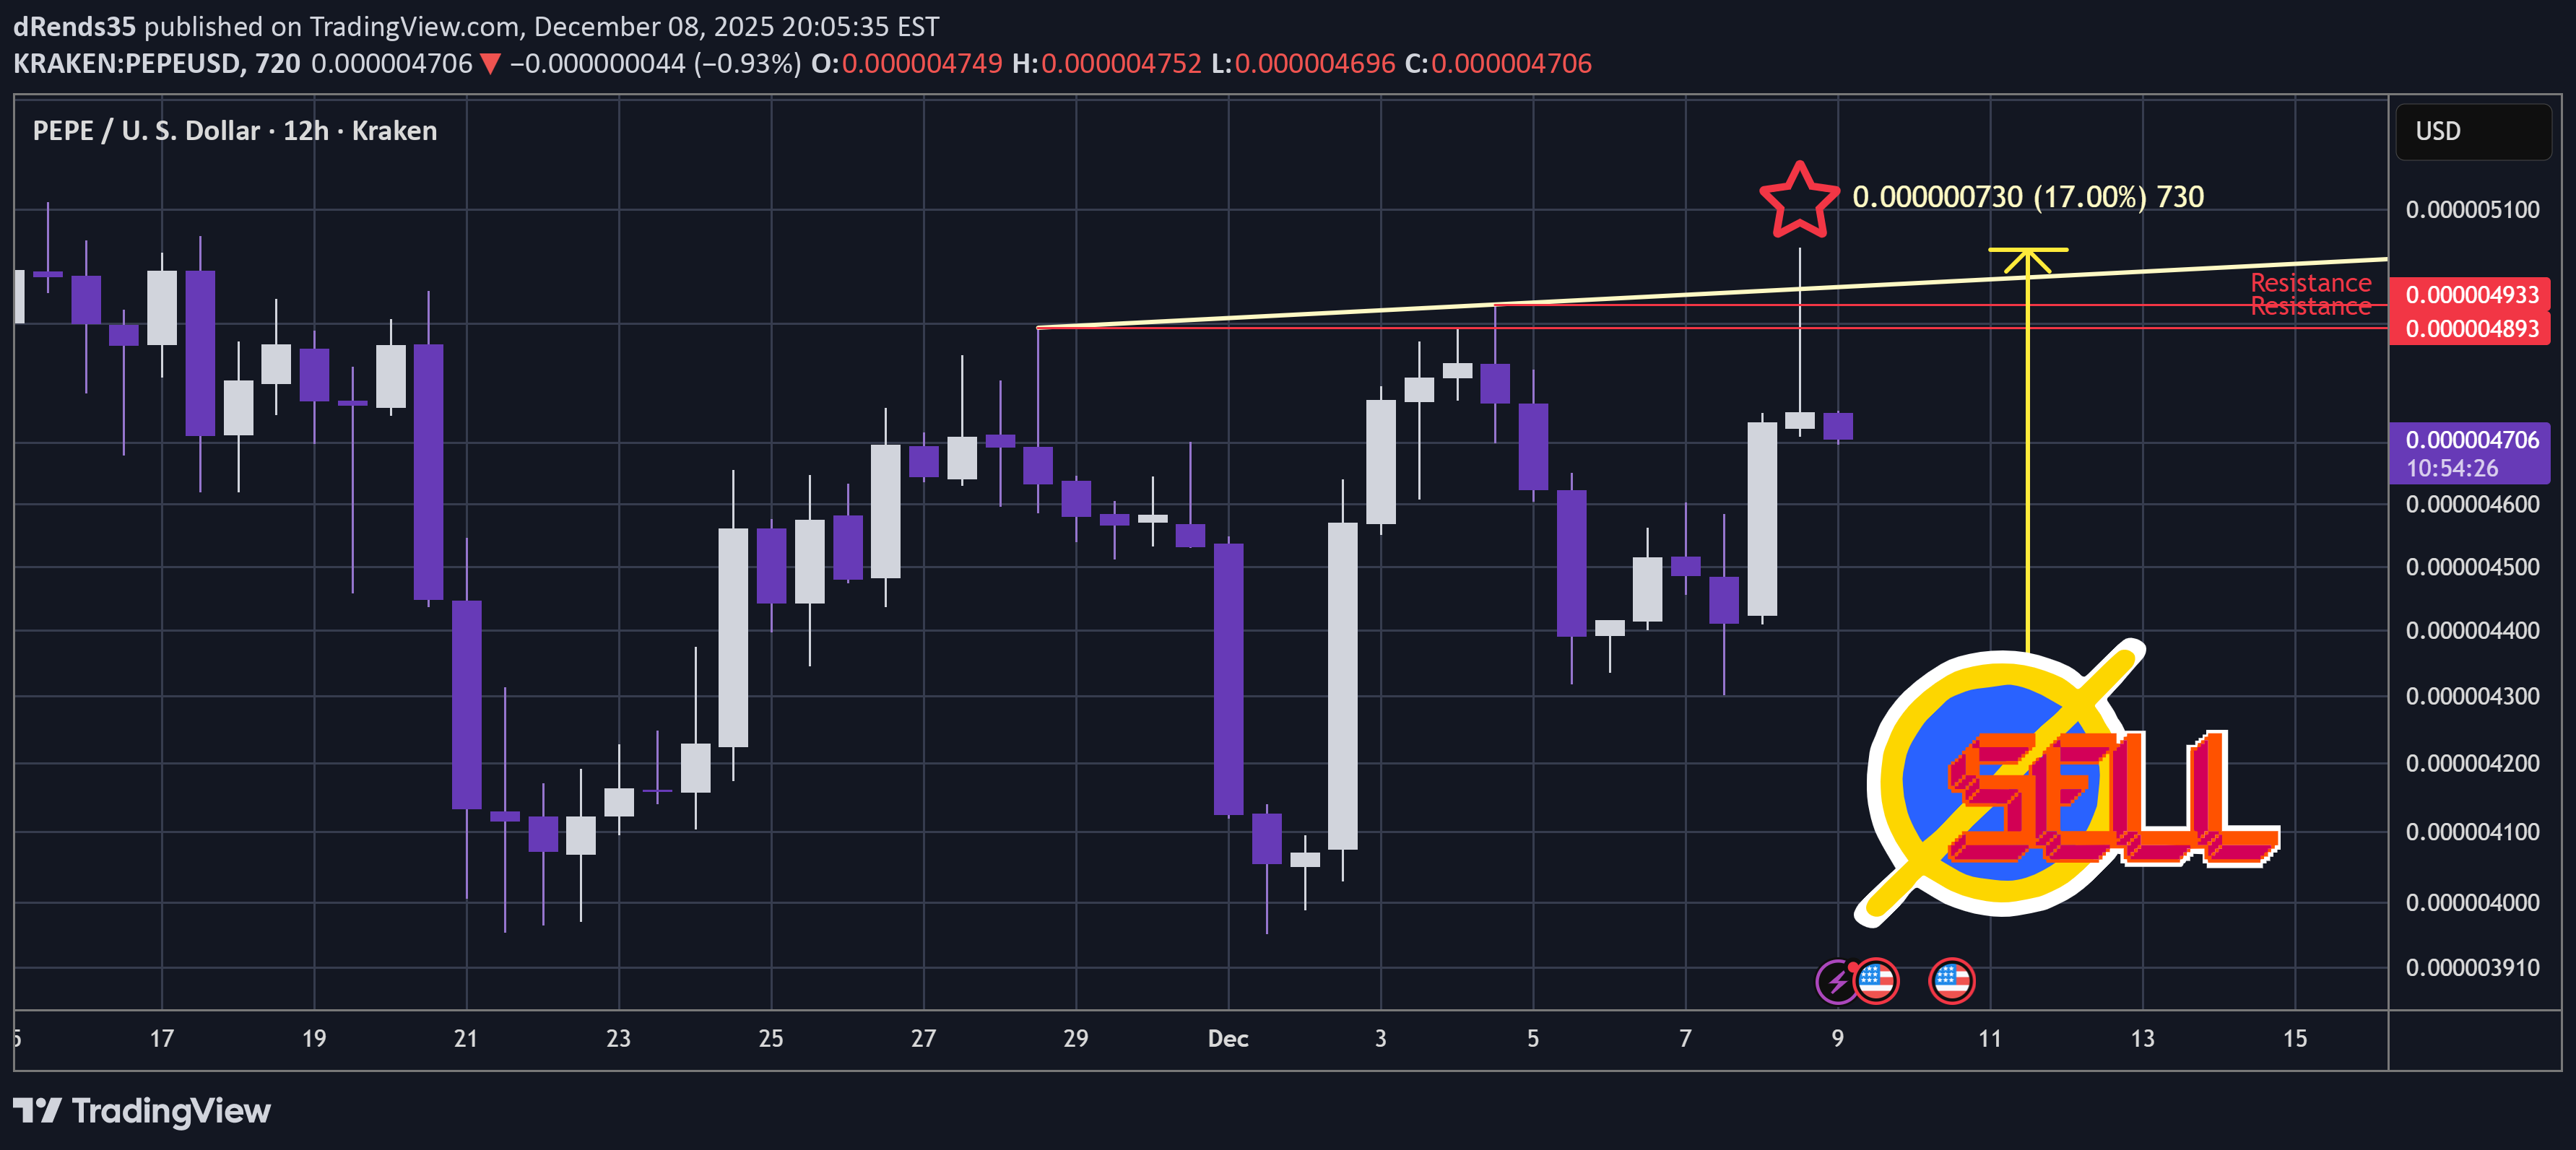
PEPE Had a nice 17% pop since yesterday. But it has just printed quite a nasty Shooting Star. The Star pierces through resistances and trendline so there is plenty of liquidity sweeping here. This signals a potential move back down. Overall this I think the market is getting close to a significant bounce but this is a little price action warning here. Perhaps there may be yet another market wobble in the pipeline. I took profit here - can't hold in front of this star and may be a dip to buy later 👍. This analysis is shared for educational purposes only and does not constitute financial advice. Please conduct your own research before making any trading decisions.
dRends35
ETH - Technical Dip Buy
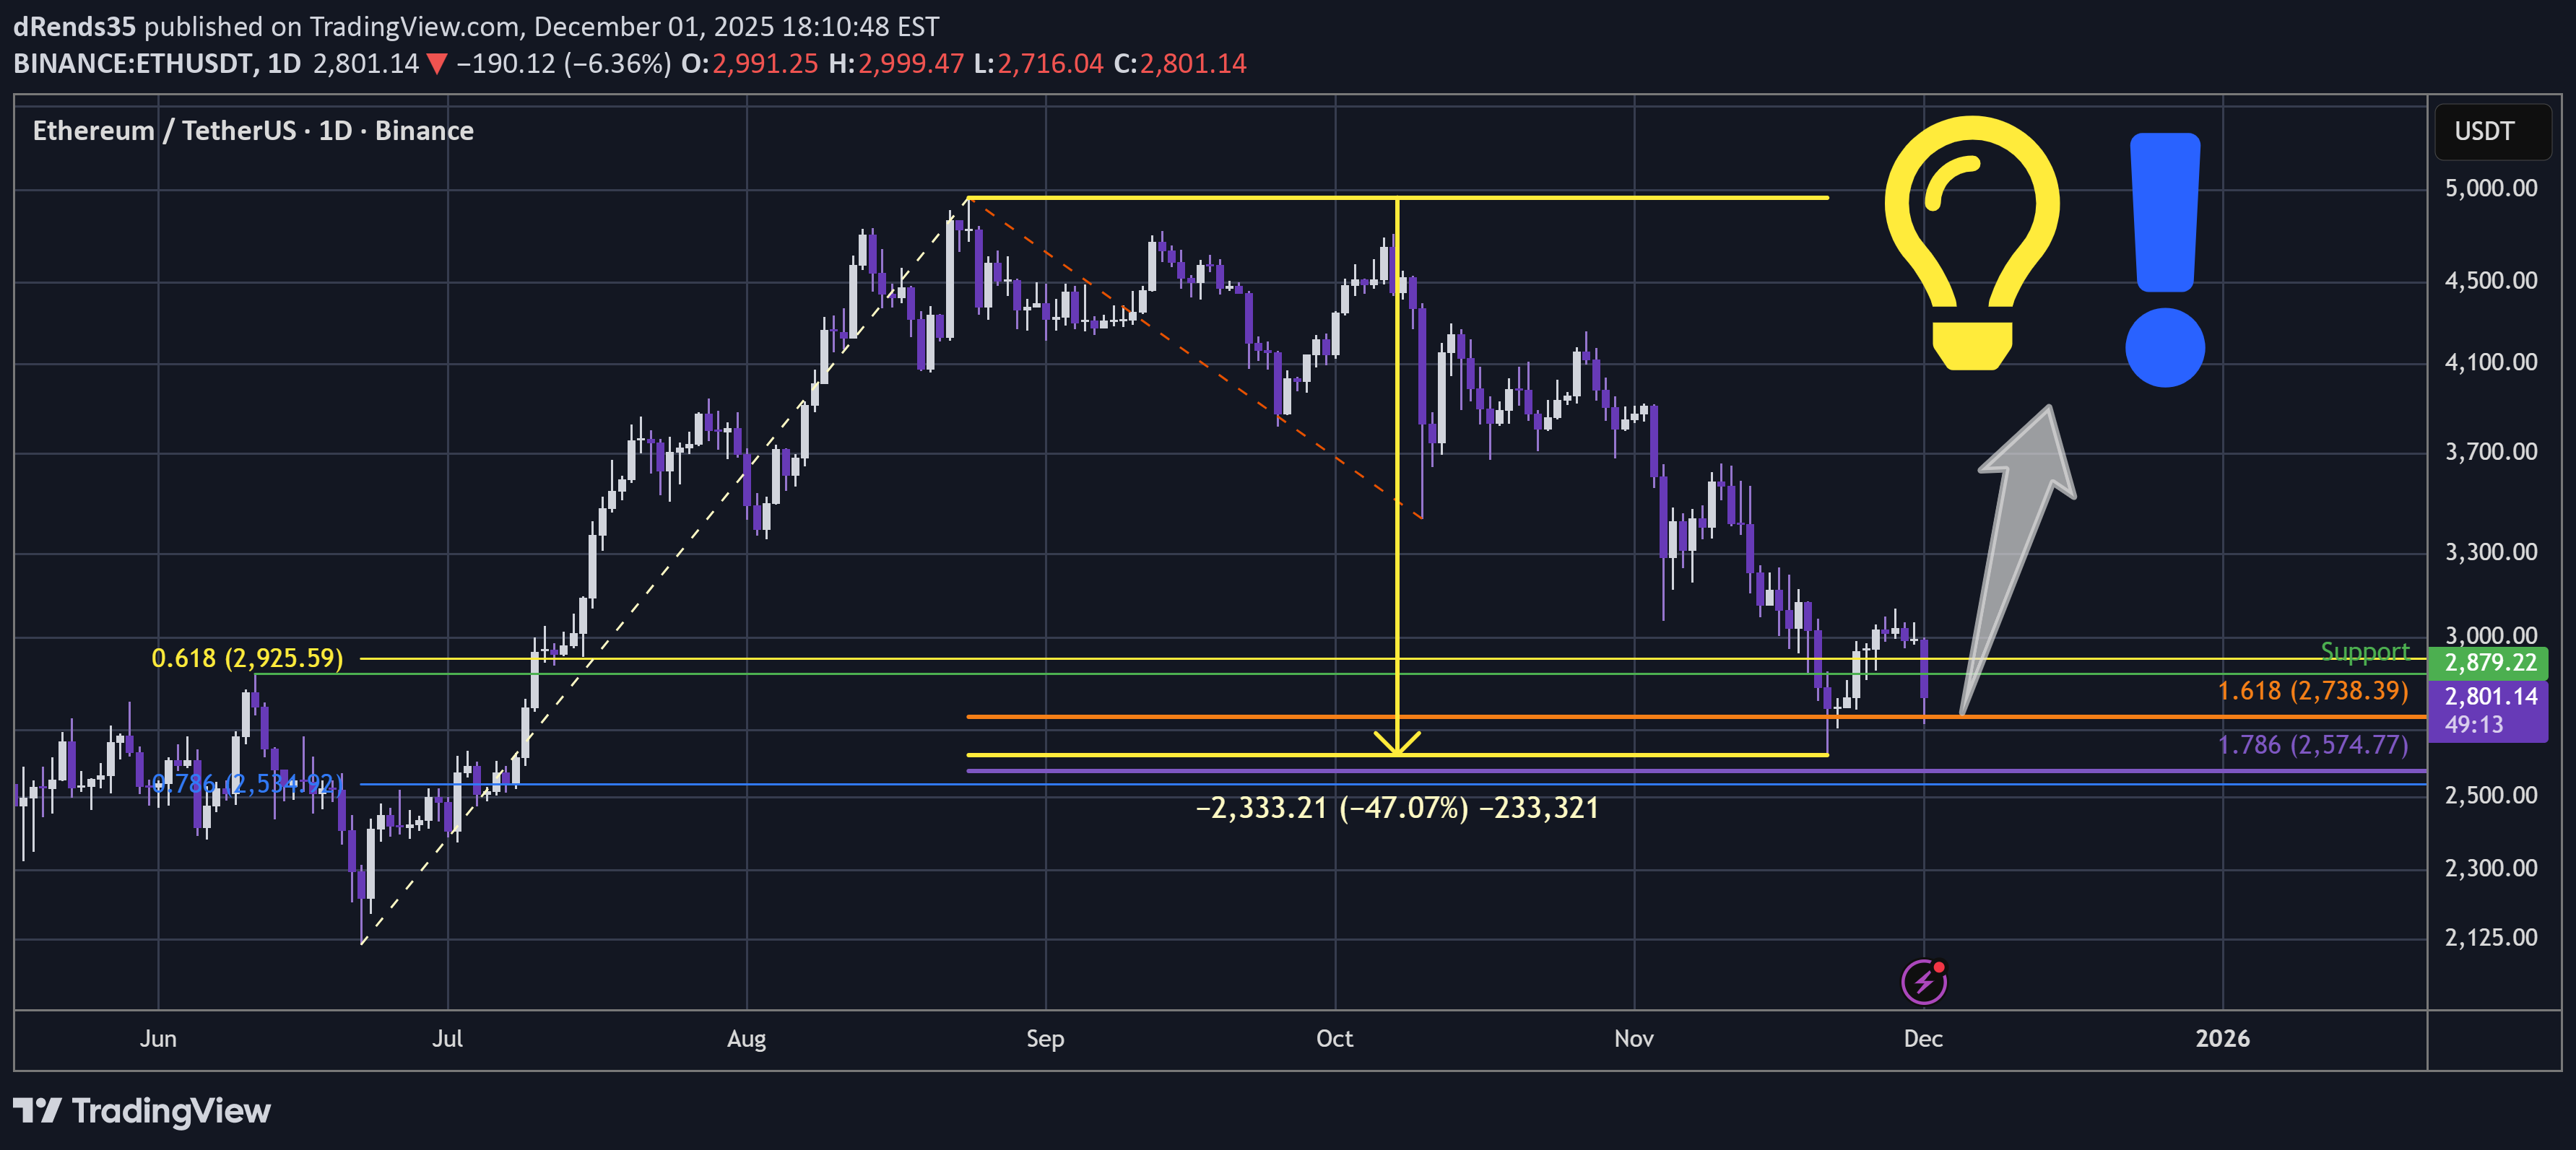
ETH down 47% and hitting a harmonious point of support and ratio confluence here. Similar detail to TOTAL but with even more ratio balance: a double Golden Window here and on LTF it has retraced to a GW - similar to TOTAL 👍. This is quite a clear buy here and crypto looks set to bounce. See linked TOTAL thread for more details. This analysis is shared for educational purposes only and does not constitute financial advice. Please conduct your own research before making any trading decisions.
dRends35
BTC - Fast Upside Whipsaw Signals Market Correction
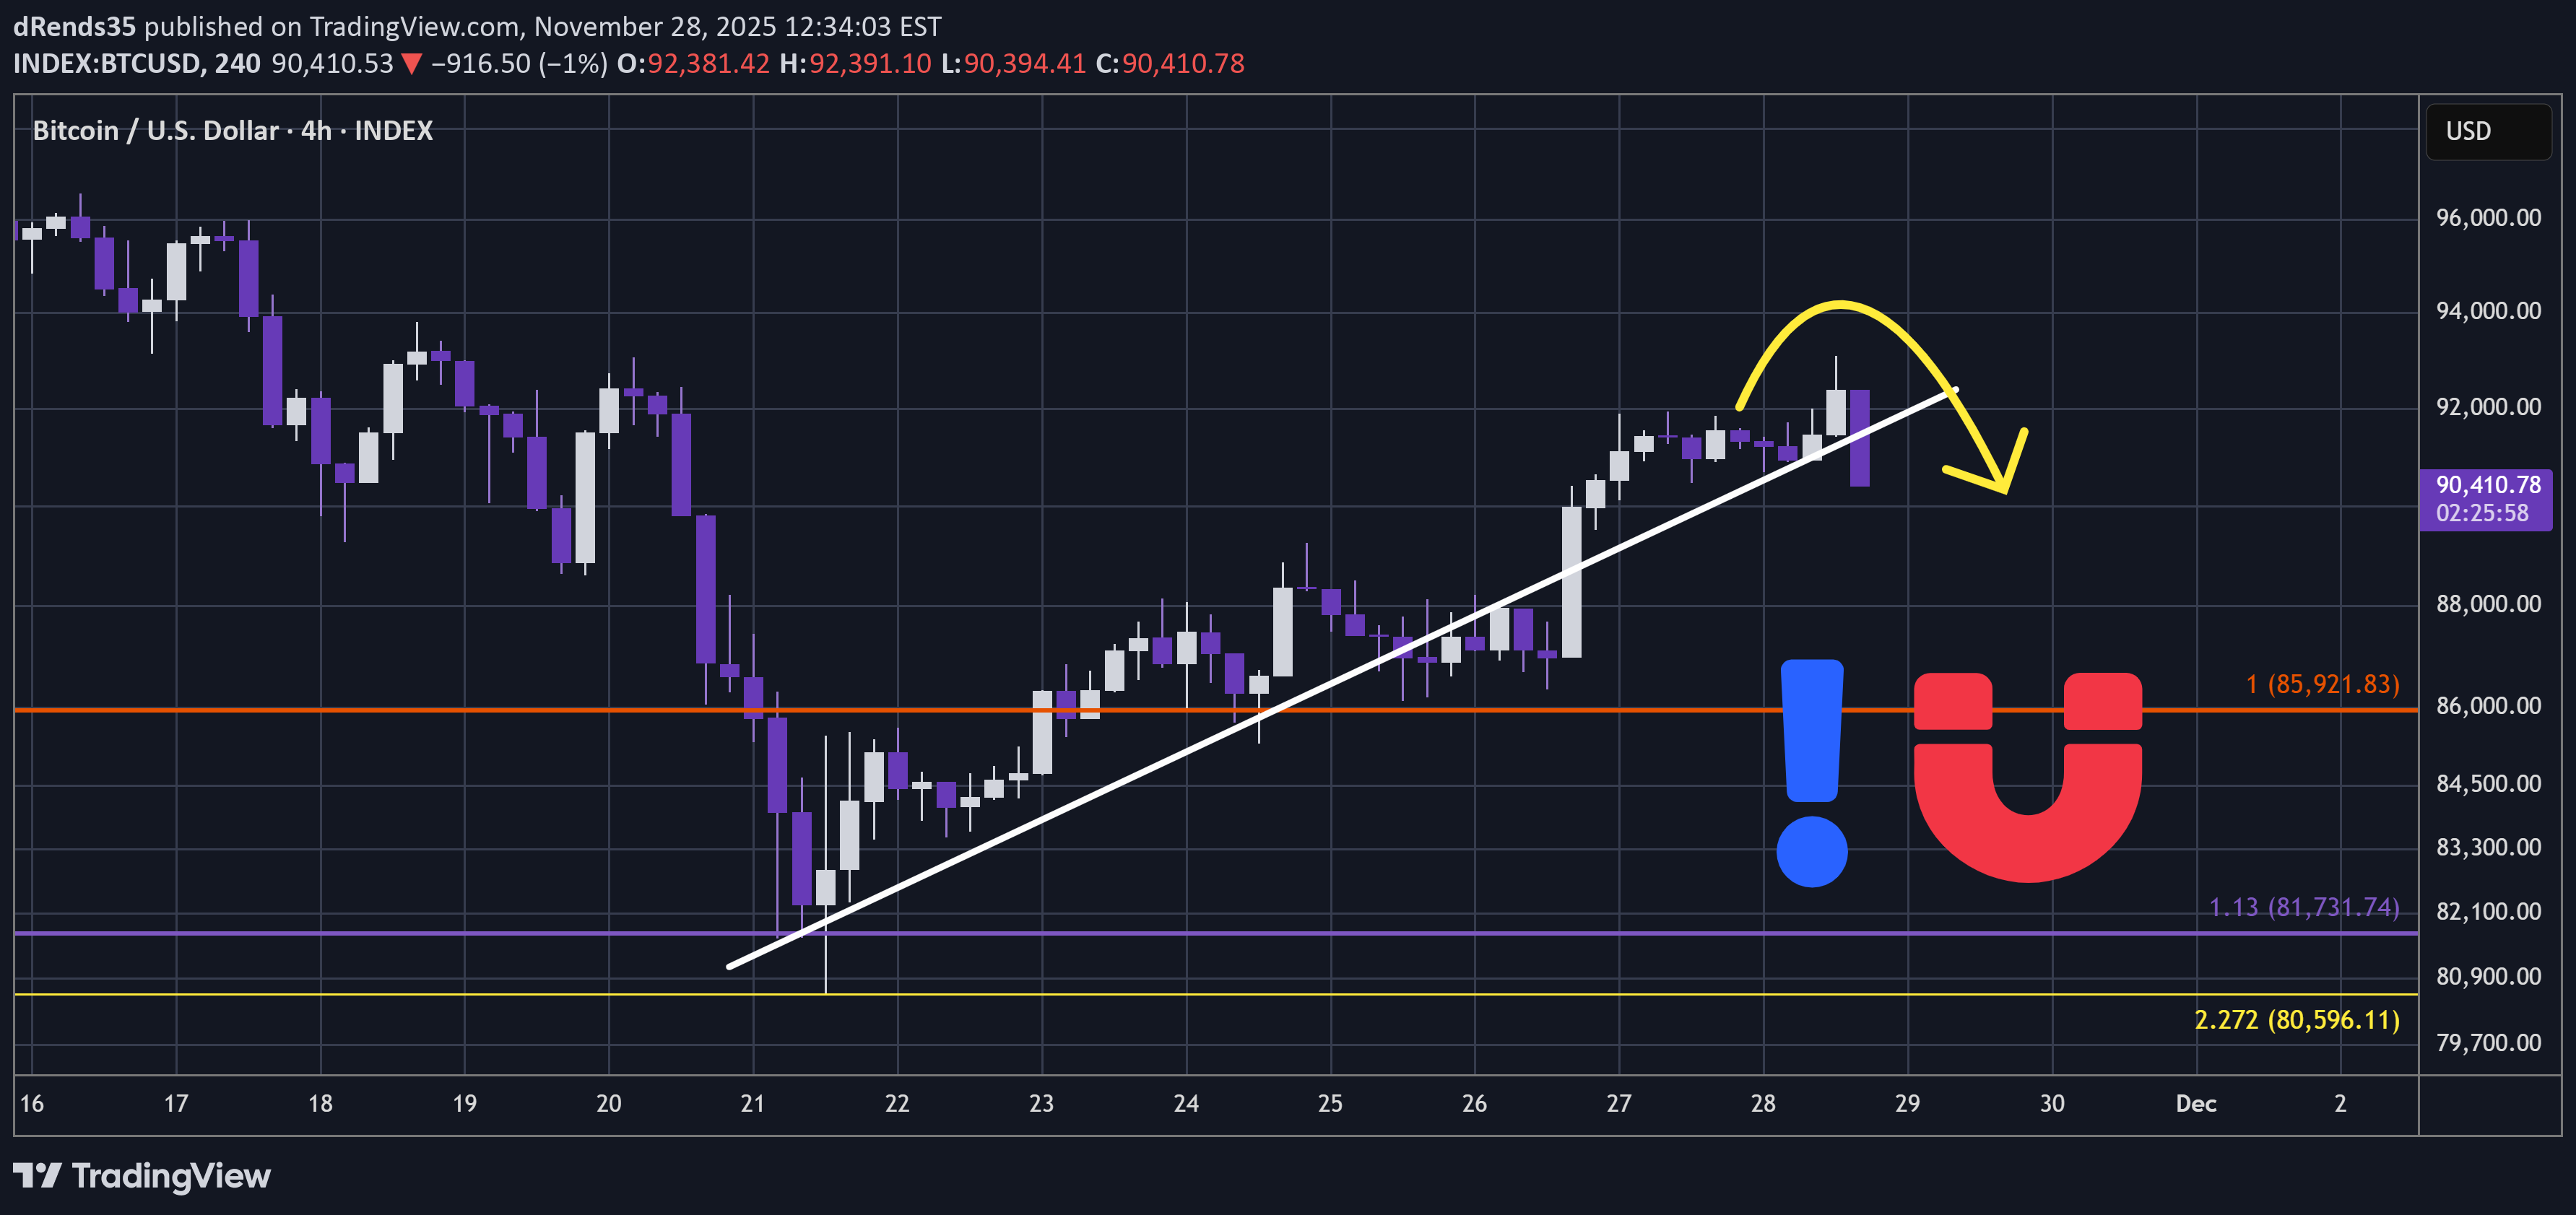
Bitcoin made good nice progress from the 2.772 @ $80K and I do think a HTF bullish pivot is likely to have arrived, but now it has printed an upside whipsaw - it is signalling a potential LTF correction beginning. If you've been keeping up with my other threads then you'll know there have been signals throughout the market that this was in the pipeline before Bitcoin slumped. As such I of course took evasive action before this slump and am waiting to buy dips. If you like my content and perhaps missed my other threads that I'll link below, then do hit the BOOST to let the algorithm know you'd like to receive more content 👍. This analysis is shared for educational purposes only and does not constitute financial advice. Please conduct your own research before making any trading decisions.
dRends35
SHIB - Shooting Stars That Signal Market Corrections
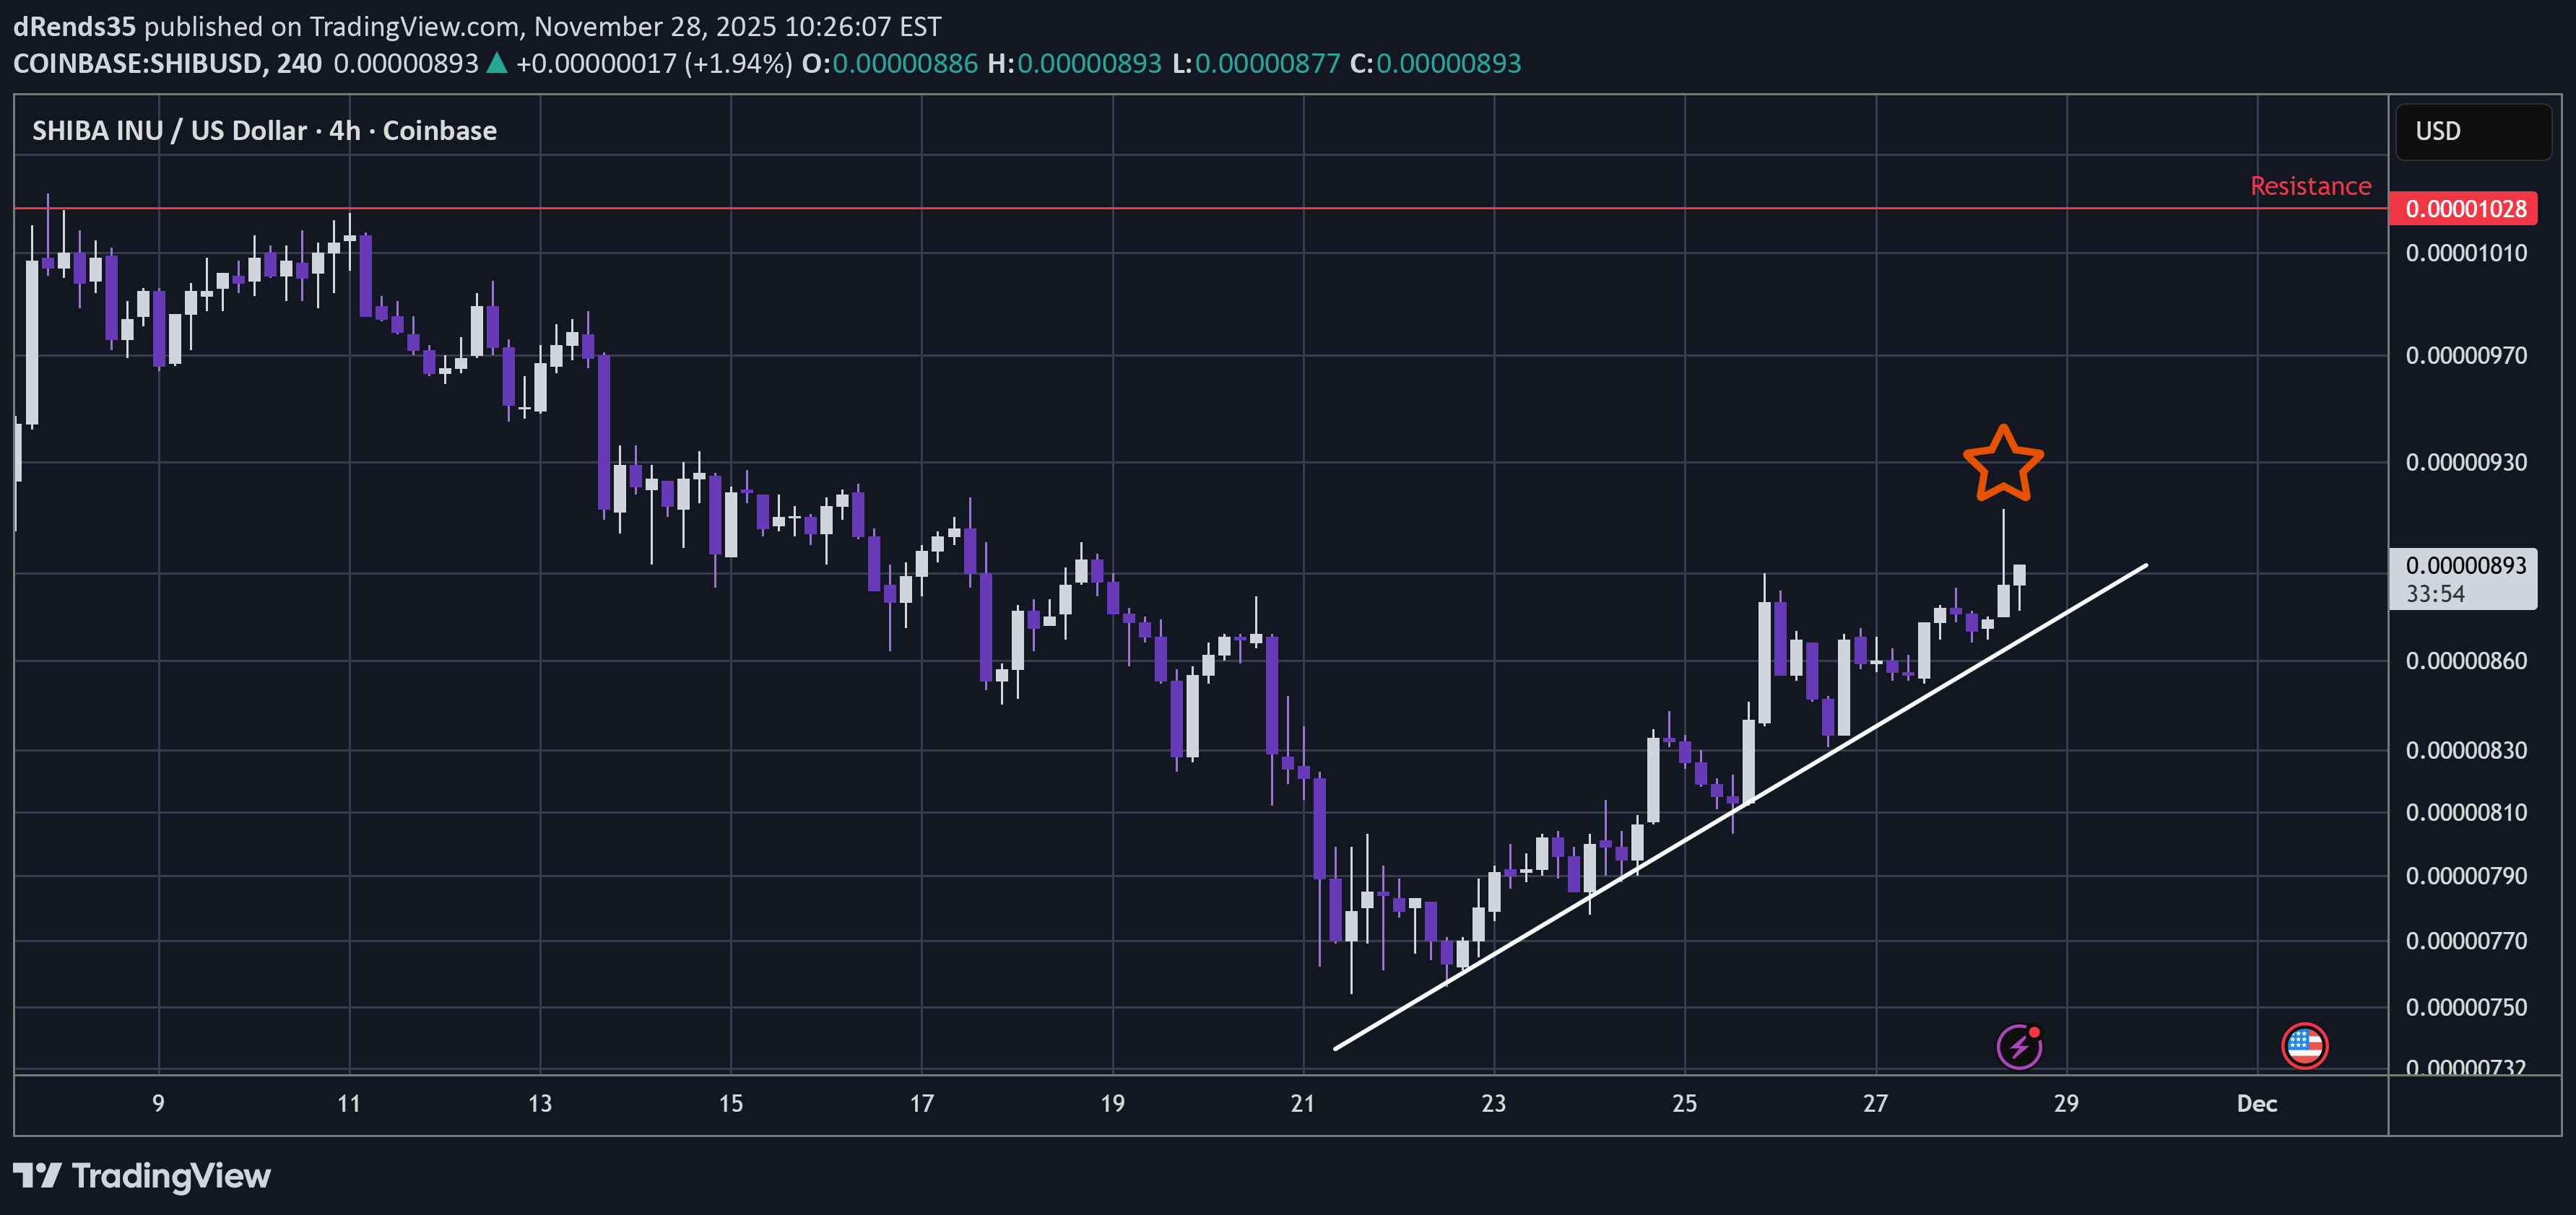
SHIB Before every correction, there always seems to be at least one or sometimes quite a few coin charts that print a whipsawing candle. And here SHIB has printed a whipsawing Shooting Star - signalling it has reached a key resistance point. In the short term anything can happen, but that star has fairly high odds to be signalling downside in the pipeline at some point. Also it is a somewhat choppy ascending line - which could be building cause for downside action. This is also in tandem with stock indexes potentially reaching bearish inflection point ~ see linked threads 🧐. This analysis is shared for educational purposes only and does not constitute financial advice. Please conduct your own research before making any trading decisions.I'm noticing on TradingView that I receive more content from publishers that I BOOST / comment on and the algorithm seems to reduce my receiving content from publishers that I have not engaged with their threads. So hit the BOOST / comment if you want to receive more of my content, and obviously that also assists me in reaching more viewers 👍.
dRends35
ILV - Dip Buy In High Risk "Snowflake"
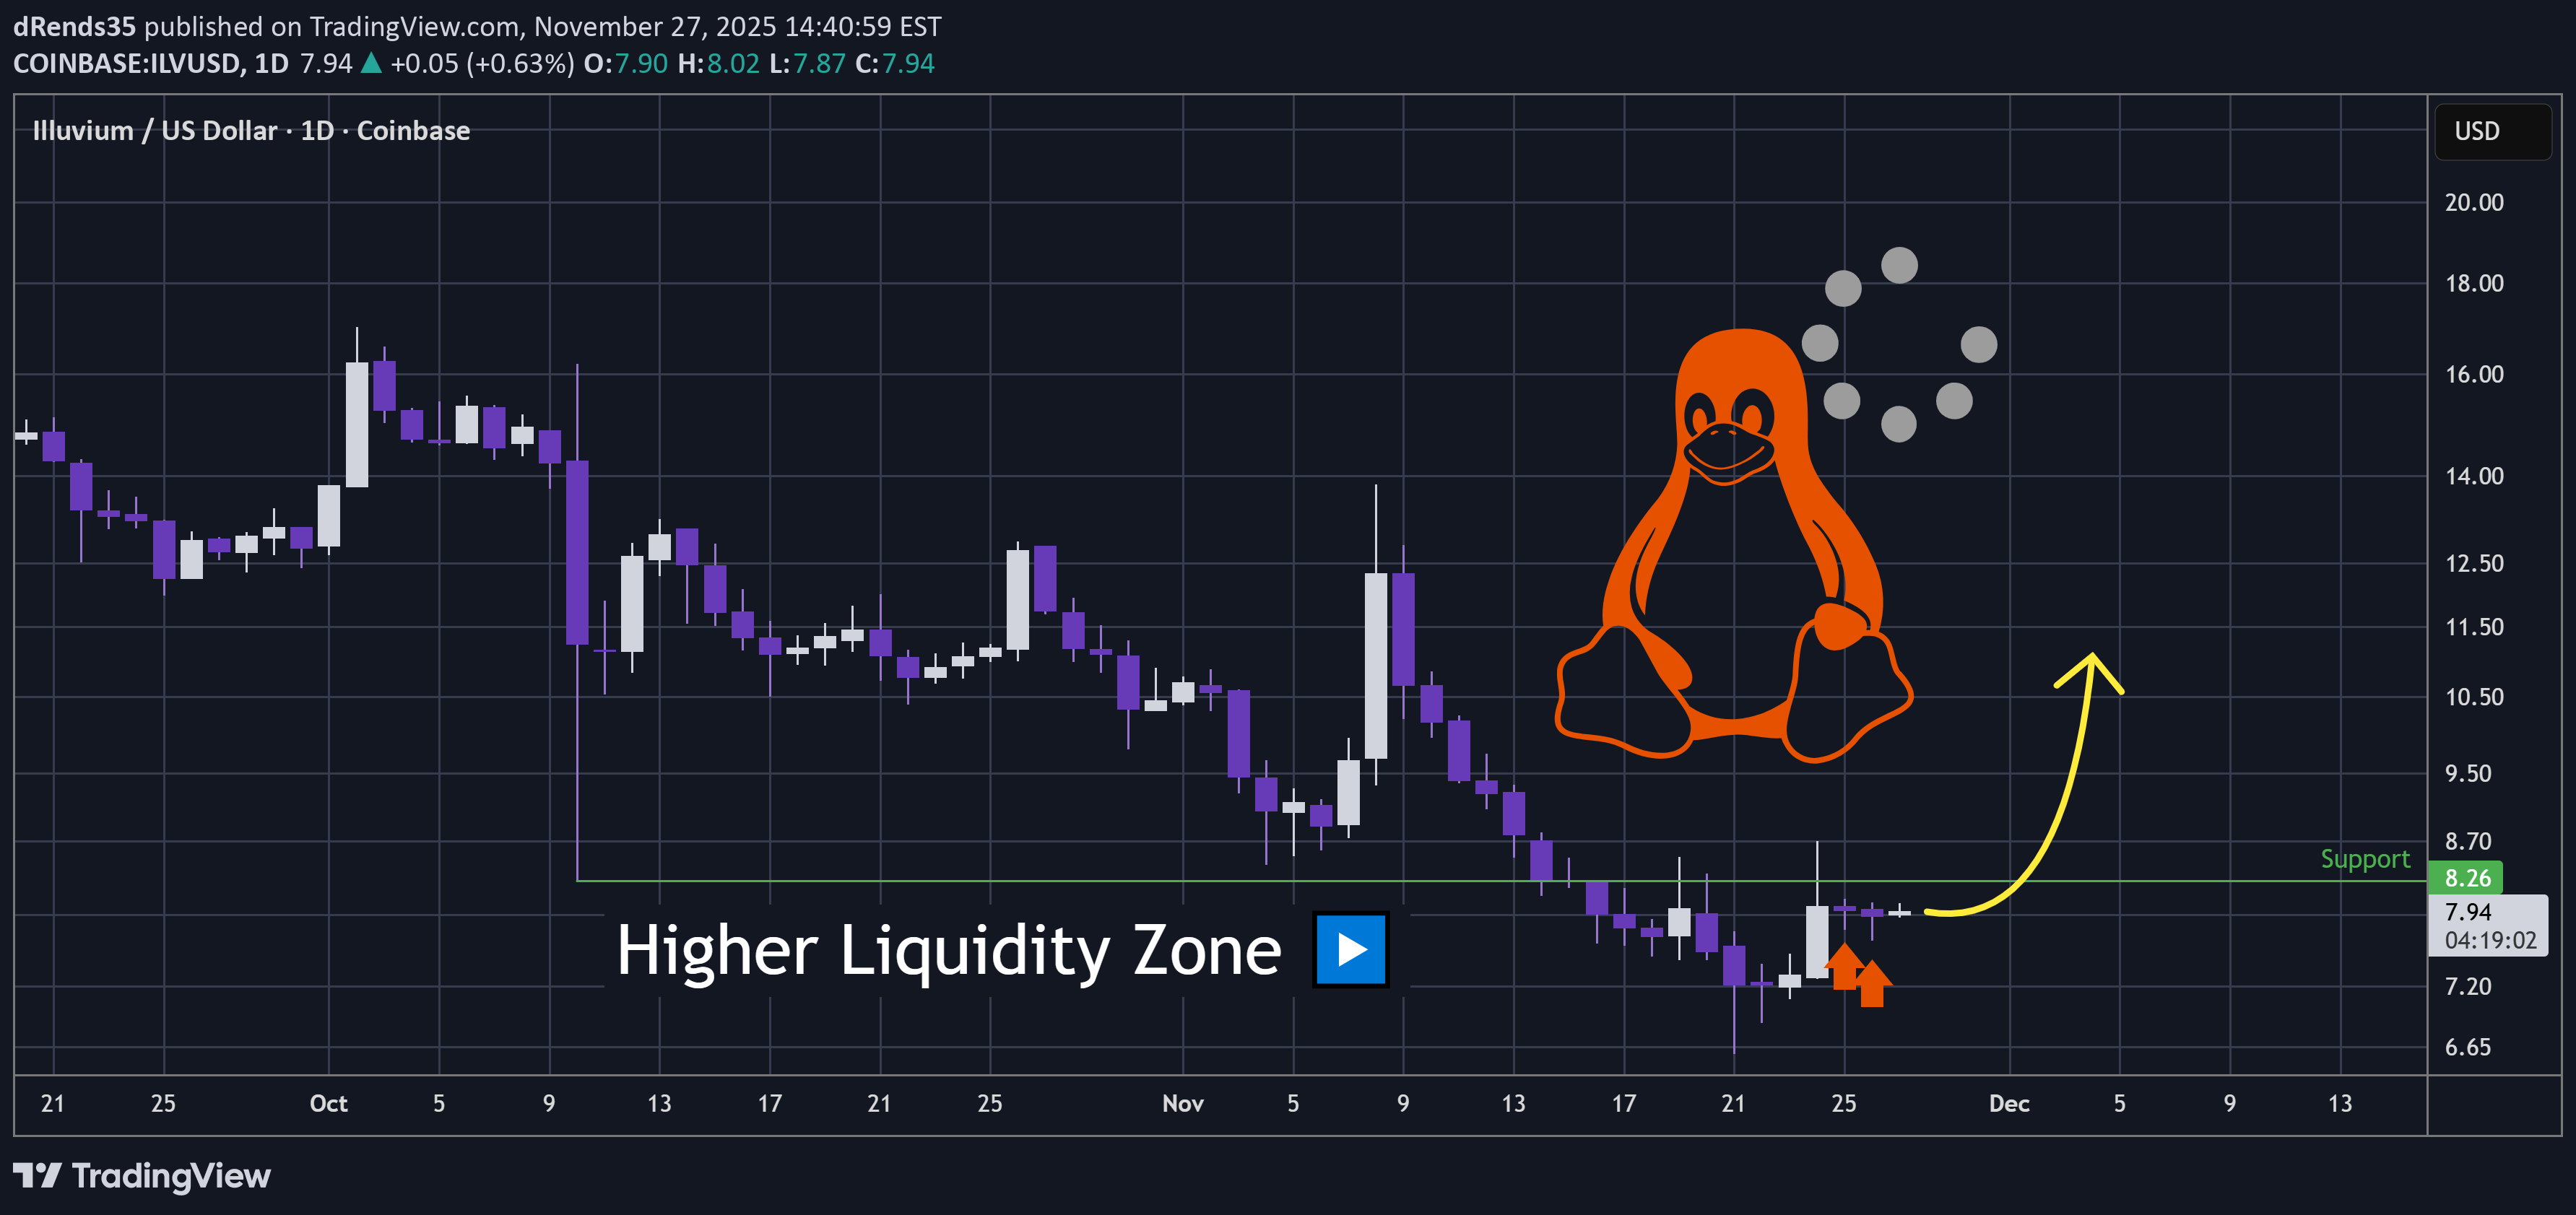
#432 In contrast to Litecoin, Illuvium appears to have more bullish potential here. This is an interesting change up because for most of the time Illuvium has a more bearish skew. Notice how there are supportive lower wicks after the pop (arrows) And its now sitting just below support - in the higher liquidity zone and drifting sideways. ILV is very much a snowflake in that it can print positive corrective action to then melt to the downside... But when it pops it has thunderous upside. So, that is the trade off with this coin. Might just pop here 🤨. This analysis is shared for educational purposes only and does not constitute financial advice. Please conduct your own research before making any trading decisions.I'm noticing on TradingView that I receive more content from publishers that I BOOST / comment on and the algorithm seems to reduce my receiving content from publishers that I have not engaged with their threads. So hit the BOOST / comment if you want to receive more of my content, and obviously that also assists me in reaching more viewers 👍.Was drifting nicely but has now begun to melt away as crypto enters a correction. Could yet hold but this coin is a burner to hold without a technical moment - I'll wait for a better moment 🧐.
dRends35
XRP - Could Be An Explosive Move Coming From Oversold
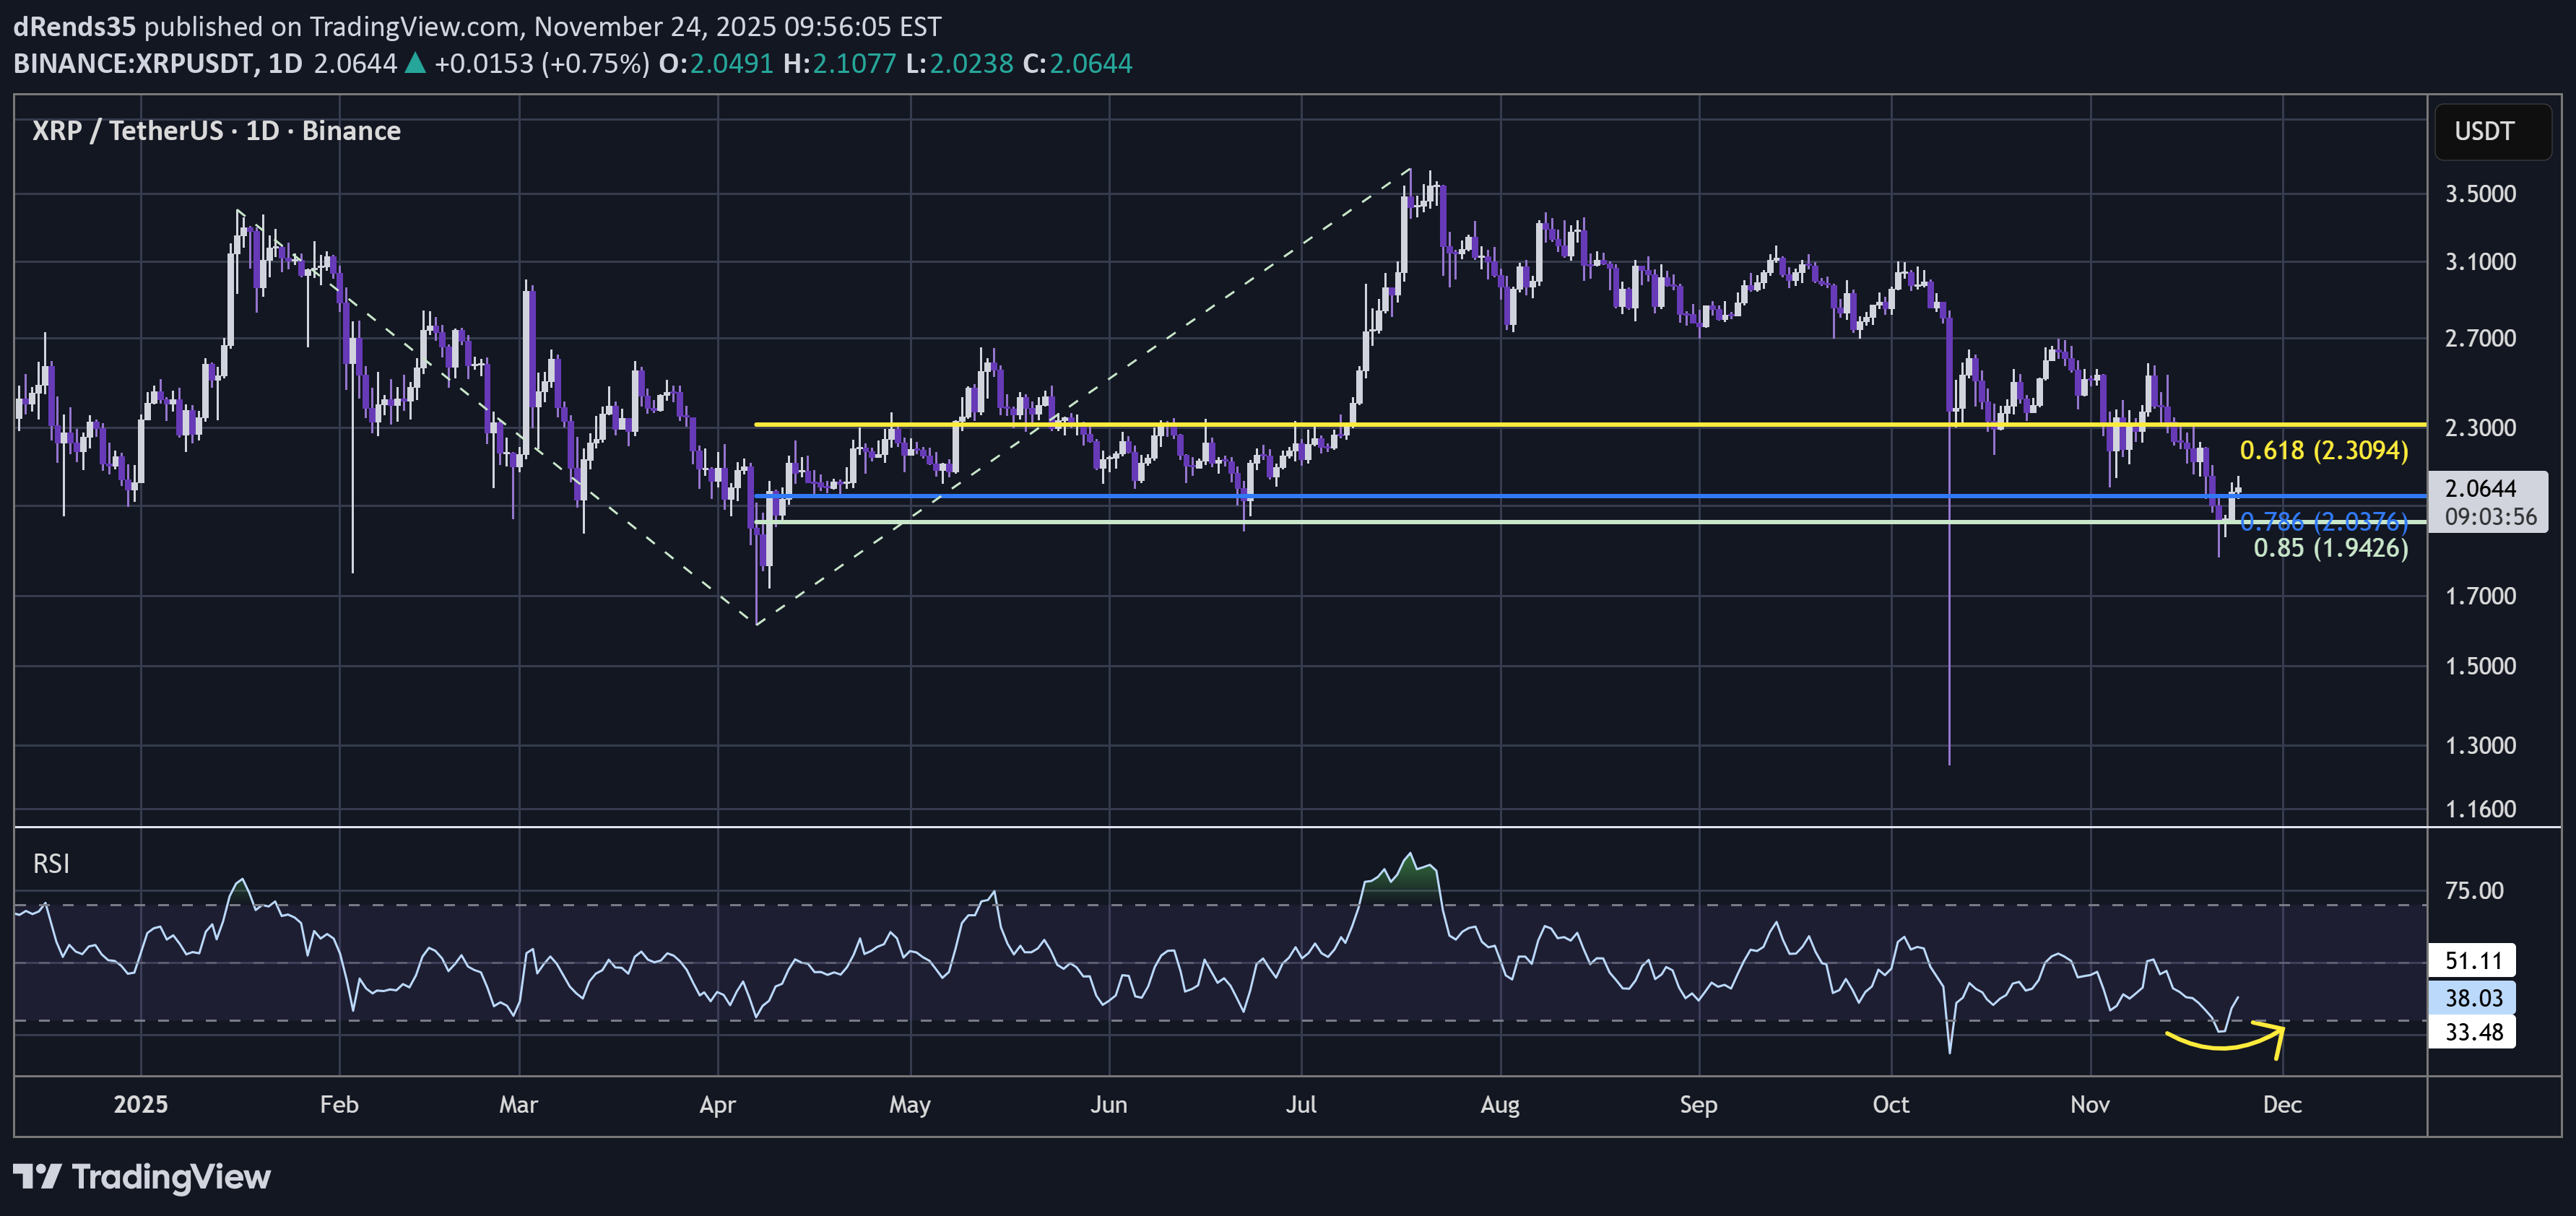
XRP Crypto1 In all of this time since early 2025 peak XRP hasn't really gone anywhere and although the range has been very broad it has effectively been drifting sideways. Sideways drifts tend to be re-accumulative. Notice that XRP day RSI is oversold for the second time in this area. It did also stab down to record oversold, but this is the first time that price has trended into oversold in all of this long correction. Current price is drifting in the 1:0.618 Golden Window. In the recent slump, it did slightly exceed the overshoot bands and so if it dropped to a similar level again that it may signal a move to a lower fib band. But this is a HTF fib band and so it can get stretched and still give us a signal. Now, if it does hold then the 1:0.618 GW is a weak ratio because the third wave is shorter than the first. And so this might be a signal that there is significant bullish momentum building for a next wave up. When XRP gets impulsive it really flies 🤨. This analysis is shared for educational purposes only and does not constitute financial advice. Please conduct your own research before making any trading decisions.
dRends35
SOL - Advanced Dip Buy Analysis
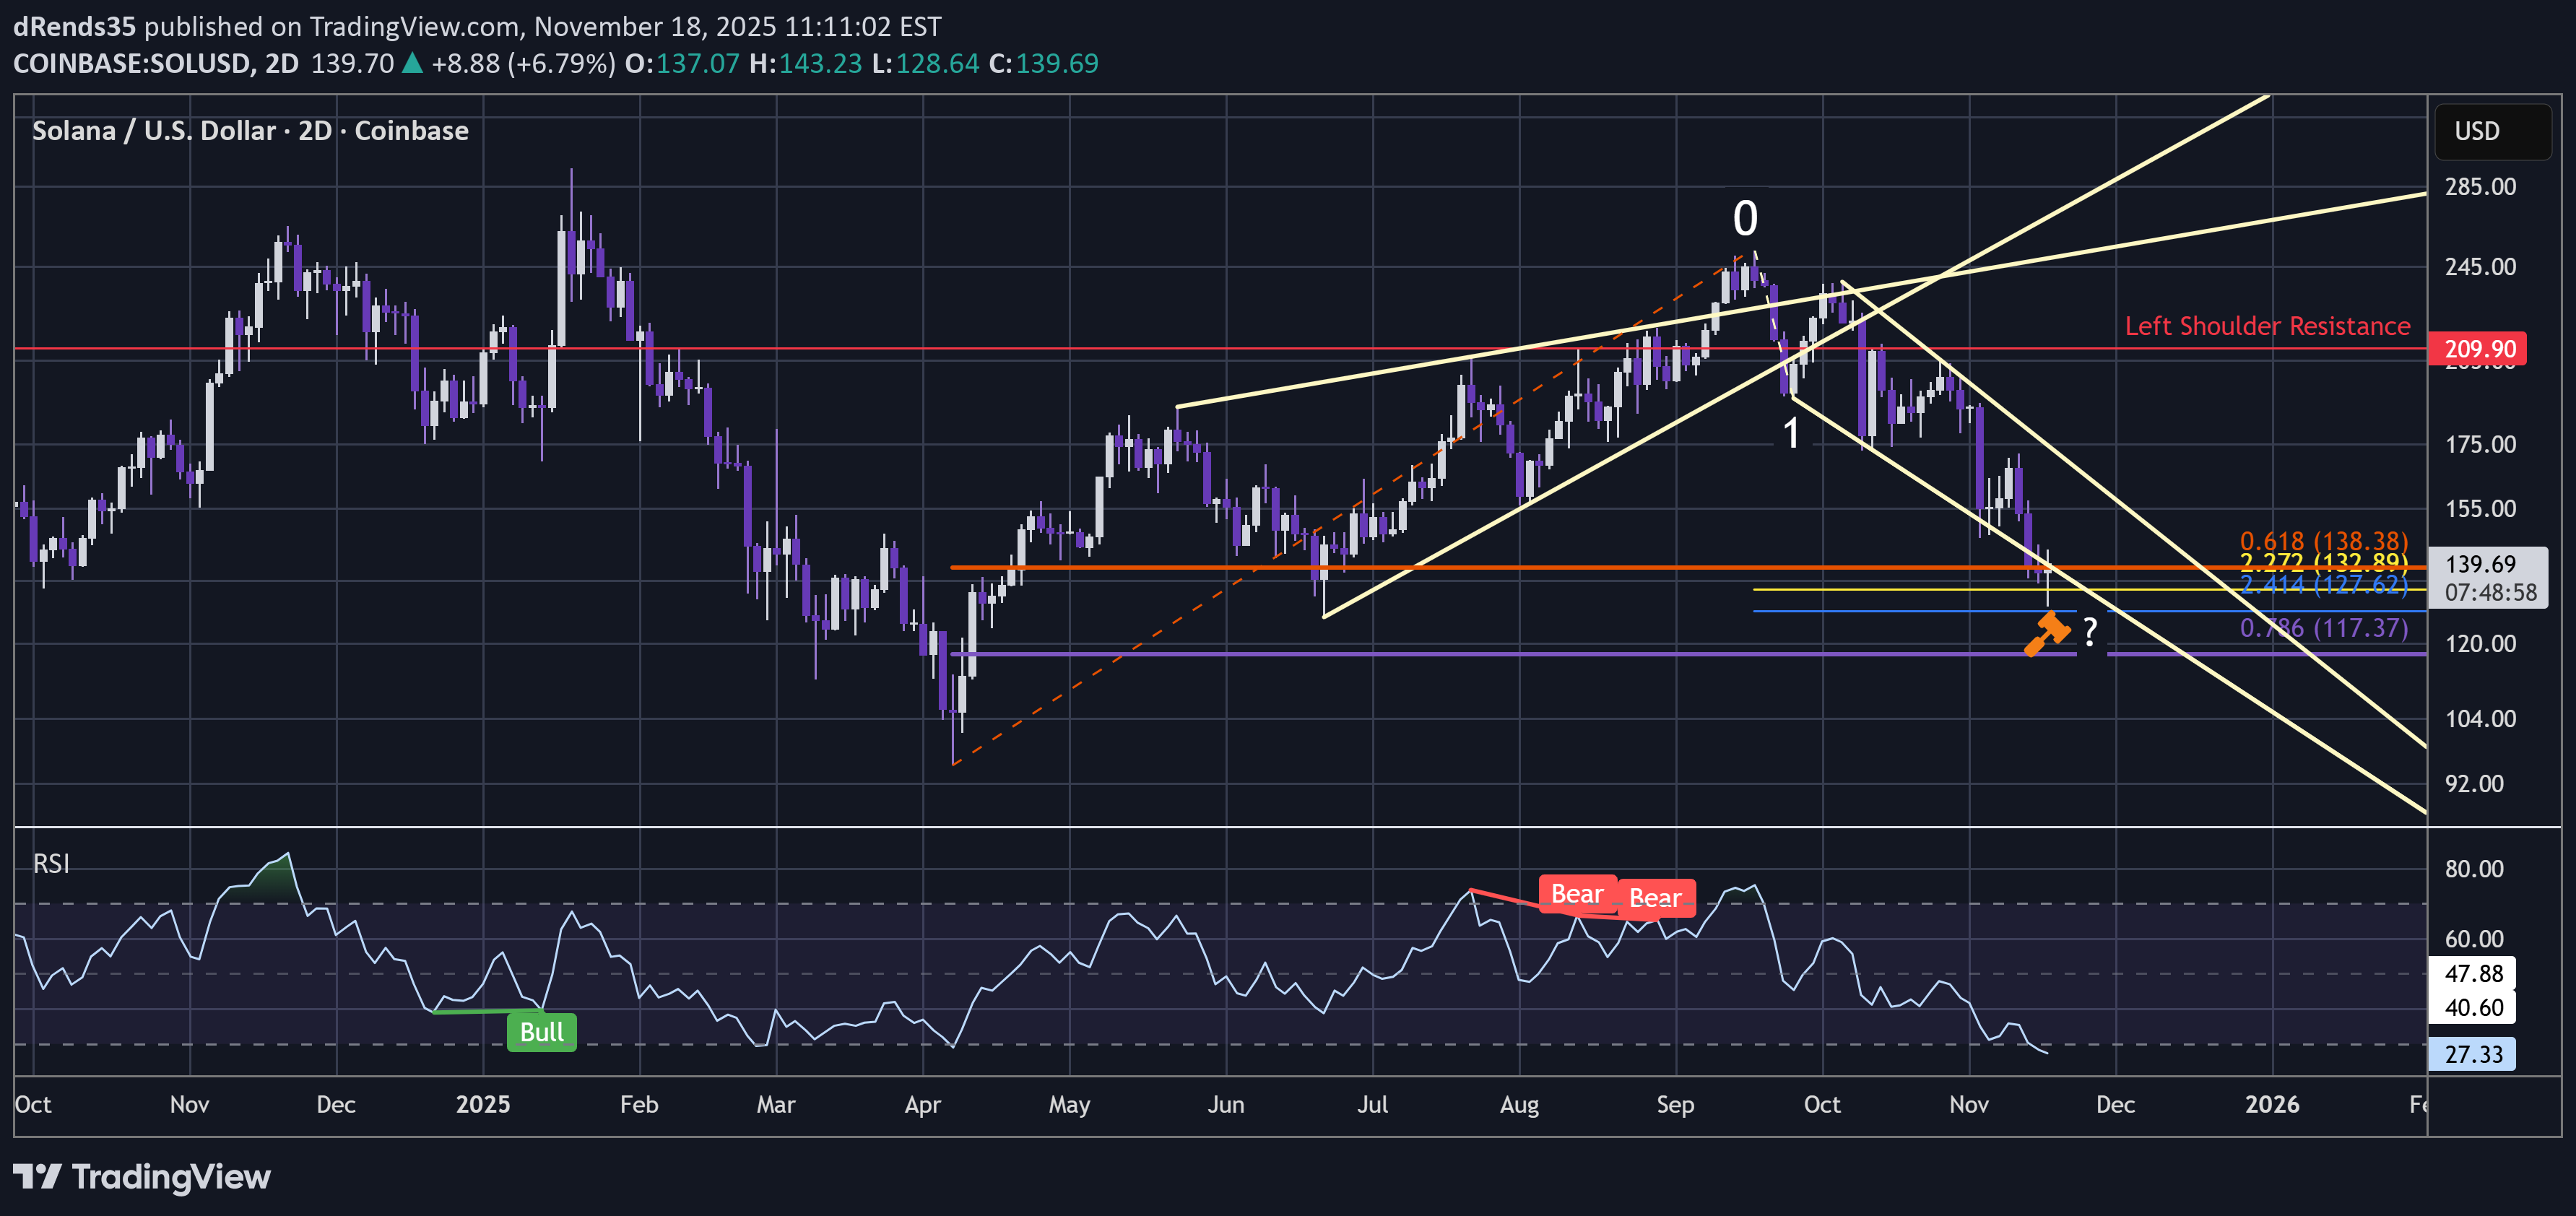
Bears everywhere but the question is - can they really read a chart 🤨? Anyhow - various altcoins now printing positive candles from positions of ratio balance. Notice that SOL is hitting a "Harmony Confluence Zone" (as I call it = multiple confluences within a small price band) here bouncing within a double Golden Window: The bullish hammer candle has quickly whipsawed to reach the 2.272 extension Golden Window (one of my favourites) - taking the 0 and 1 pivots of the downtrend. And that is within a higher time frame retracement Golden Window (0.618 - 0.786) taking the low to the high of the April uptrend as pivots. The RSI is oversold - down at 27. It is the first time it has been oversold since the June 2023 lows. And that was in accumulation before the bull market: In addition it has slumped to fall through a descending wedge. Its quite steep but descending wedges tend to be a bullish clue and this trending below the trendline may prove to be a liquidity shakeout below the wedge which may later recover to the upside. All of these combined events signal that there is plenty of bullish confluence and this may be prime dip buy territory right here. For price action confirmation - the day candle should close bullish - so a doji wouldn't really be enough, a hammer would be better - let's see 🧐. This analysis is shared for educational purposes only and does not constitute financial advice. Please conduct your own research before making any trading decisions.
dRends35
BITCOIN - Is This The Bottom ?
Printing a lower wick - and this might just be the bottom or very nearly the bottom here as there was another ratio to find. Notice that the wick has printed tidily within this 1.618 GW extension. Also MSTR appears to be a leading indicator that the market may be about to turn ~ see linked thread Also it is now oversold RSI on the day chart. That might just be it and this may well be prime dip buy for altcoins / MSTR - let's see how it develops 🧐. This analysis is shared for educational purposes only and does not constitute financial advice. Please conduct your own research before making any trading decisions.GW = Golden Window*Check my SOL thread - plenty of work. This is an area where you may really see who can read a chart and who can’t:Bears everywhere - bearish publishers, bearish sentiment. This is deep bear territory and for contrarians that signals a buy. Obviously you have to do the work as well. But both are aligning here.Bitcoin slumped to make a slightly lower low but the fast recovery is a liquidity sweep and that is a bullish signal. Bears everywhere - it is deafening. To say anything bullish here is now an embarrassment. Of course it is in this type of sentiment that major pivots print. I bought more of my favourite crypto coins and MSTR here 👍.Stock indexes have slumped today and Bitcoin has moved beyond the Golden Window which is my invalidation. I'll be looking for the next ratio area to buy in and for now - I'm out.
Disclaimer
Any content and materials included in Finbeet's website and official communication channels are a compilation of personal opinions and analyses and are not binding. They do not constitute any recommendation for buying, selling, entering or exiting the stock market and cryptocurrency market. Also, all news and analyses included in the website and channels are merely republished information from official and unofficial domestic and foreign sources, and it is obvious that users of the said content are responsible for following up and ensuring the authenticity and accuracy of the materials. Therefore, while disclaiming responsibility, it is declared that the responsibility for any decision-making, action, and potential profit and loss in the capital market and cryptocurrency market lies with the trader.