
josemanuelmaestrerodriguez
@t_josemanuelmaestrerodriguez

What symbols does the trader recommend buying?
Purchase History
Trader Messages
Filter
Message Type
josemanuelmaestrerodriguez
loot at 14 RSI on the daily
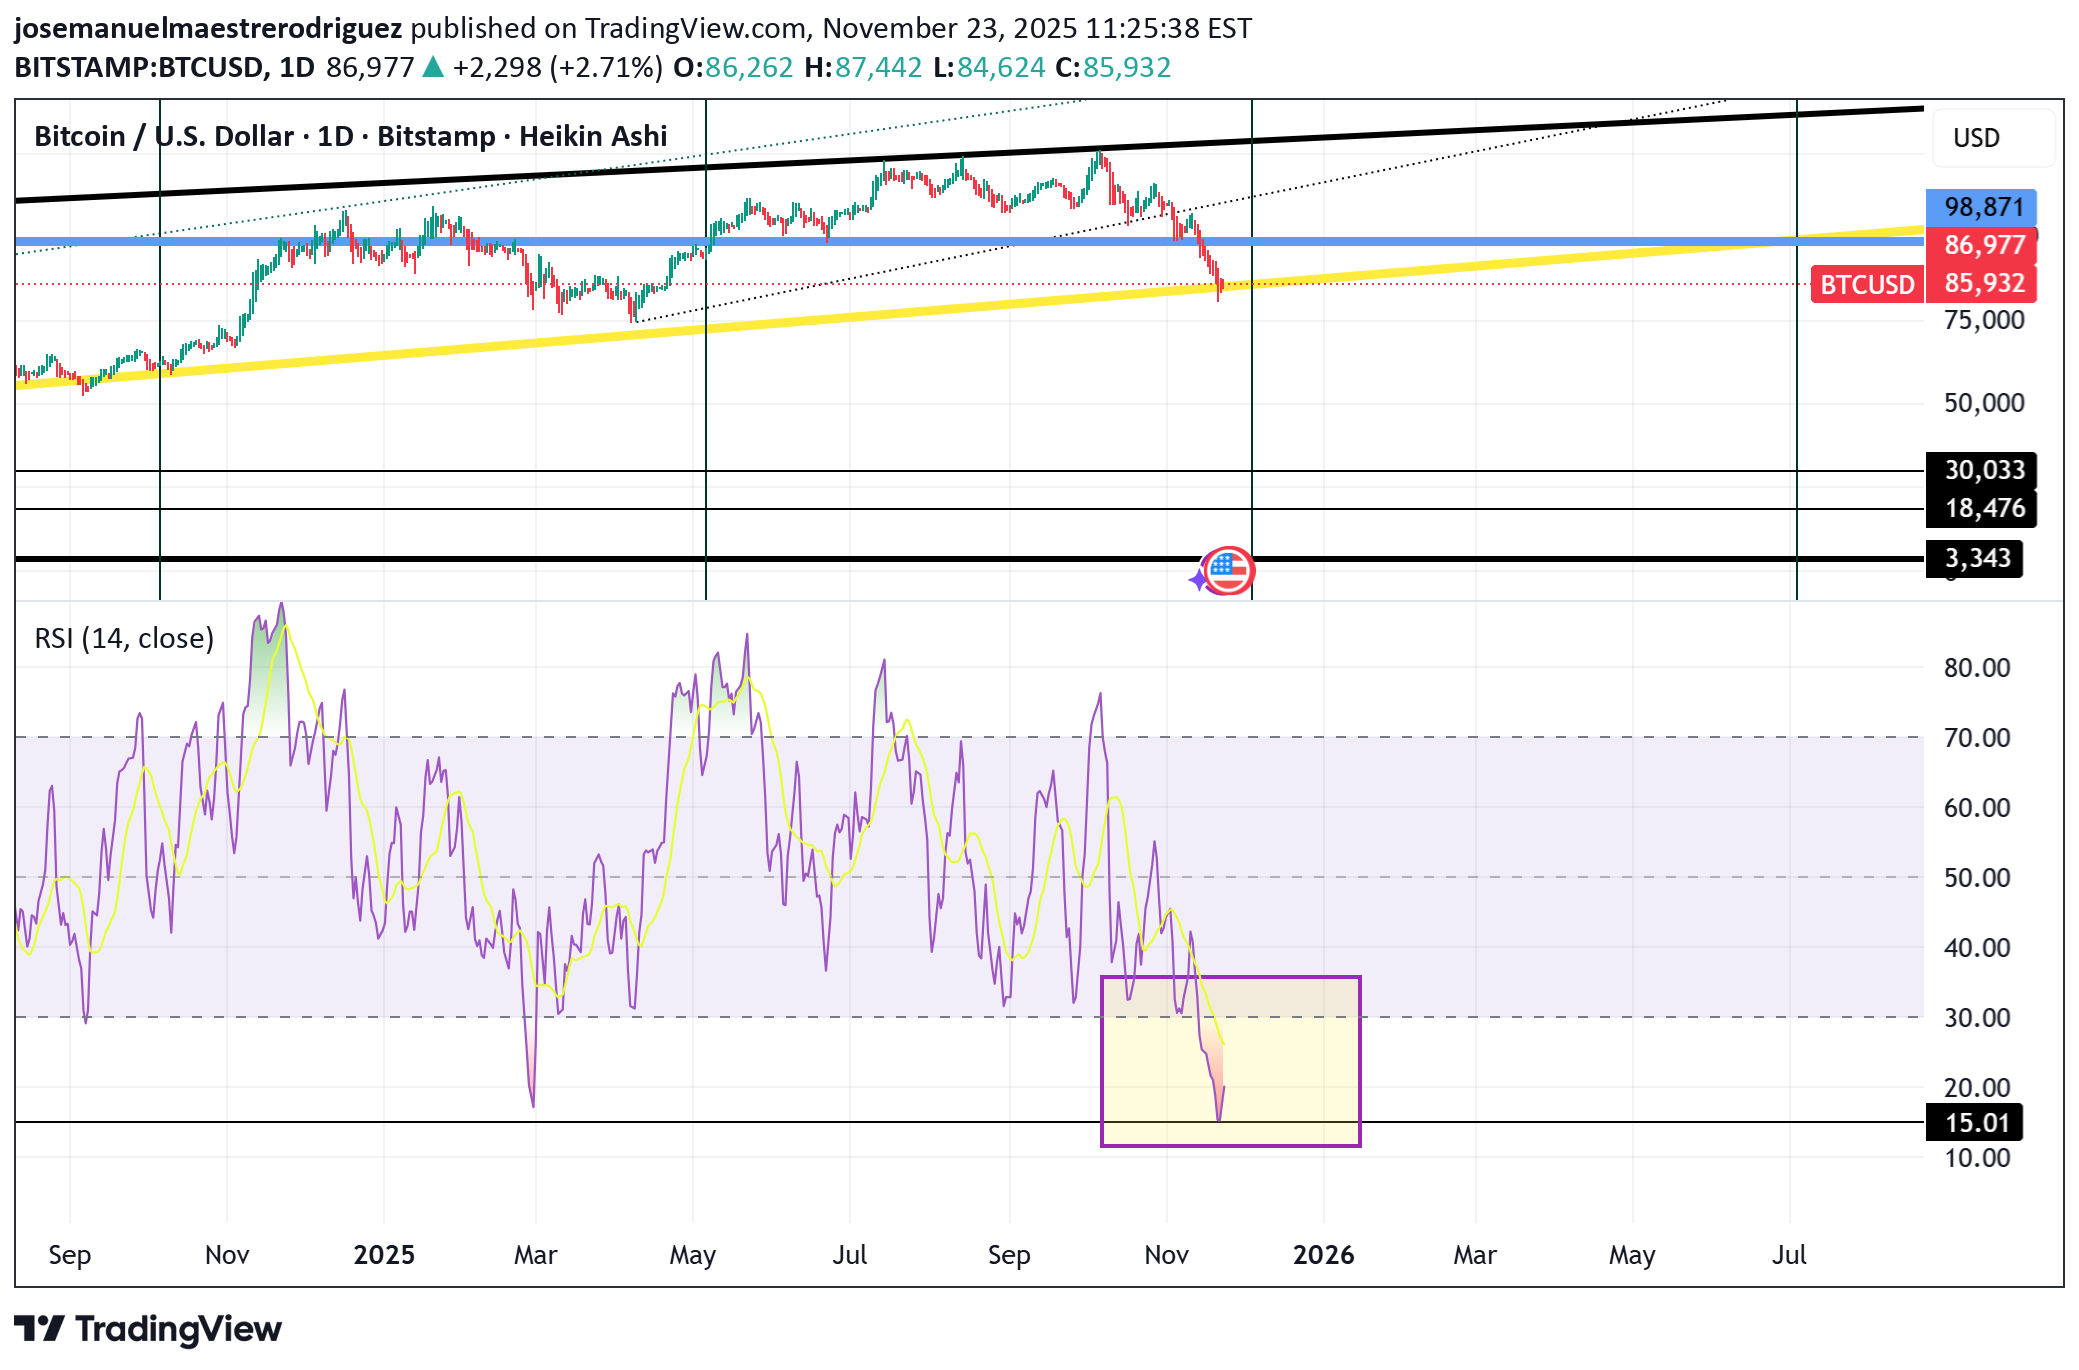
this is one fact and no opinion: BTC RSI on the daily. In her whole life BTC "only" has been 7 times at 15 or below in her daily RSI. Yesterday was her 8th time. ¡7 TIMES! in 16 years. When was she like this? 1. 5th July 2013 (RSI 12.38). 2. 14h January 2015 (RSI 13.41) 3. 27th November 2018 (RSI 6.84 -the lowest ever). 4. 13th March 2020 (RSI 12.38 -Covid19 crash). 5. 12th May 2022 (RSI 14.45 -Wyckoff distribution) 6. 18th June 2022 (RSI 14.10 -FTX collapse) 7. 17th August 2023 (RSI 13.41, inflation levels created by money injected since Covid crash). 8. 22th November 2025 (RSI 15.01) This is one of the reasons because I bought BTC the 21 and the 22nd November 2025 at 84K which I believe is the bottom of the liquidity withdrawan (I have written a post about it).
josemanuelmaestrerodriguez
30% drop because...
I try to put it simple. Very simple. BTC’s 30% drop is because liquidity was drained from the system. The U.S. Treasury, under Secretary Scott Bessent, rebuilt its cash balance at the Federal Reserve from about $300 billion in May to over $940 billion by mid-November. This required massive T-Bill issuance, pulling roughly $450–700 billion out of the banking system. Less liquidity means tighter financial conditions, and risk assets like Bitcoin suffer. This chart shows the Treasury General Account climbing sharply, while BTC fell from its all-time high. Once the money returns to the system BTC continue making a new ATH. BTC Fear index is 11. In a couple of months will be turn into "greed". Chart source: federalreserve.gov/
josemanuelmaestrerodriguez
Down trendline is bullish.
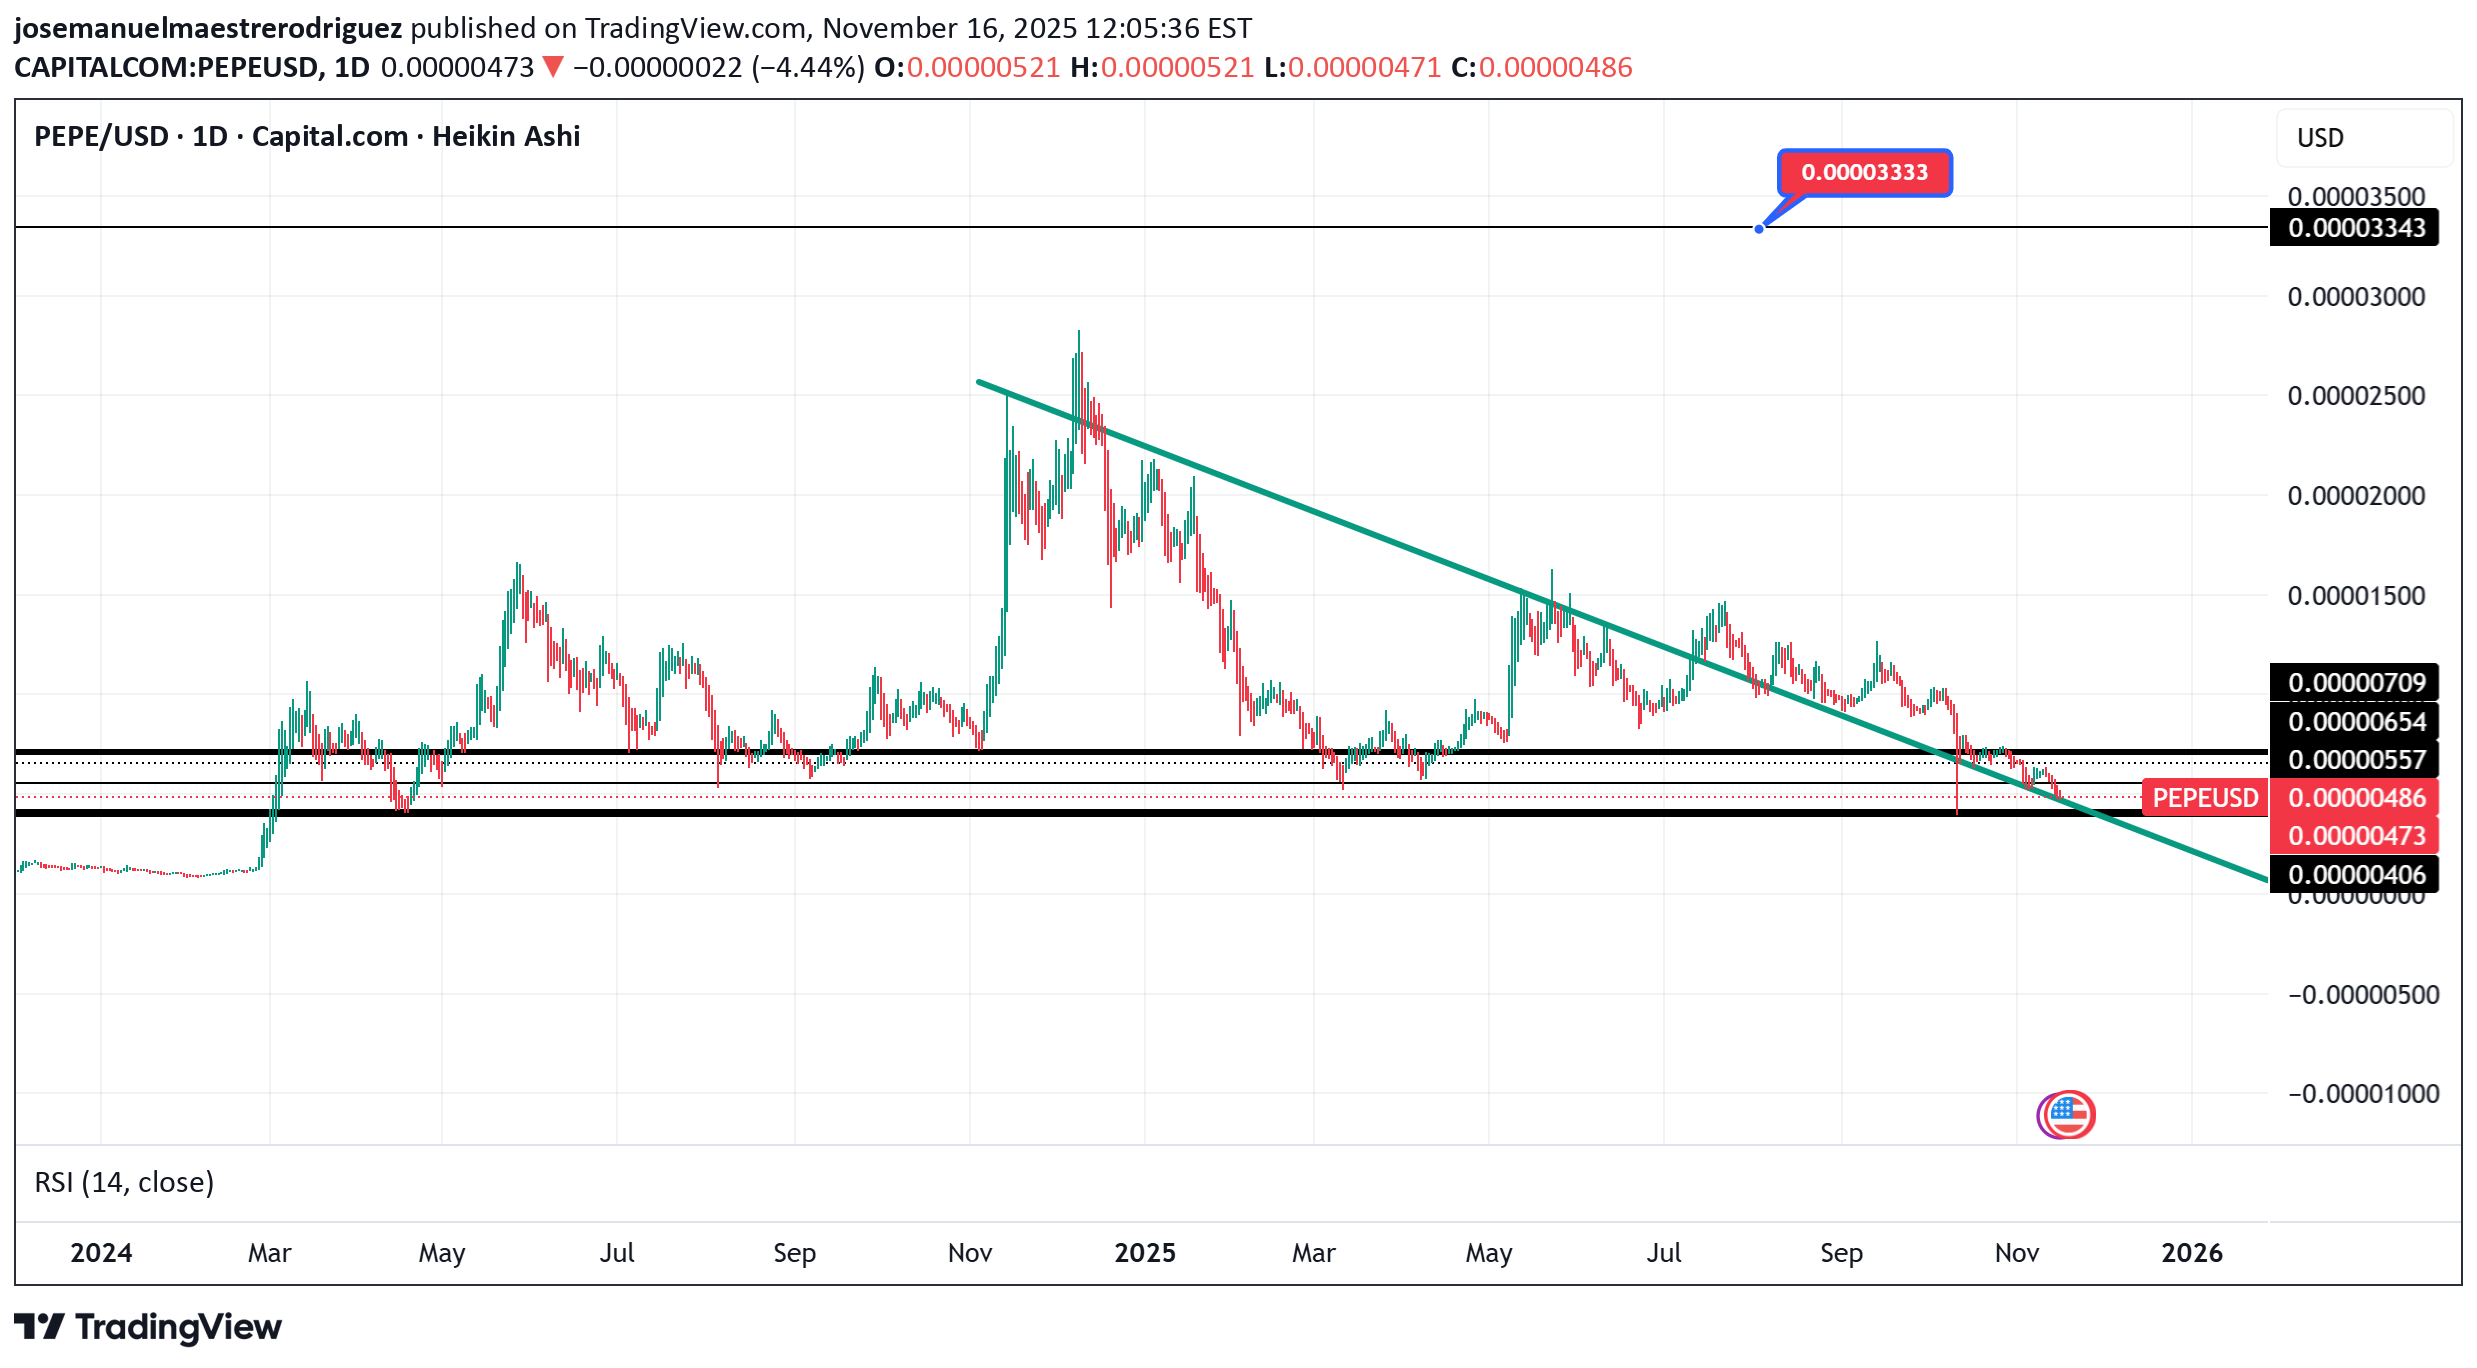
➡️ The structure is more bullish than bearish, ➡️ It’s in a potential end-of-cycle zone, ➡️ And a breakout could trigger a strong move. The key point: the trendline break and a close above 0.00000055–0.00000065.
josemanuelmaestrerodriguez
BTC is only moving sideways
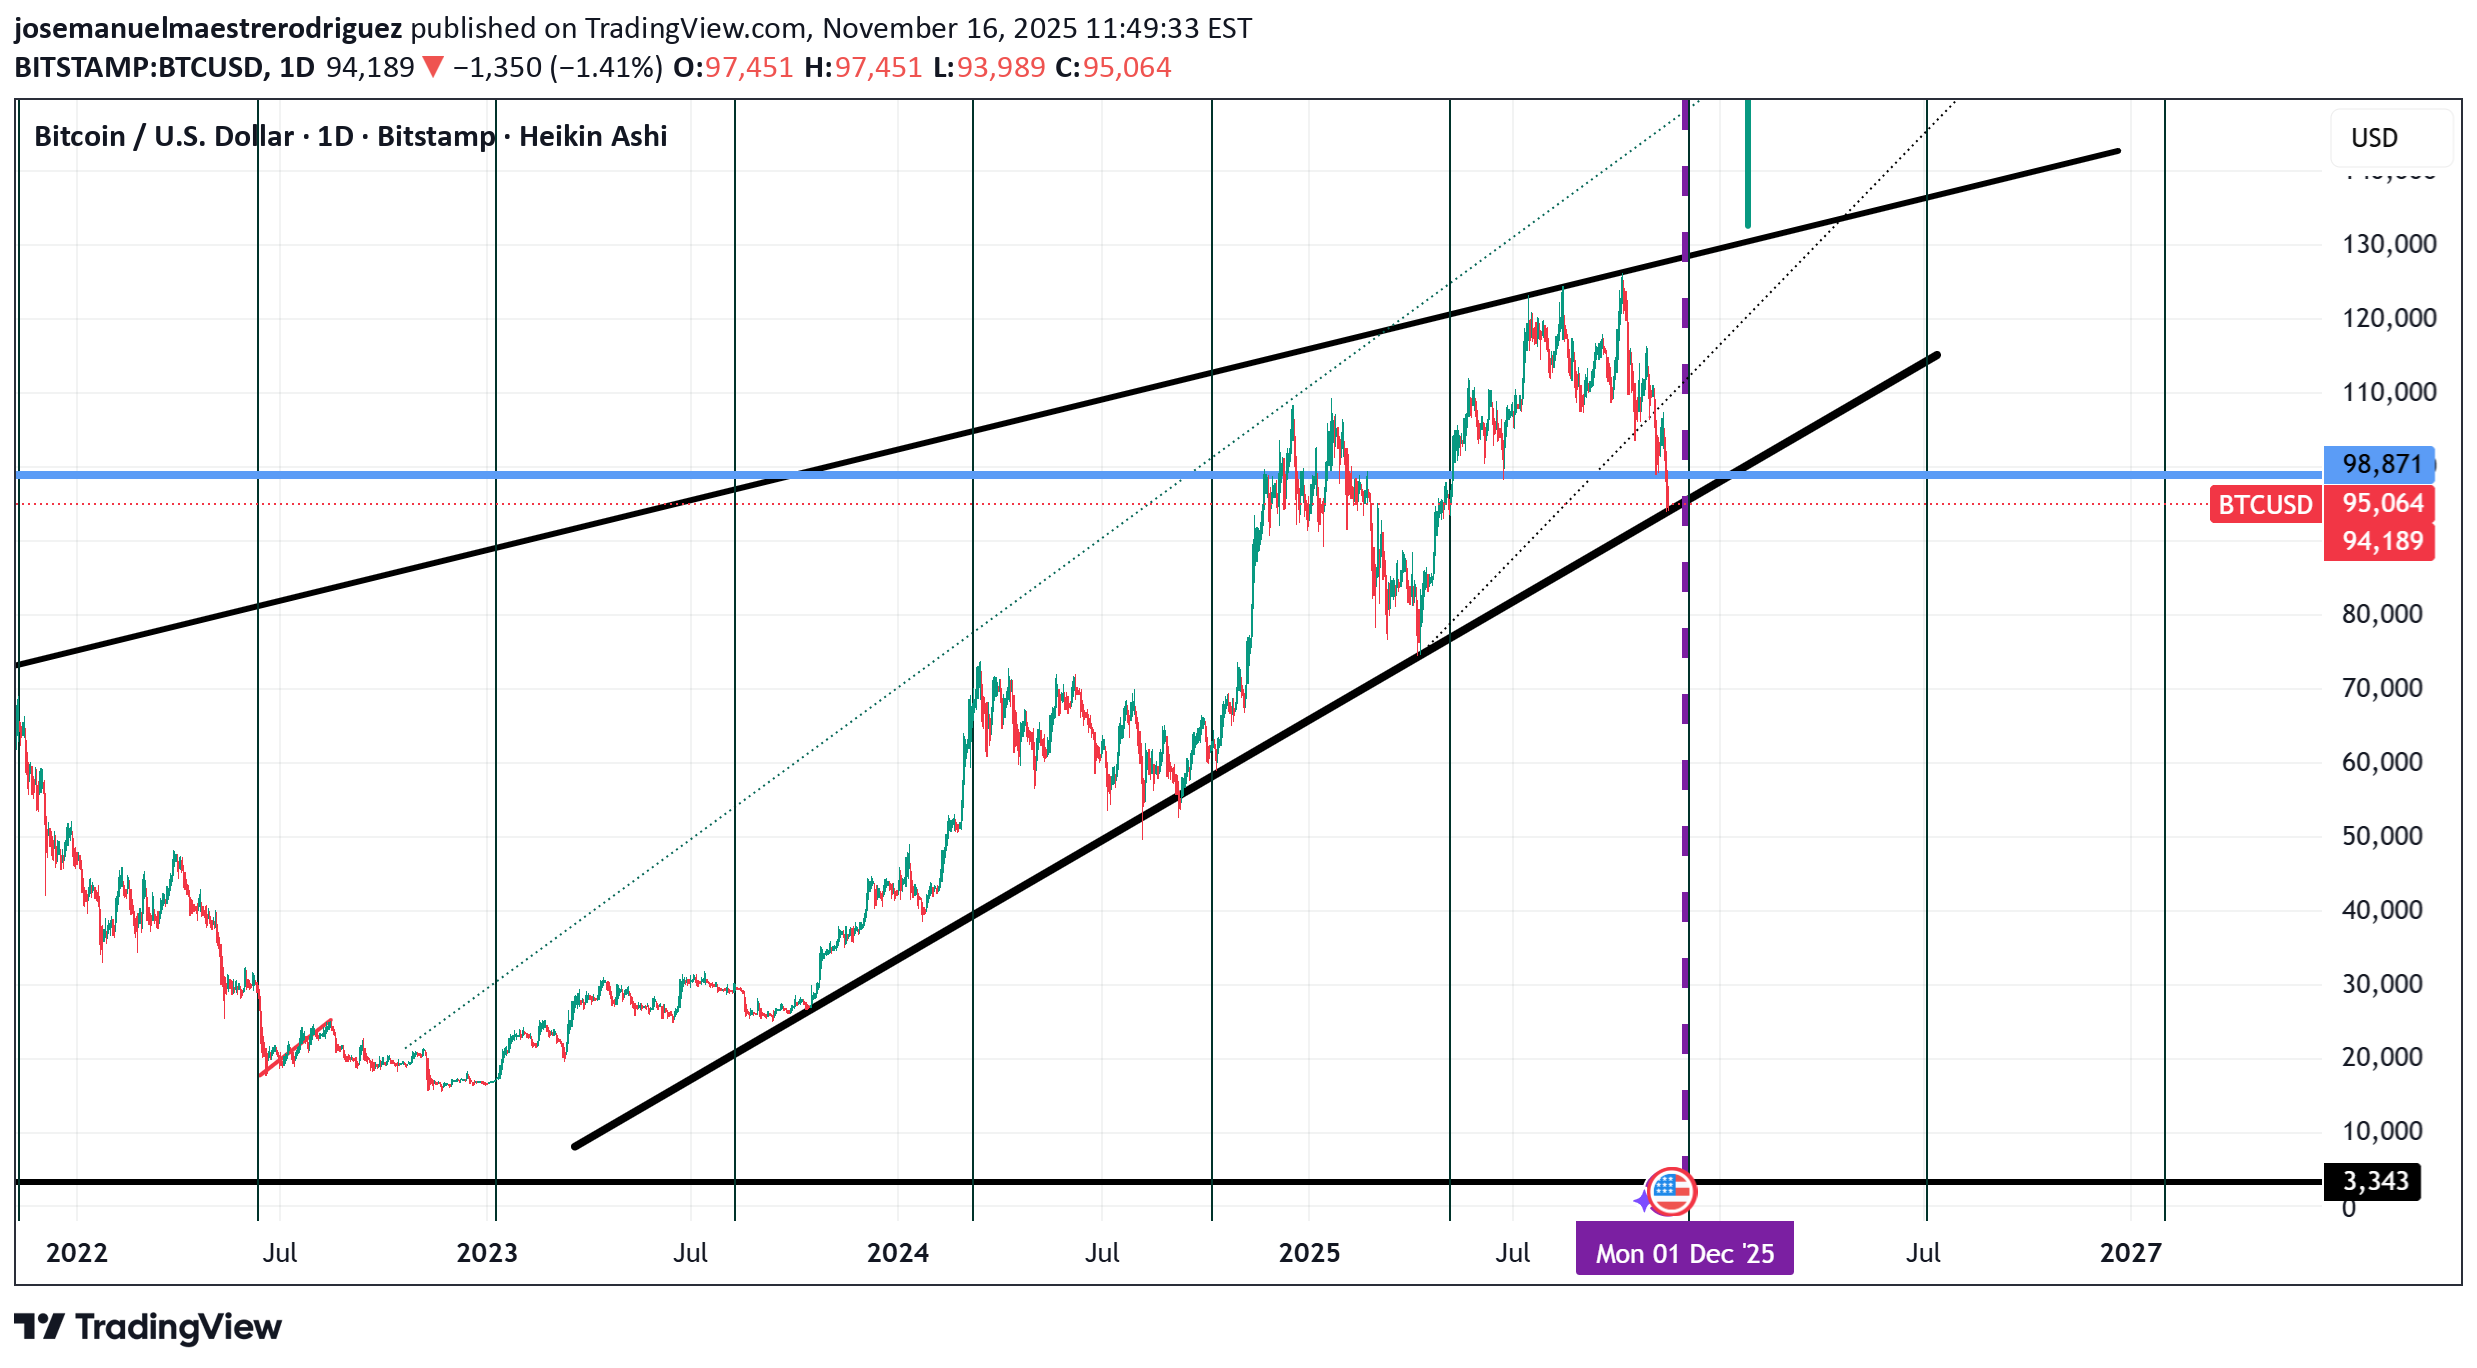
It looks like BTC is collapsing. Well, for me as you can see on the chart is only moving sideways. It has gone from the top of the channel to the bottom of the rising channel. Confirmation that the uptrend is 98K. Right now BTC is in the real moment to confirm this.
josemanuelmaestrerodriguez
200000$ is the target. BTC is bullish.
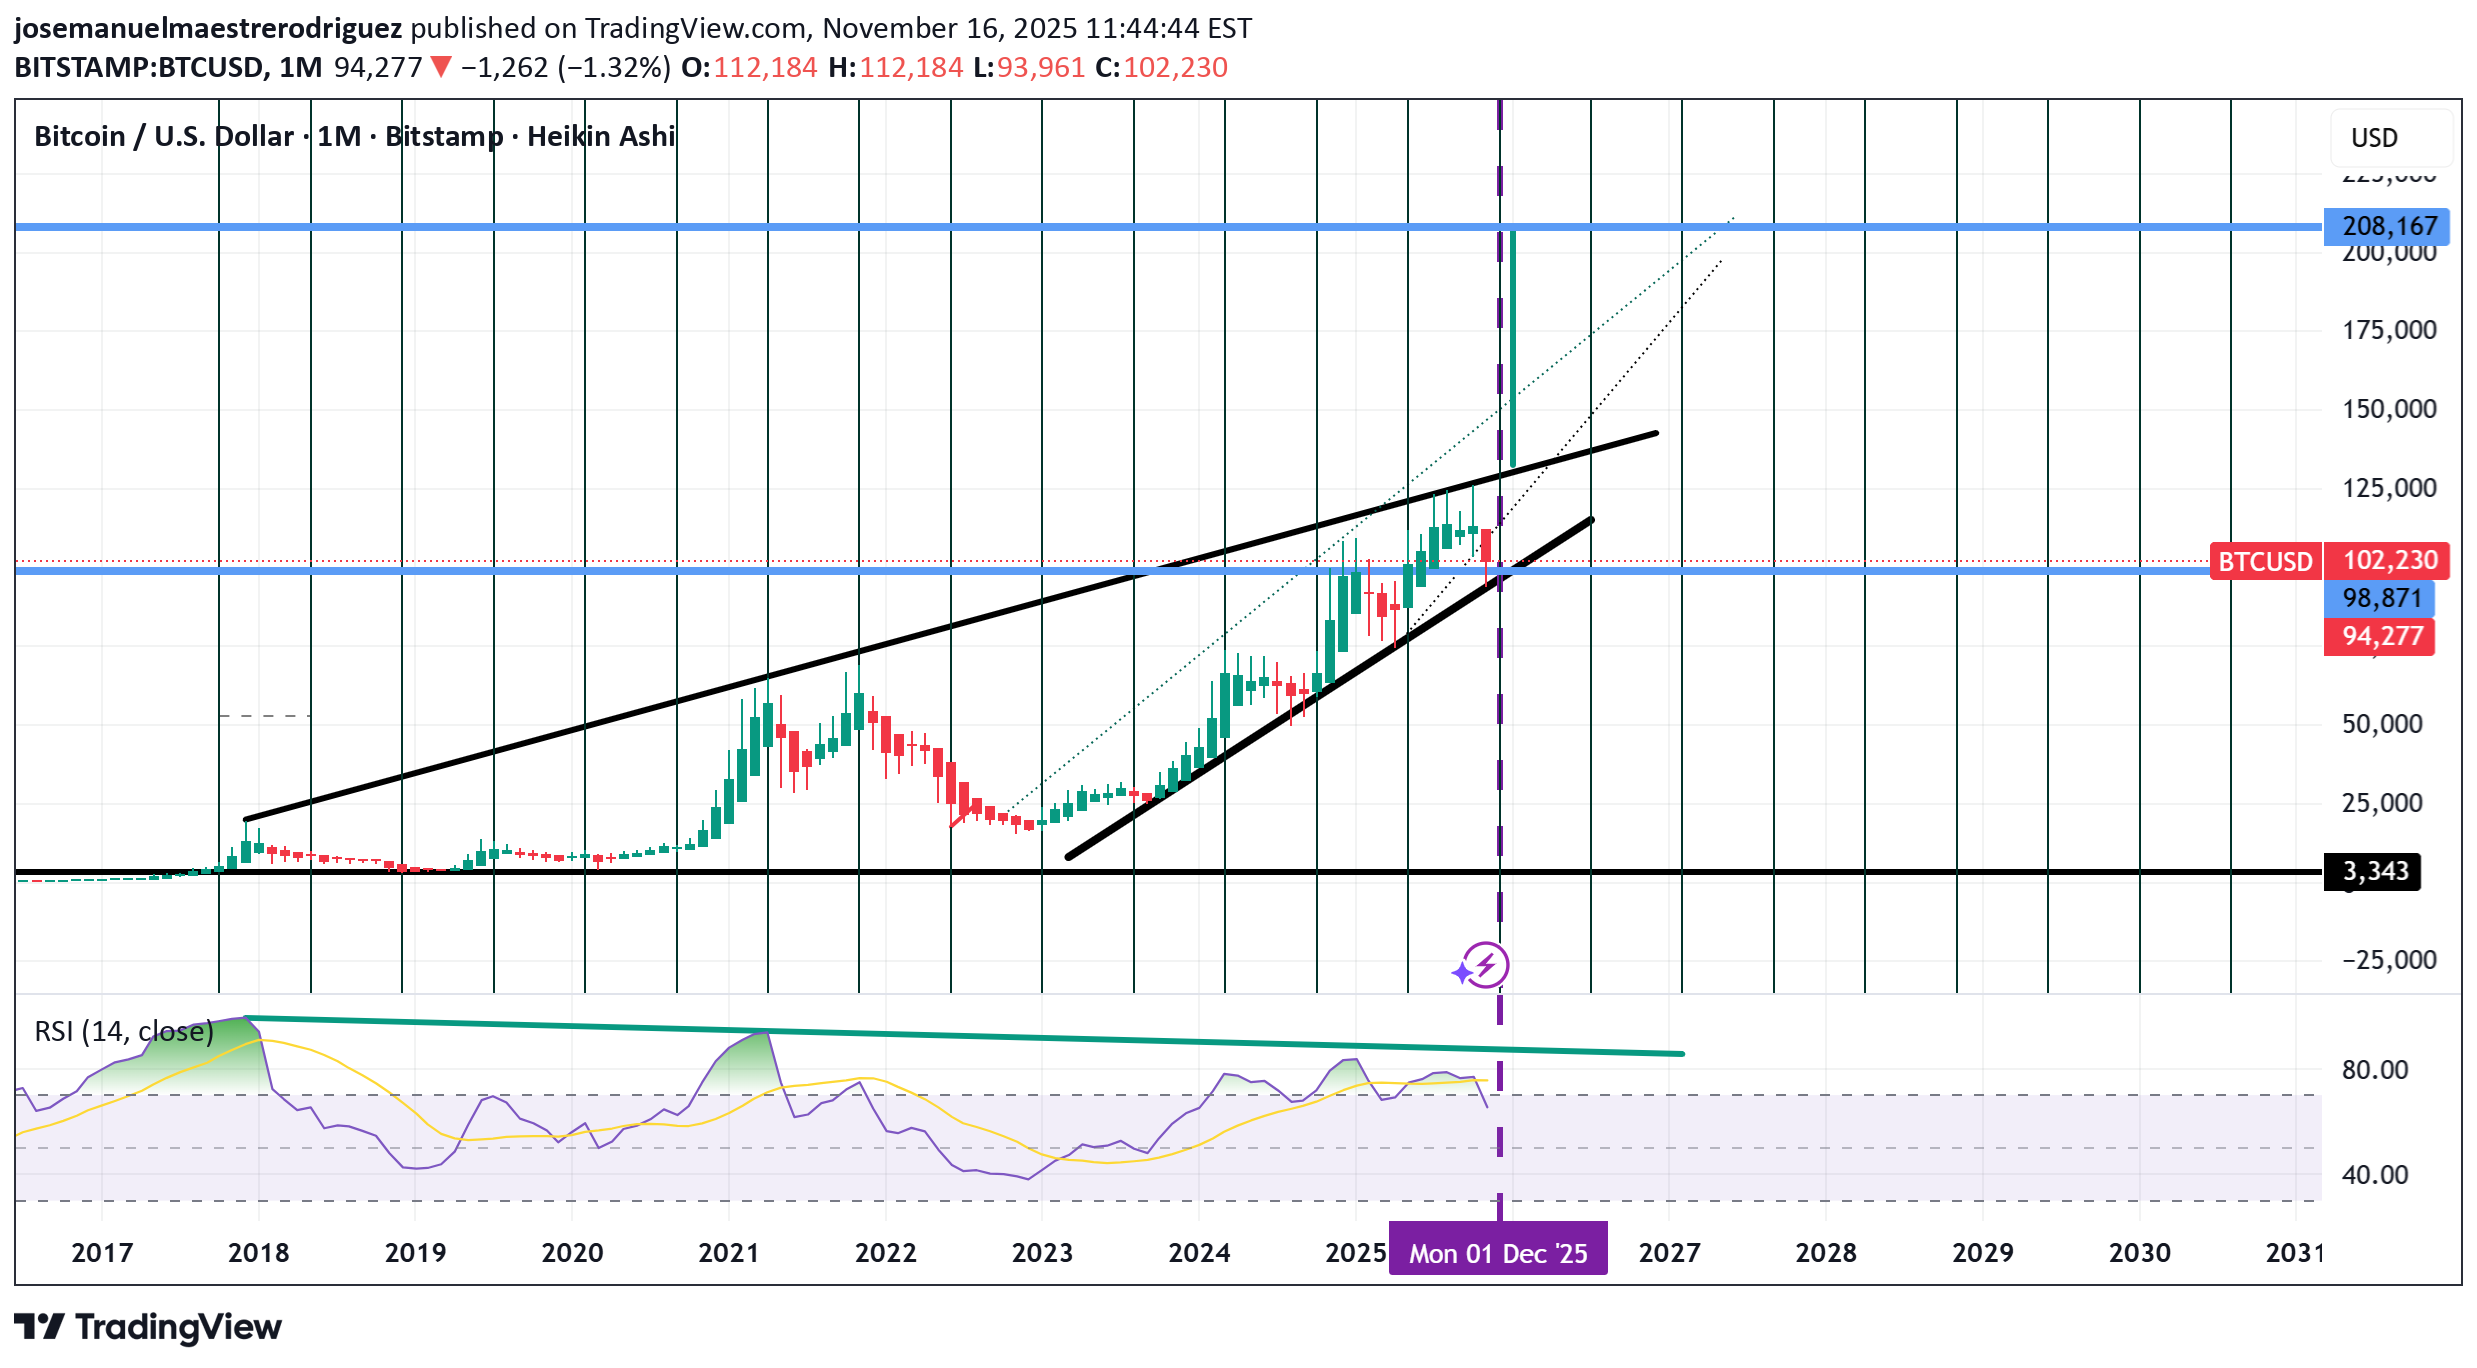
The chart is bullish. BTC is in a clear uptrend with a bottom at 93-94K. The moment that we are right now. Therefore, second half of November will start the next leg up. Confirmation of this theory: BTC needs to break out 98K on the daily.
josemanuelmaestrerodriguez
Small fish follow the stream
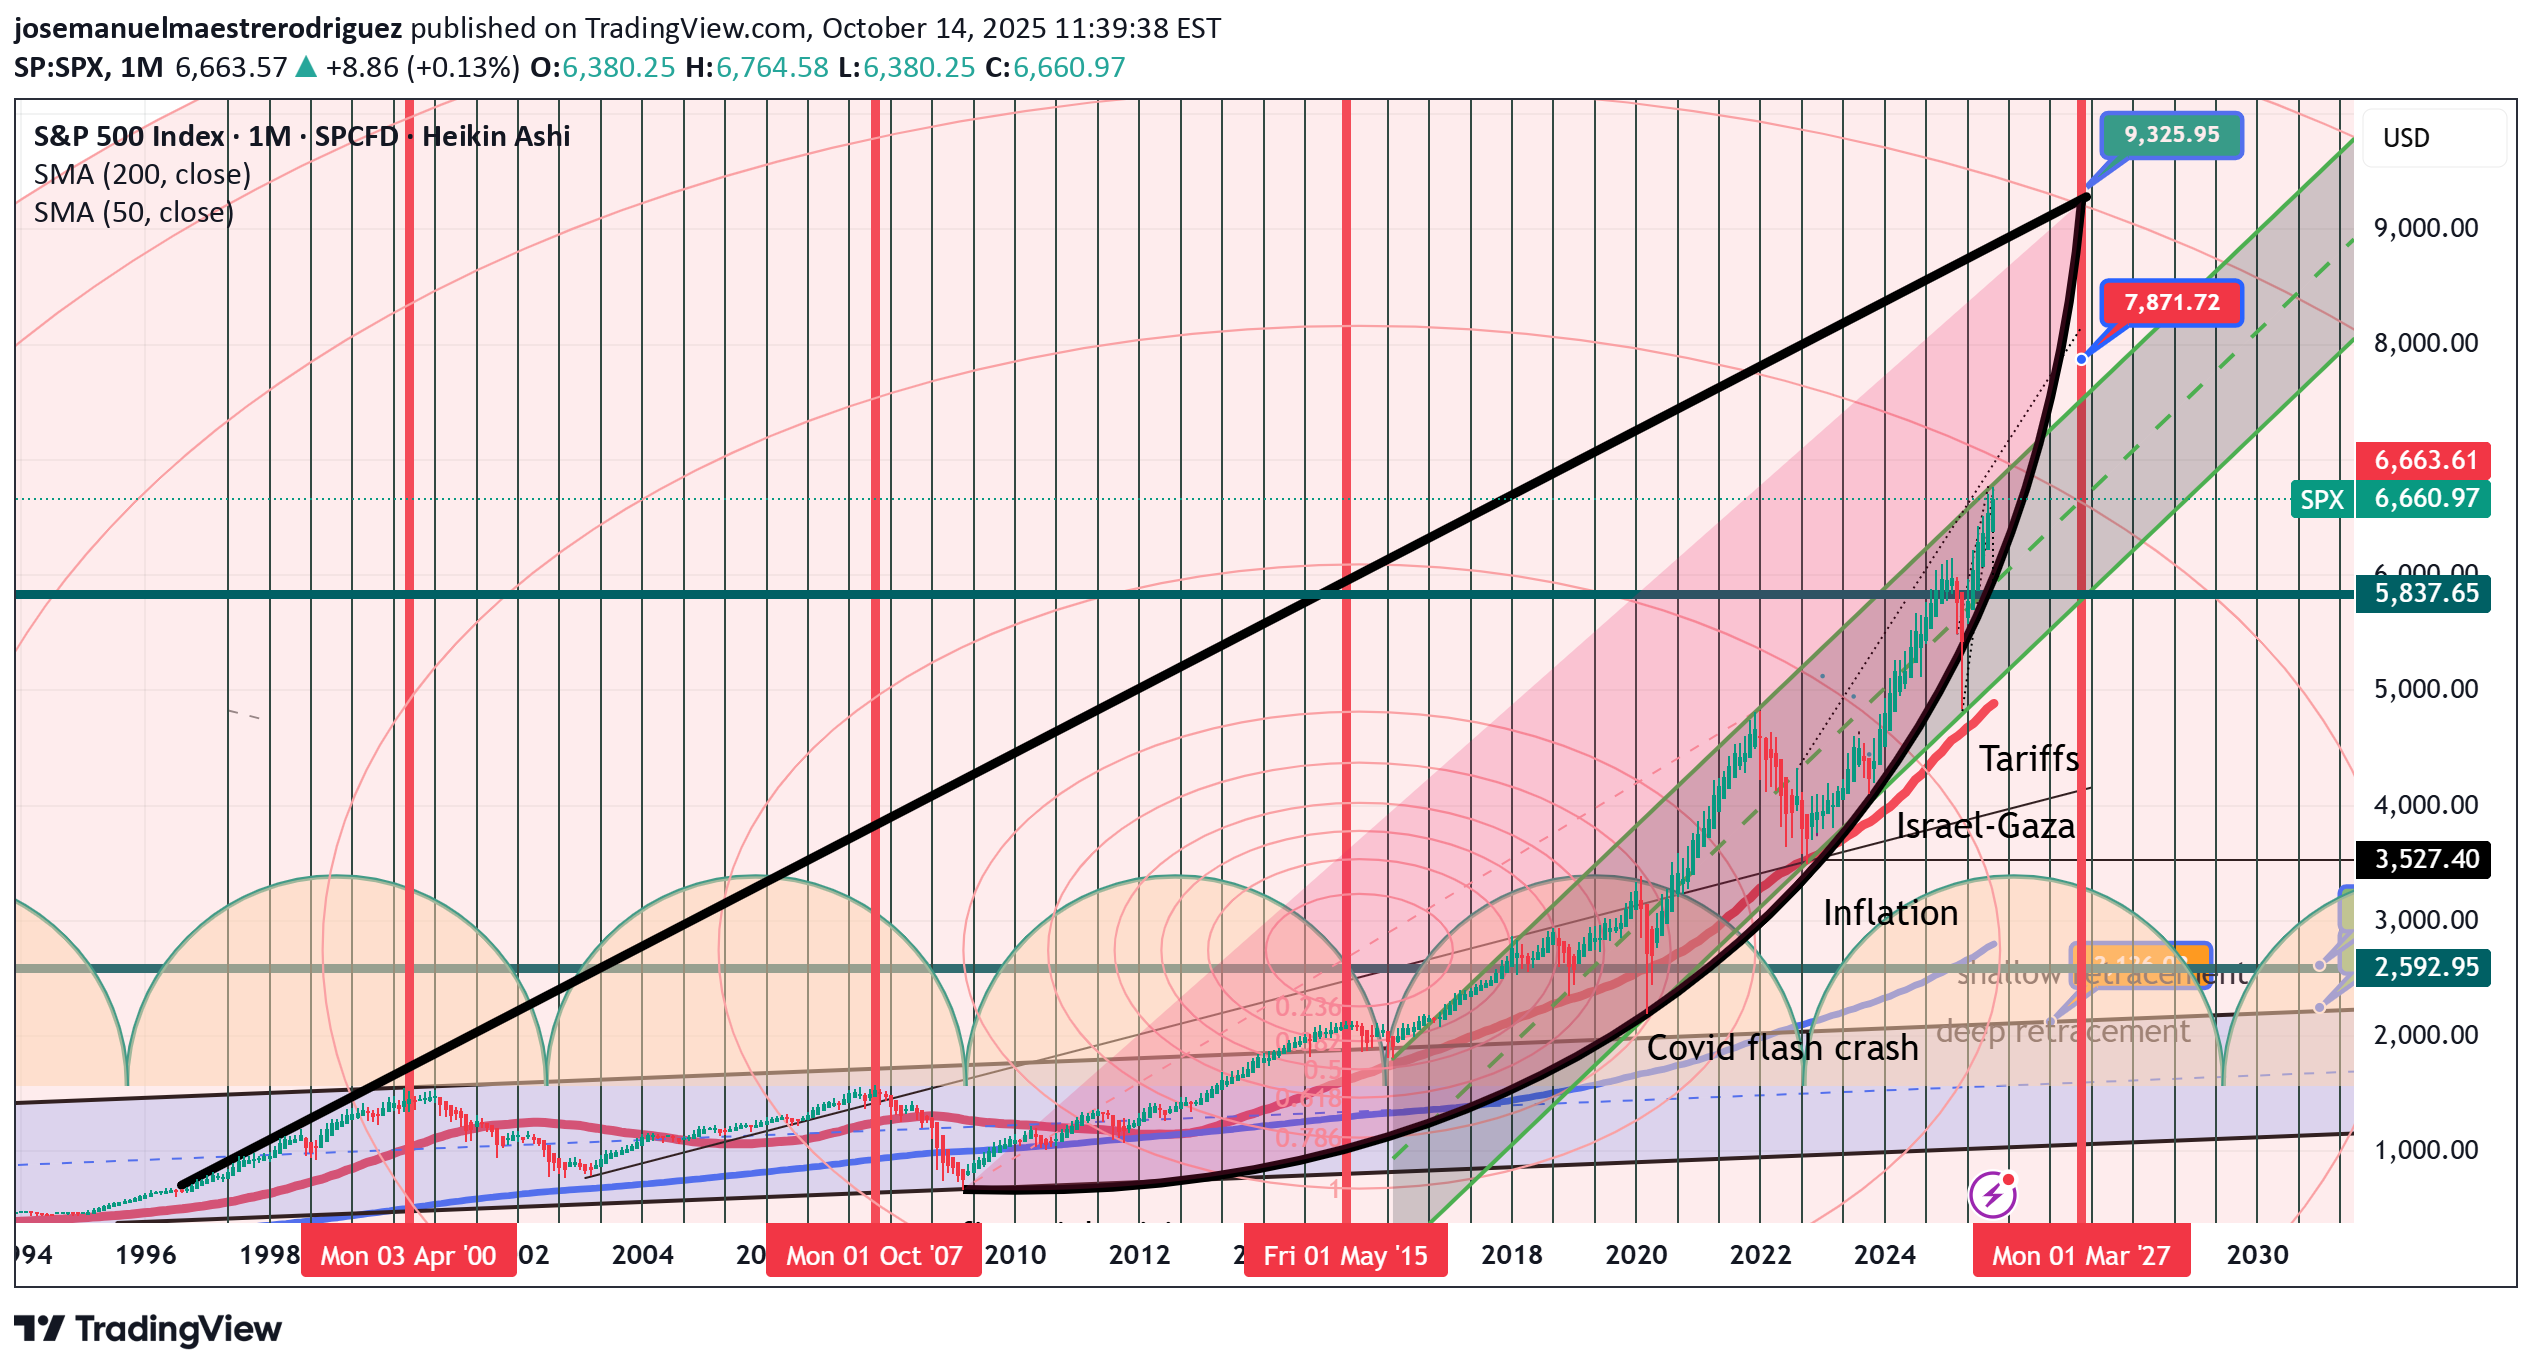
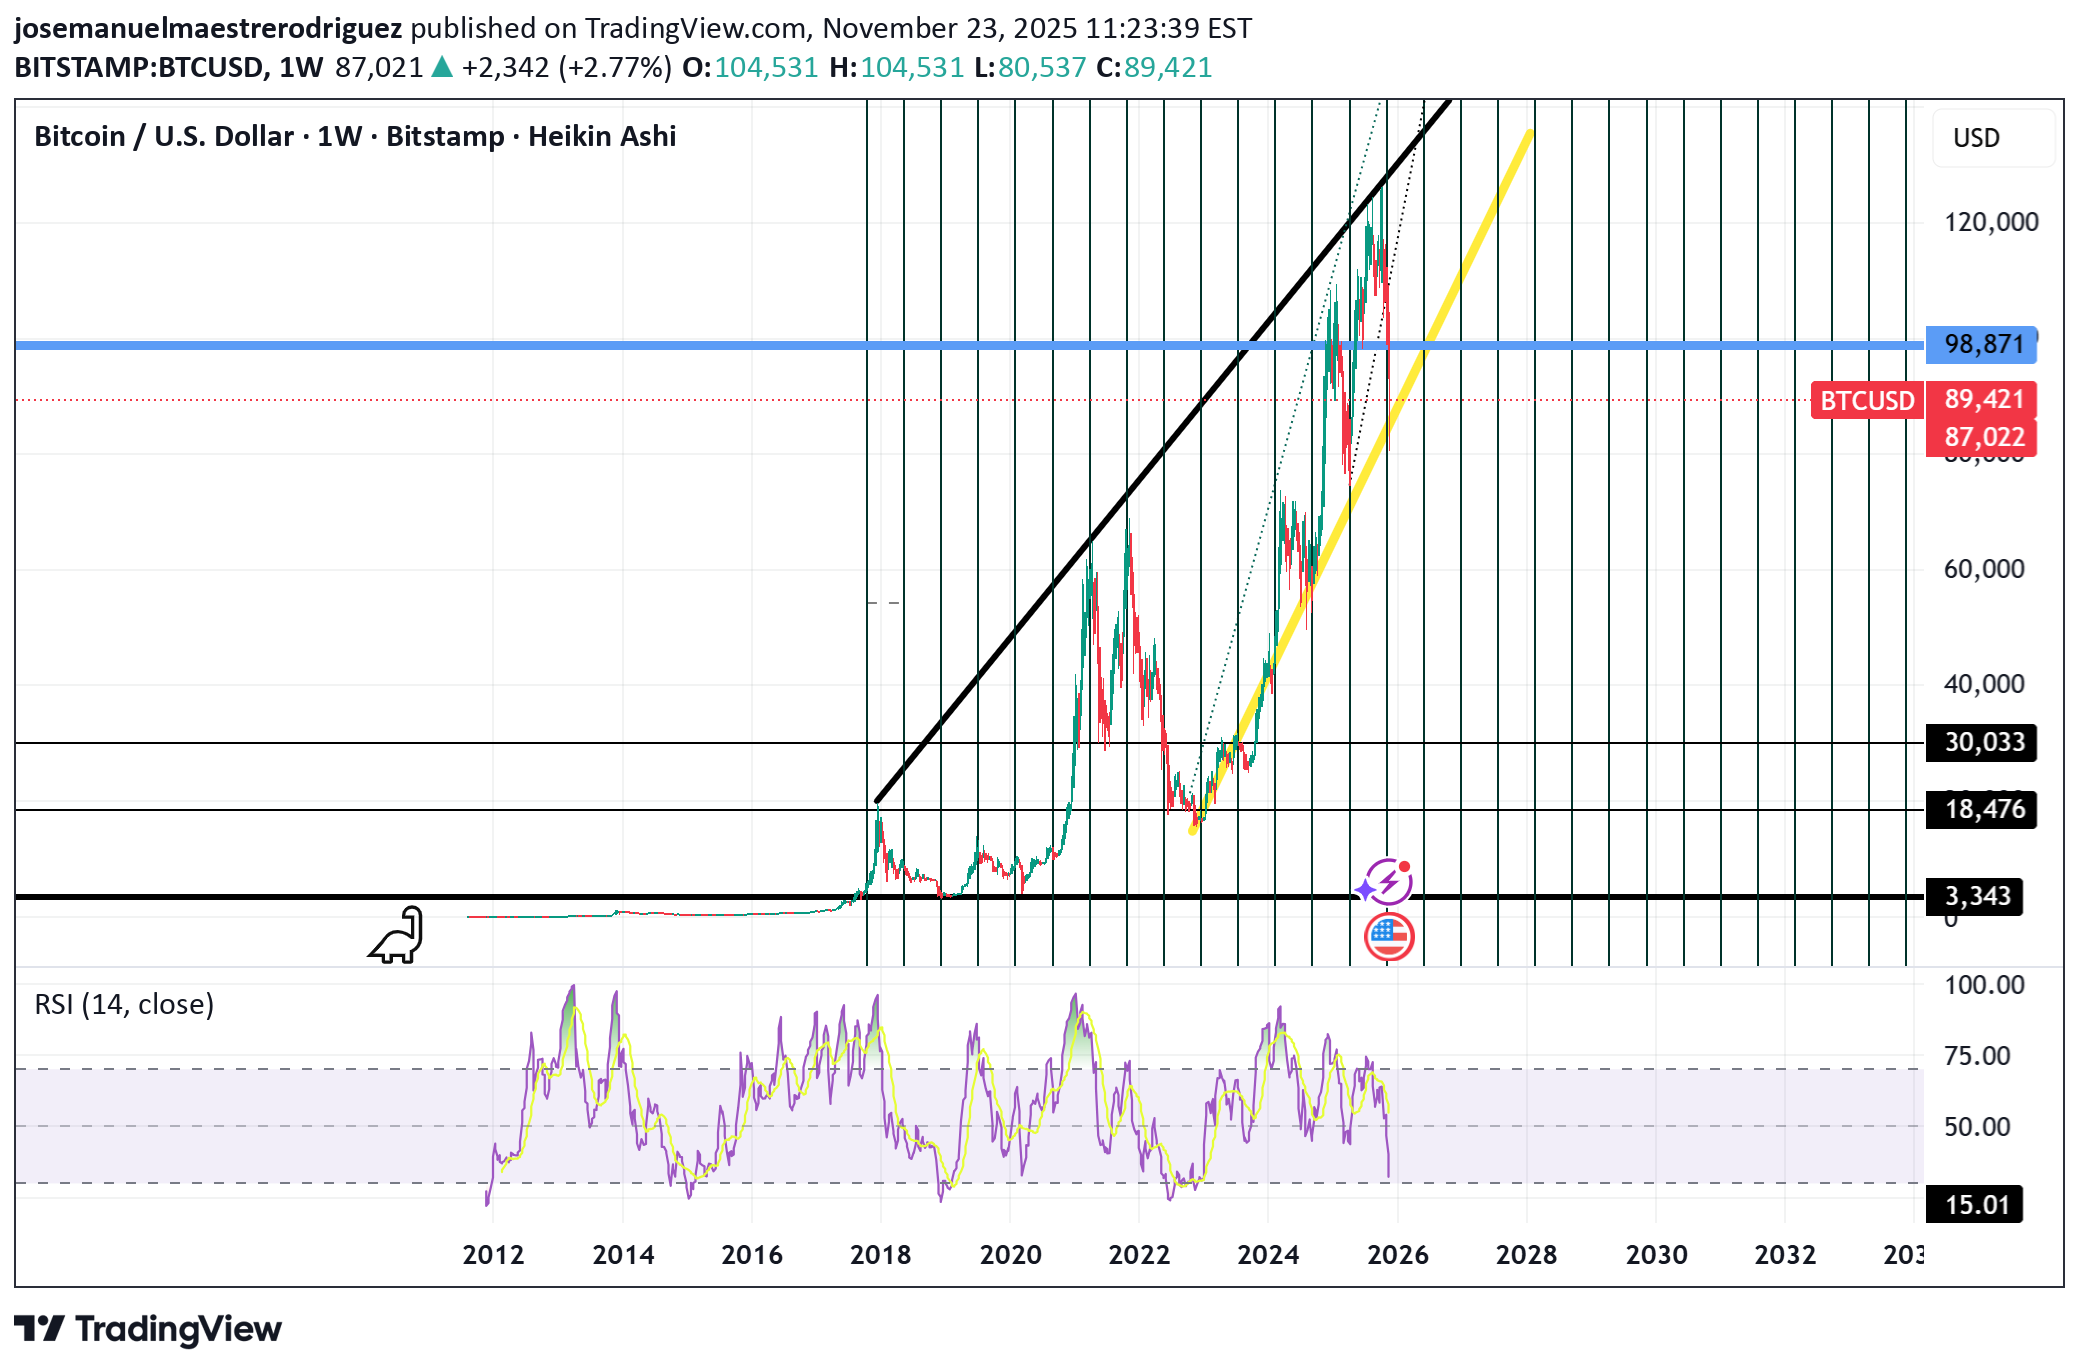
Update: My best case scenario. 9000 points in a massive bull run that started in 2009. Hyperbolic move since then. Top in March 2027
josemanuelmaestrerodriguez
15% uptrend until March 2027
Just have a look. The market is in an incredible bull run since 2009. Its move is parabolic and it will probably end around 8000 pips in March 2027. My theory is based in the bottoms of this cycles: 2008-2015-2020-2023-2025 or in other words: Finantial crisis. Covid Israel Conflict Trump´s Tariffs. Other indicators are Gann cycles which collide in the exact points. Therefore, my idea is to see Sp500 at 7800 points in March 2027 before seeing the huge crash that it must be needed to cool off after almost 20 years of bull run.
josemanuelmaestrerodriguez
Inflation 2022 trendline now is the key
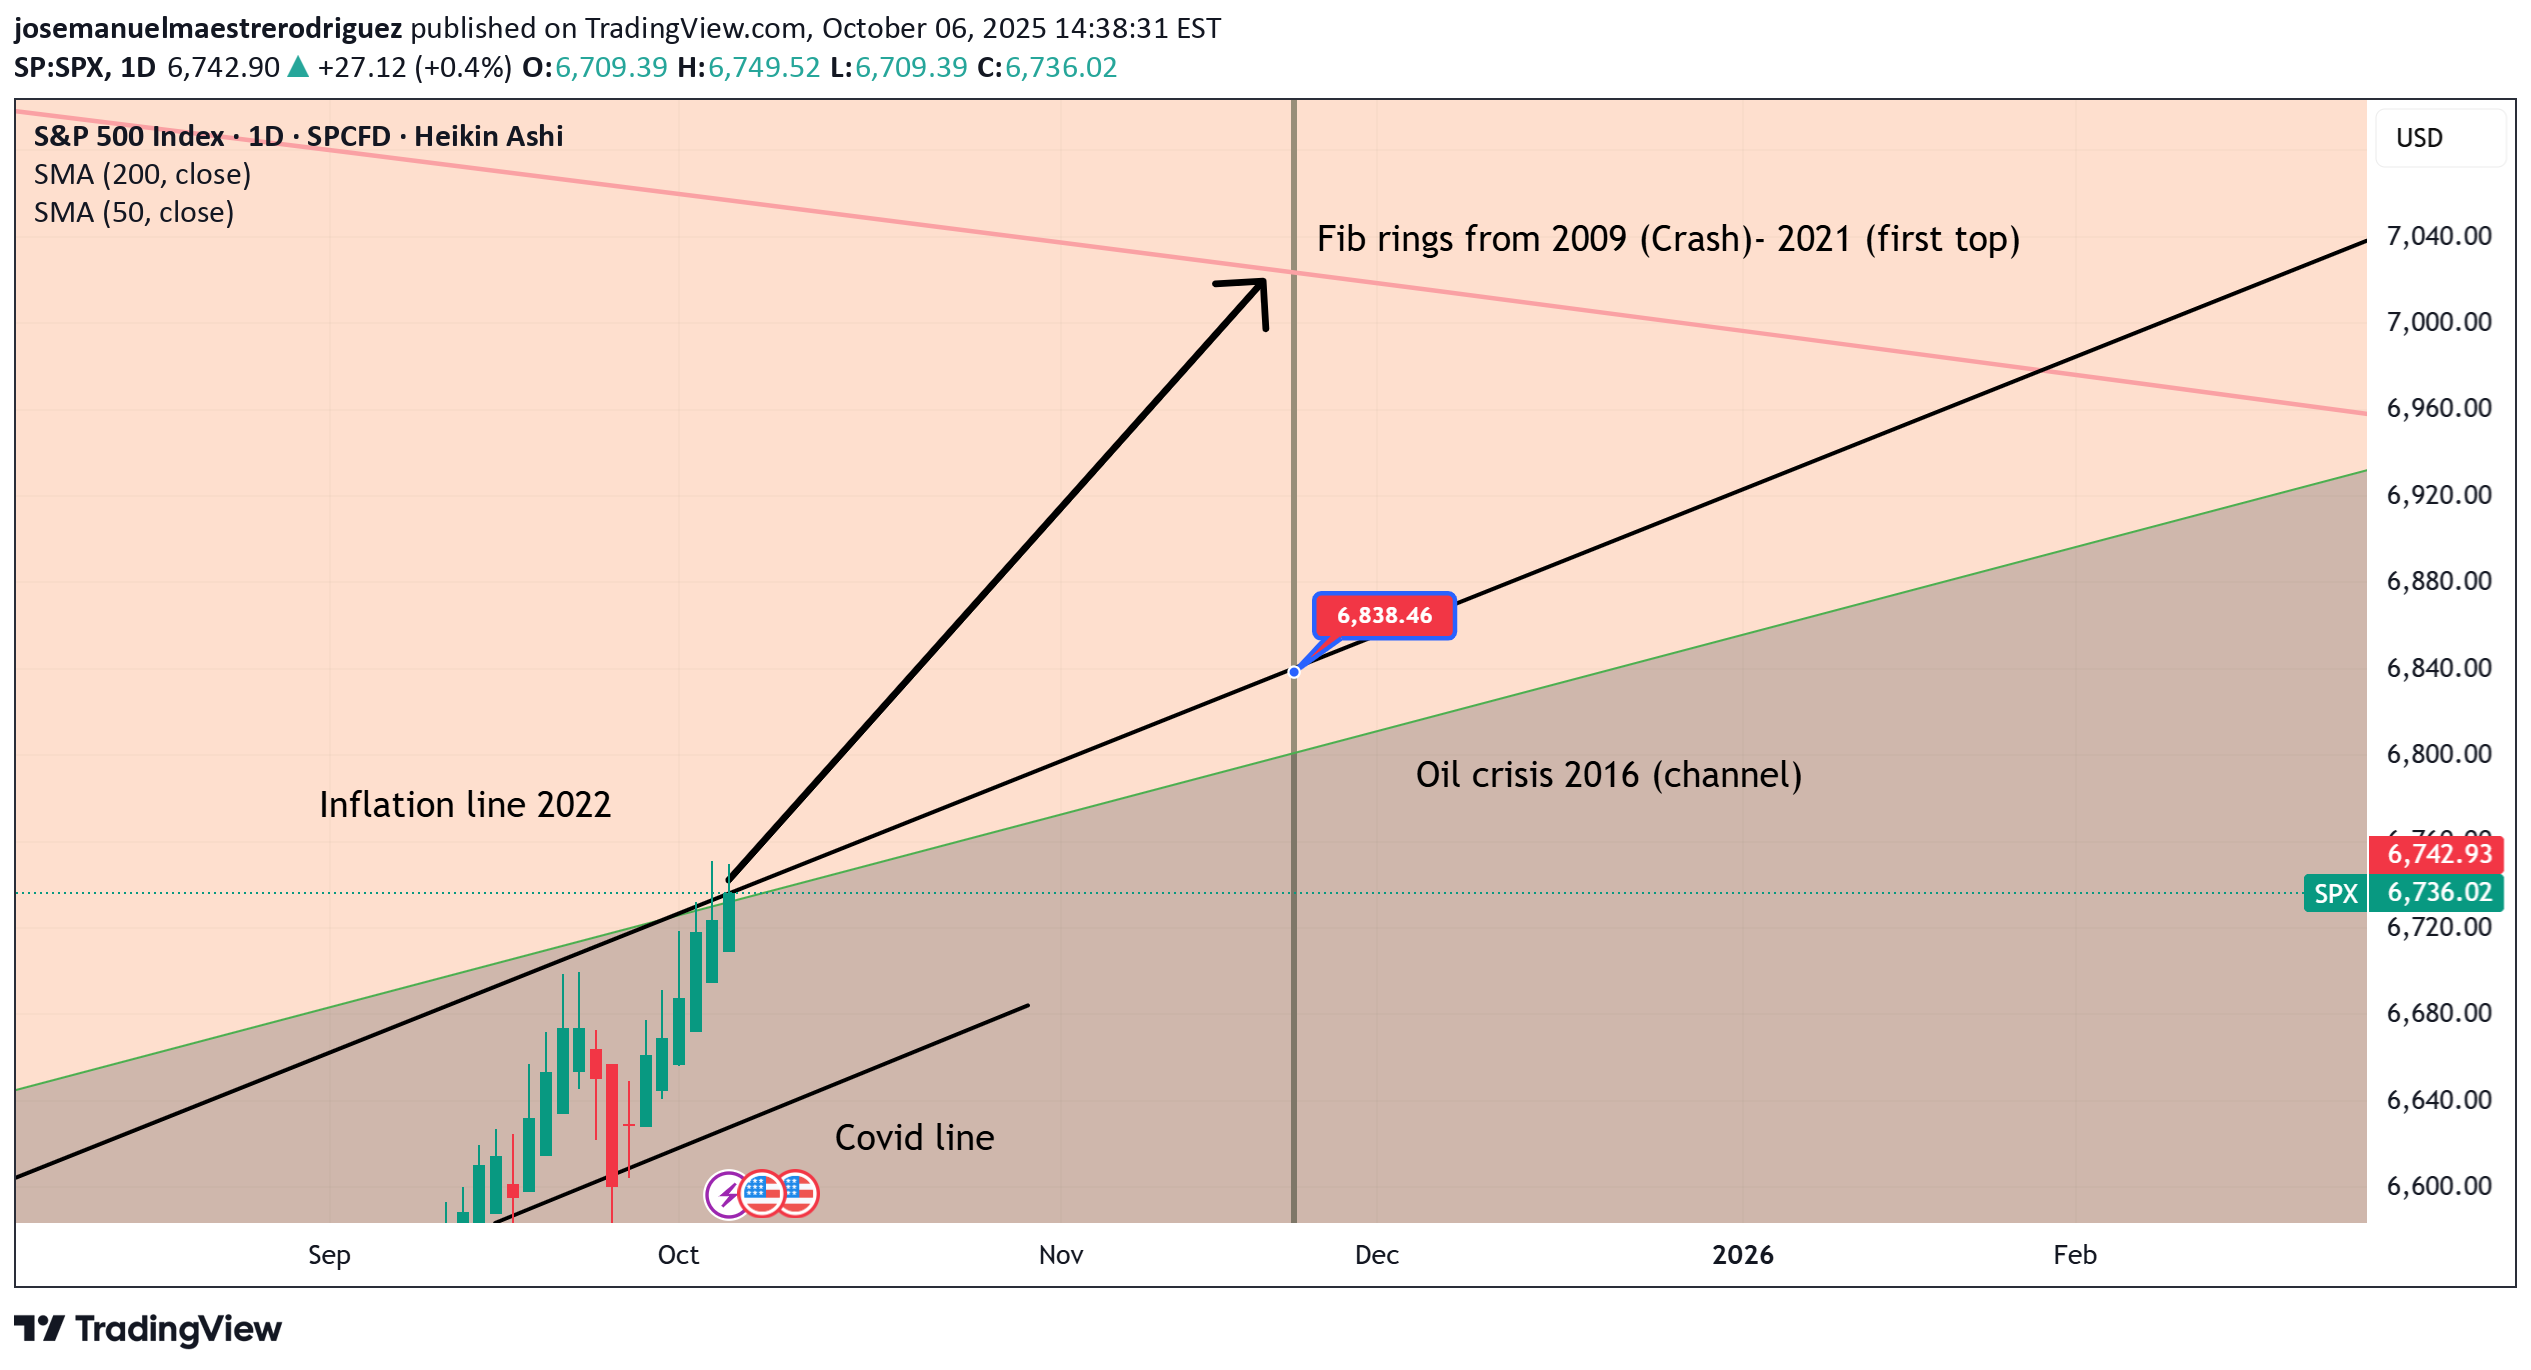
As you can see this trendline is acting as a major resistance. Once Spx break it out it is highly probable that that trendline turns into a support. Spx will test is and if it holds we can see 7000/7050 pips by the end of November 2025. That is a 4% gain. I would like to highligh that because the liquidity in the system is so high is very probable to see this happen... and yes... this is only the beginning because then at 7000 pips there is a Fib ring which could provide us the real progression of the Sp500
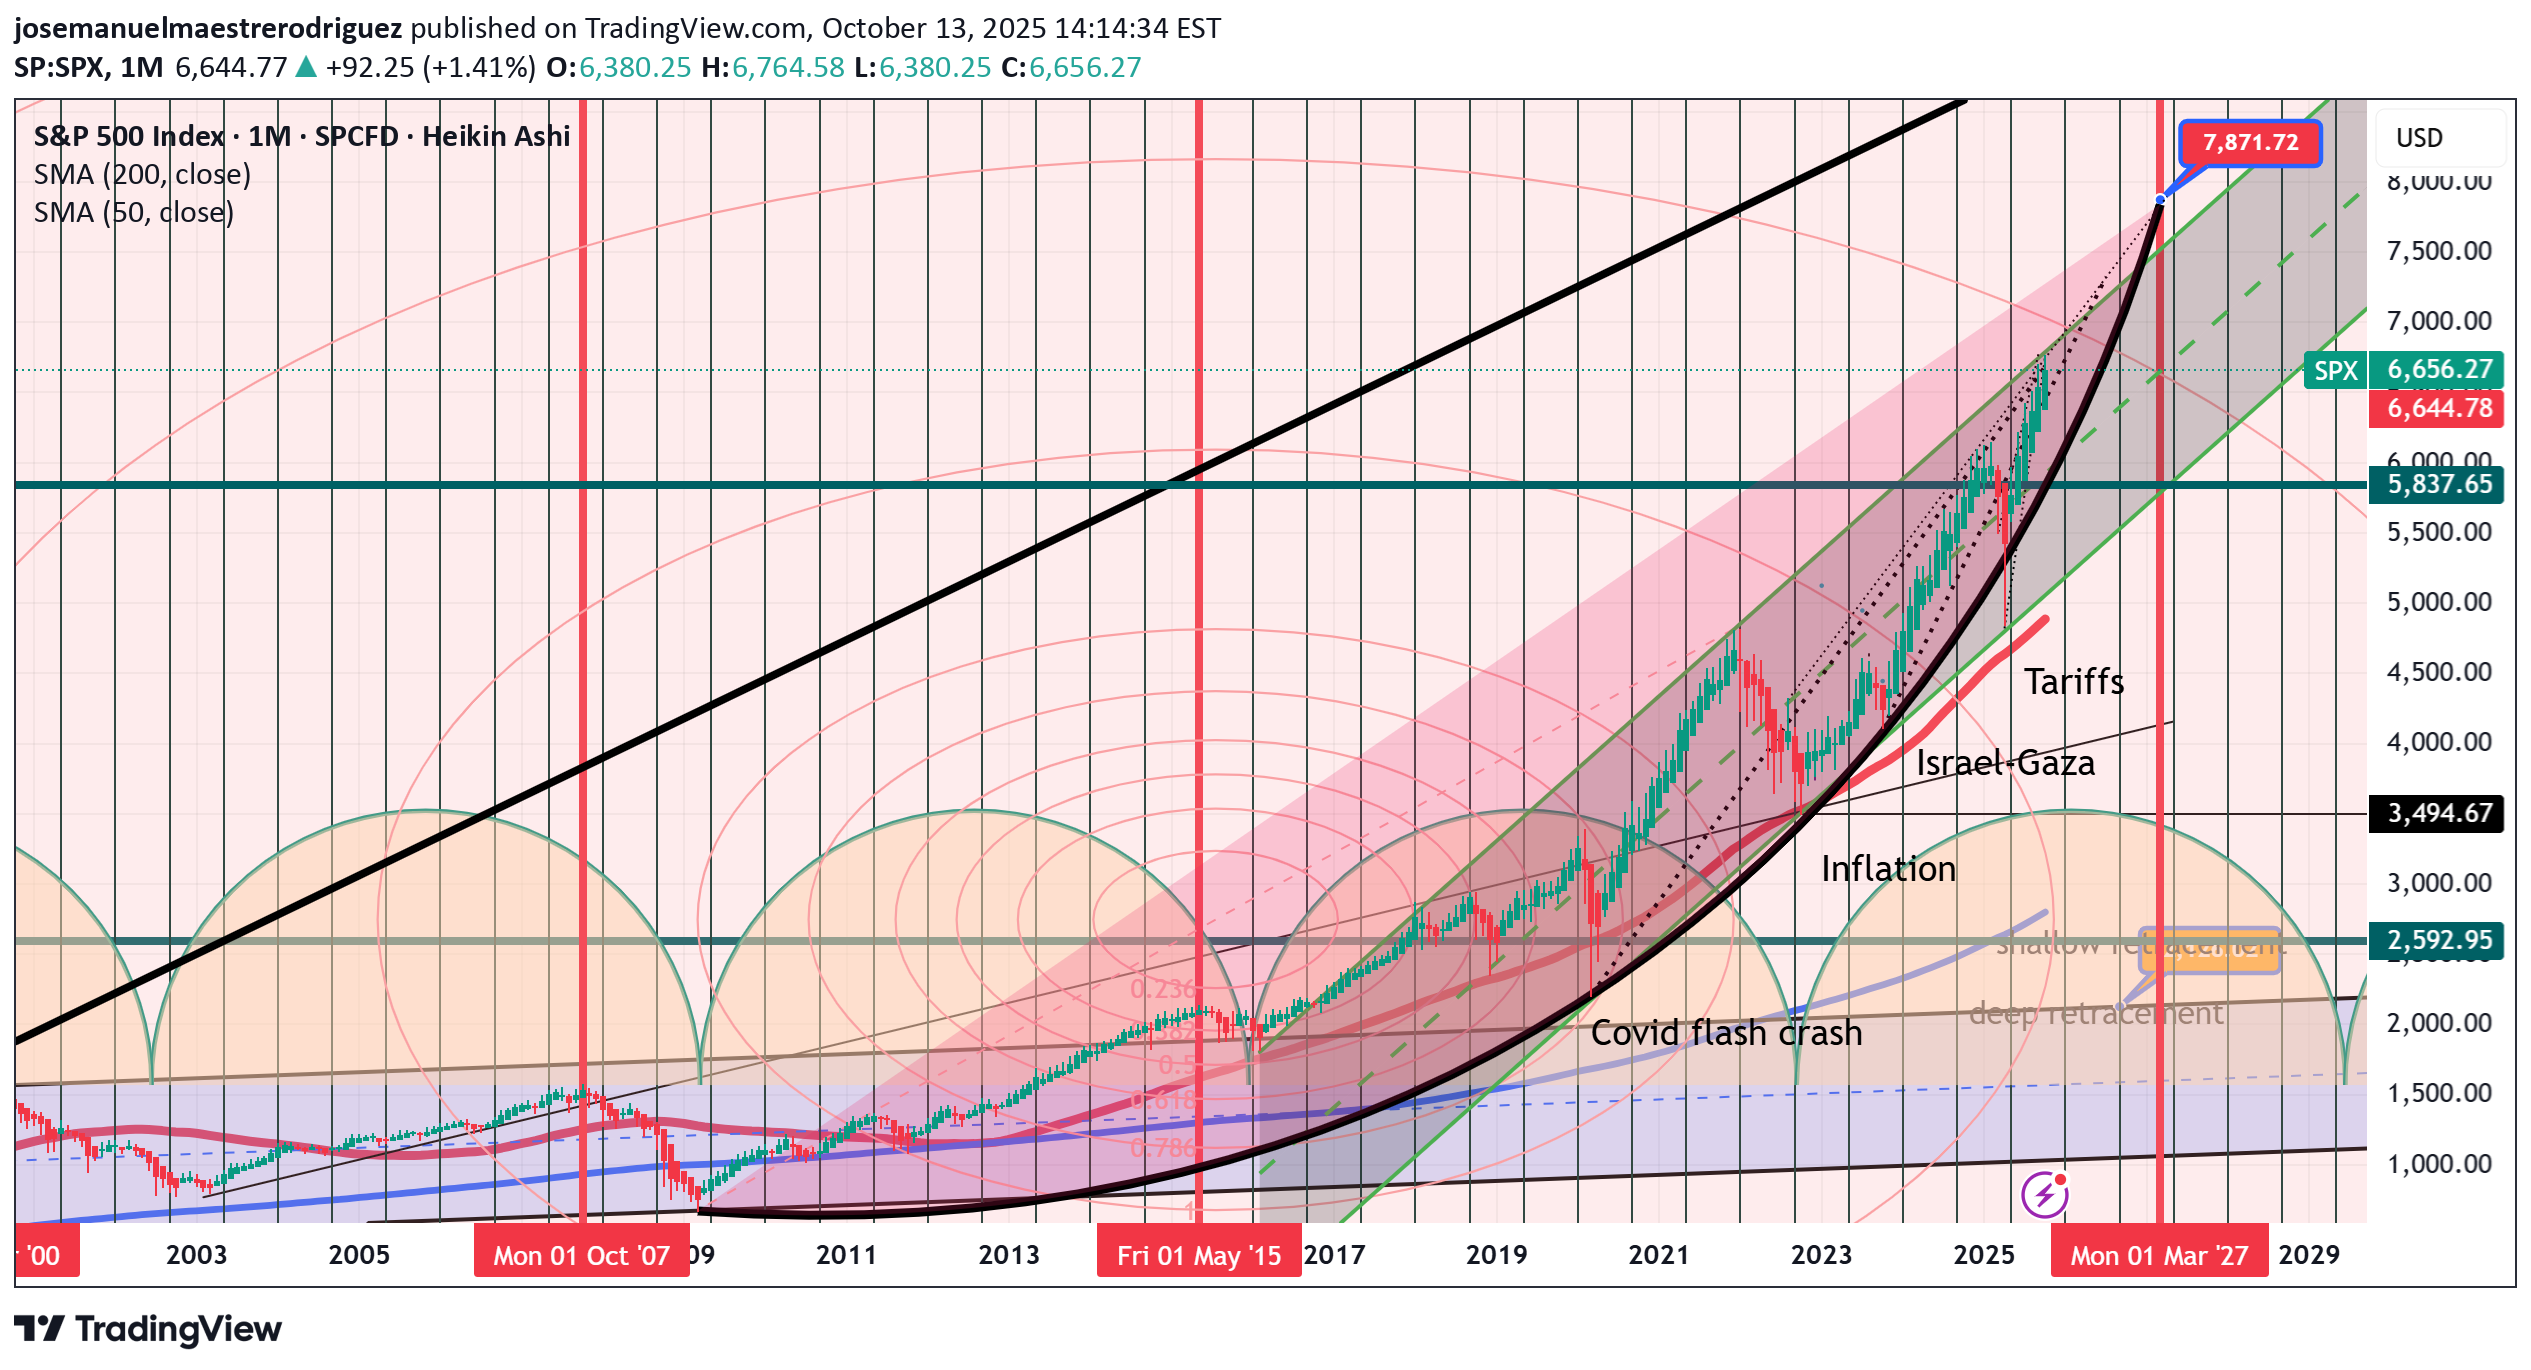
josemanuelmaestrerodriguez
How far Spx can go? My guess is 9000 point by March 2027
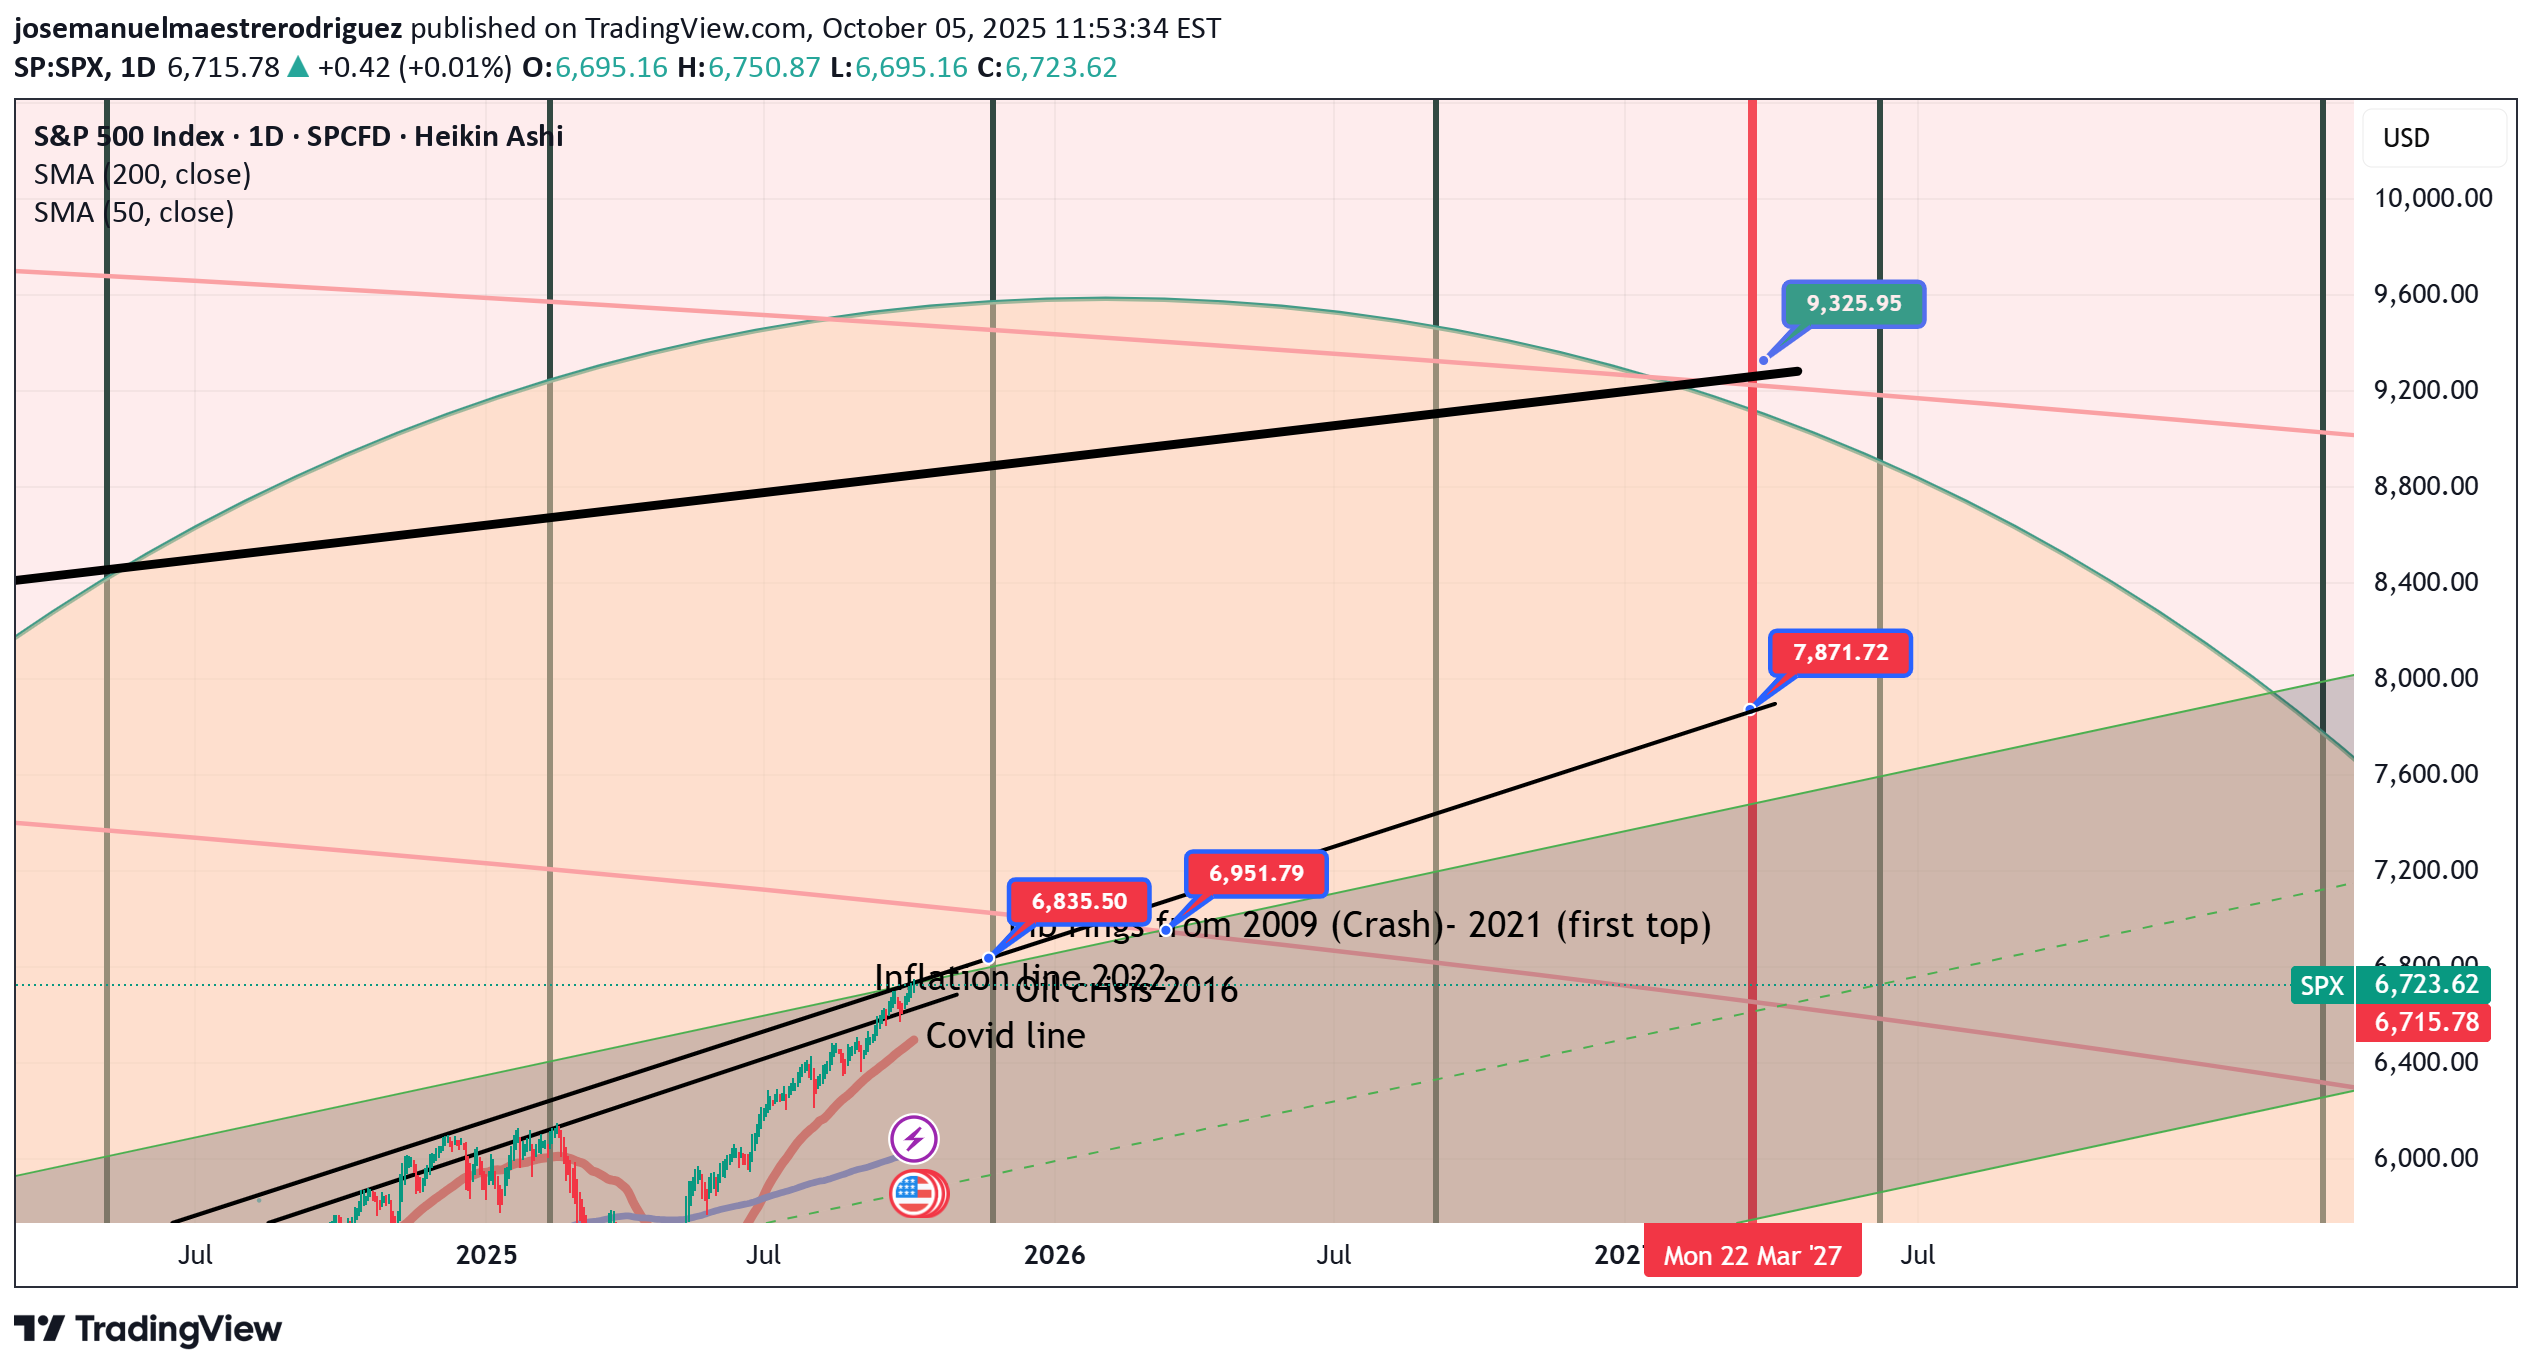
Gann cycles are telling me that if the liquidiy in the system carries on we can see a bullish 2026 and the top of the market in March 2027. After that I expect a major crash. Therefore, I could tell that 1929 crash is on the horizon but this time a little bit earlier. If I am Ok, we could see 2027 top and two years of sell off in the market.
josemanuelmaestrerodriguez
KEY AREAS
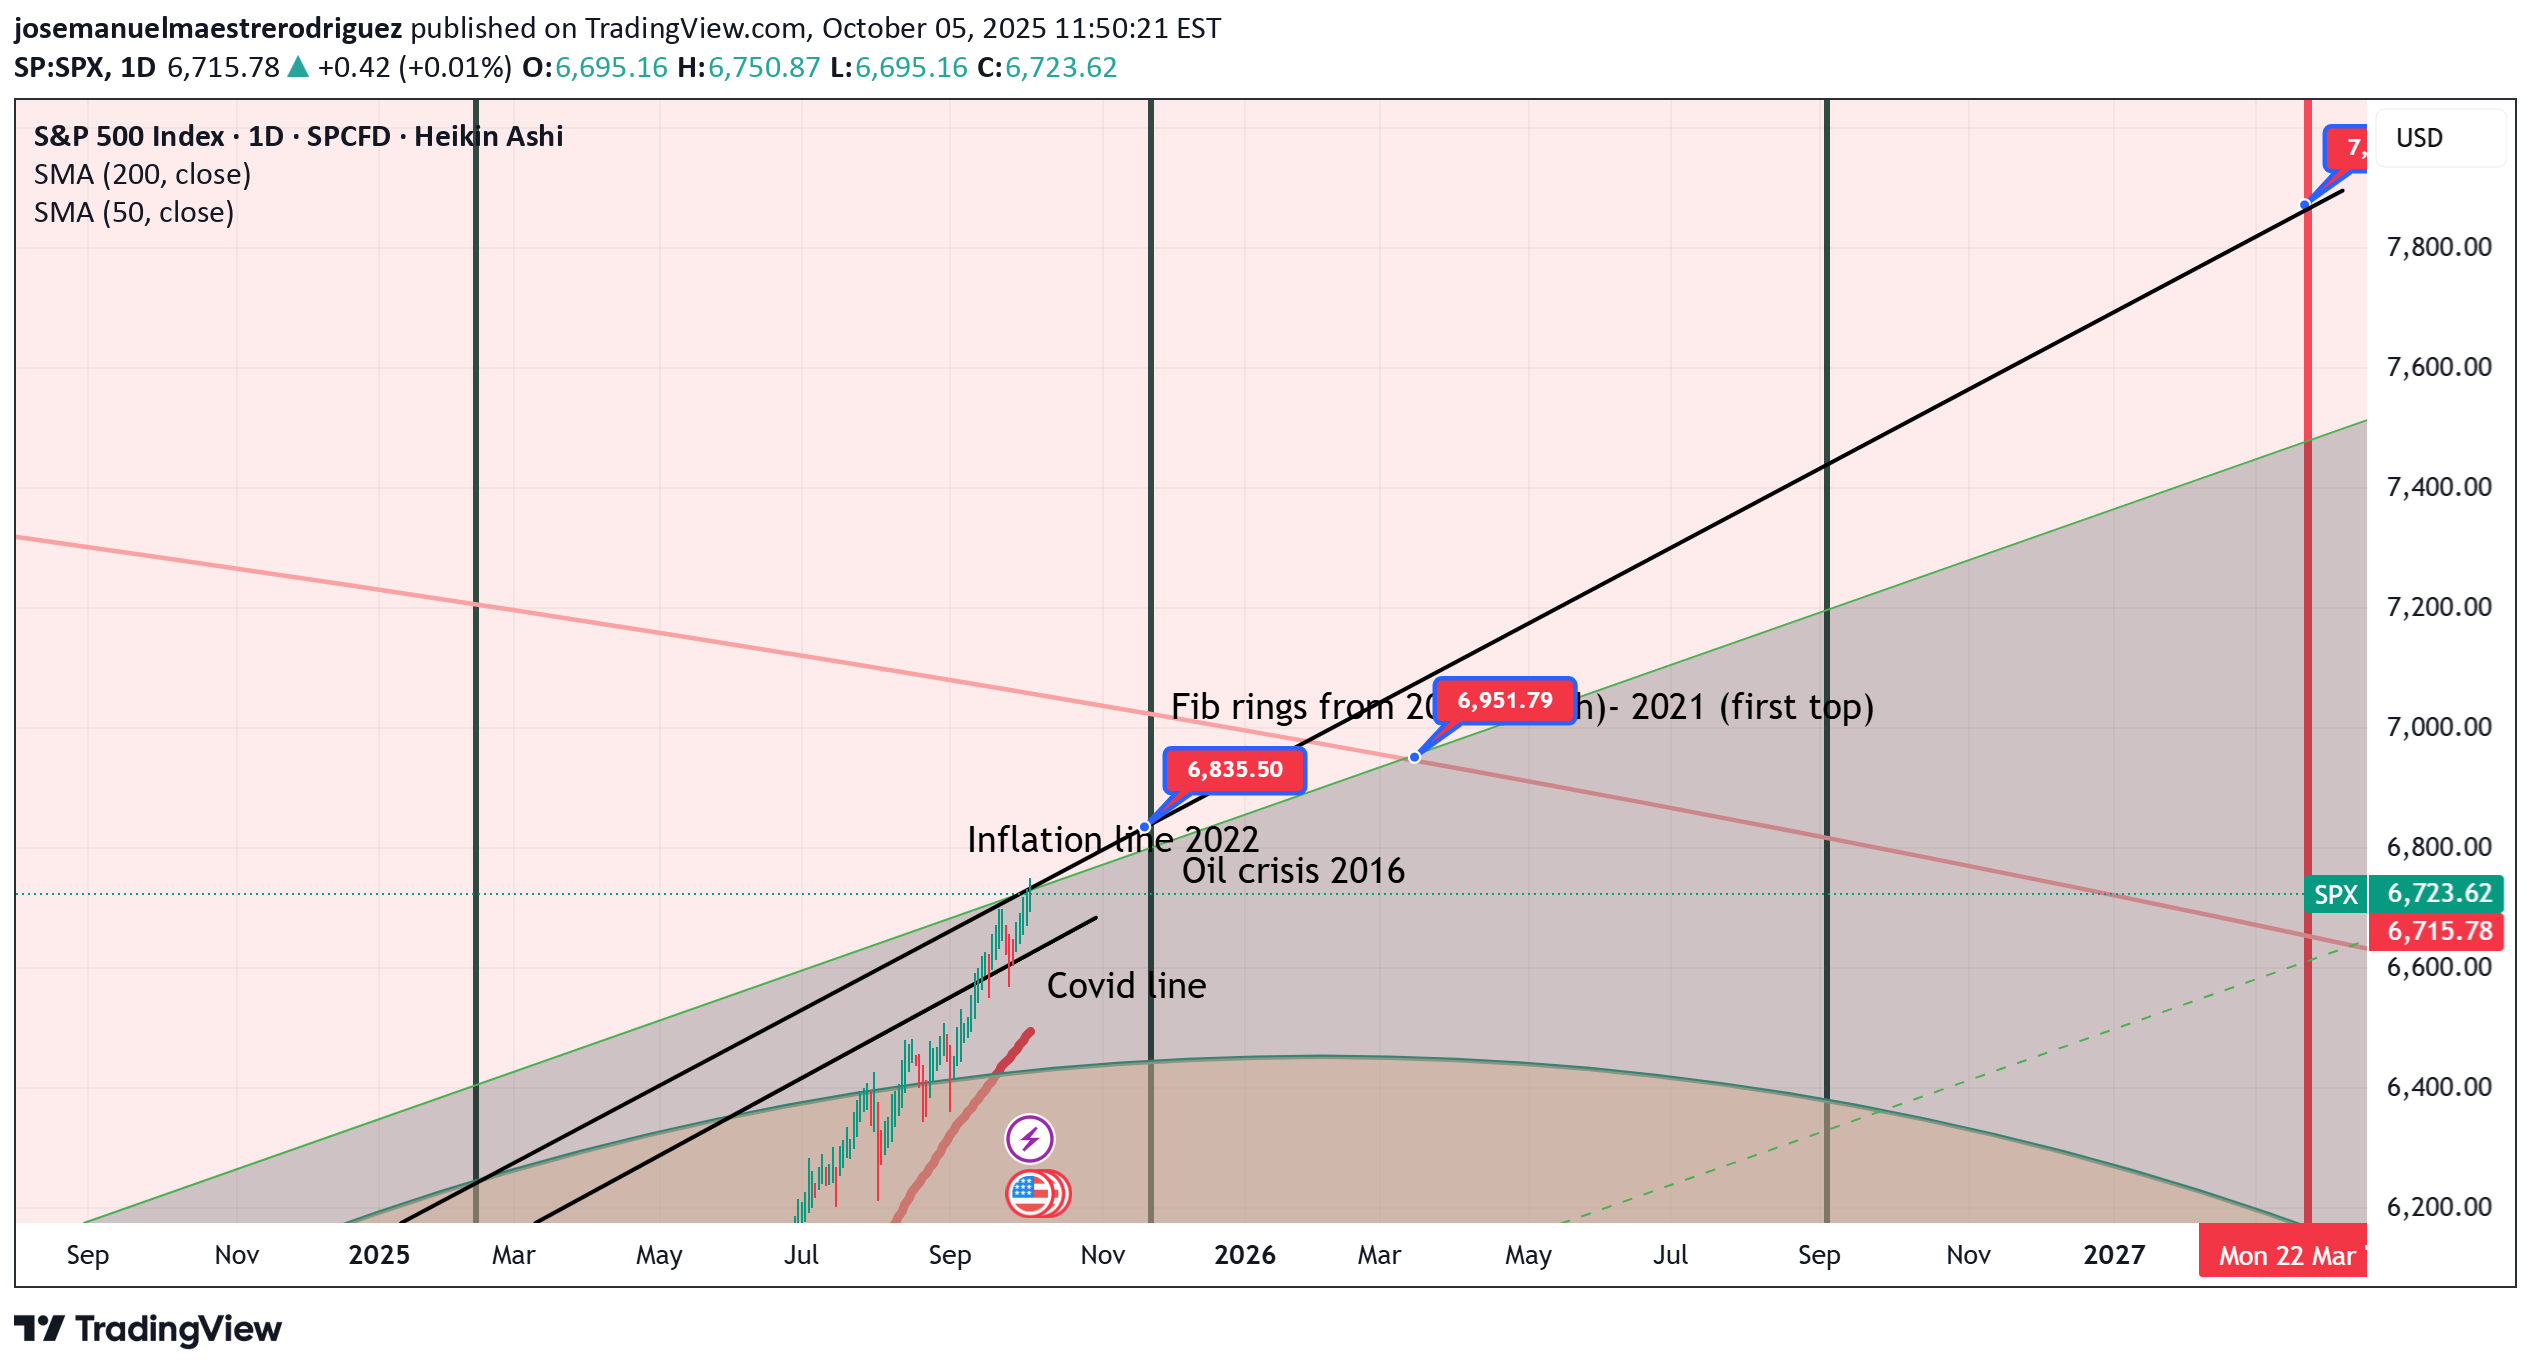
Liquidity is on the system. That will allow Spx continue growing. Now, the question is: How far Spx will go? and the most important. Until when? Spx is clingin between very important support and resistance zones: Covid 2020, Oil 2016, previous tops (2021) and Inflation (2022). The Gann cycle allows me to point out a date: 20th November as a key date. Cycles as this allows me to see a major break out. We could see 7000 pips by the end of November and then a continuation. Just have a look at this support and resistance areas which so far are playing out beautifuly.
Disclaimer
Any content and materials included in Finbeet's website and official communication channels are a compilation of personal opinions and analyses and are not binding. They do not constitute any recommendation for buying, selling, entering or exiting the stock market and cryptocurrency market. Also, all news and analyses included in the website and channels are merely republished information from official and unofficial domestic and foreign sources, and it is obvious that users of the said content are responsible for following up and ensuring the authenticity and accuracy of the materials. Therefore, while disclaiming responsibility, it is declared that the responsibility for any decision-making, action, and potential profit and loss in the capital market and cryptocurrency market lies with the trader.