
mastercrypto2020
@t_mastercrypto2020

What symbols does the trader recommend buying?
Purchase History
Trader Messages
Filter
Message Type
mastercrypto2020
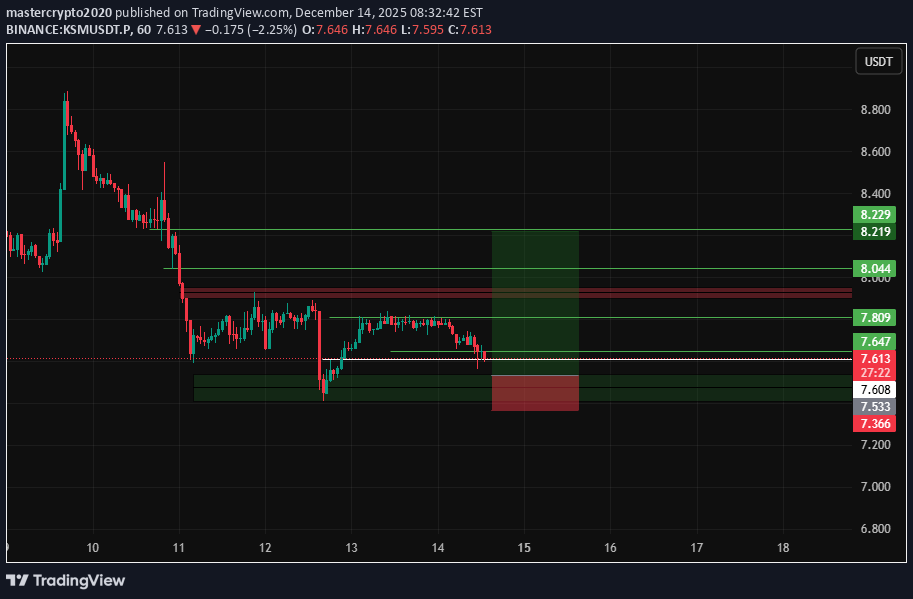
--- 📢 Official Trade Signal – KSM/USDT 📈 Position Type: LONG 💰 Entry Price: 7.533 --- 🎯 Take-Profit Targets (Partial Exits) • TP1: 7.647 • TP2: 7.800 • TP3: 8.040 • TP4: 8.229 • TP5: — • TP6: — --- 🛑 Stop-Loss: 7.360 📊 Timeframe: 15m ⚖️ Risk/Reward Ratio: — 💥 Suggested Leverage: 5× – 10× --- 🧠 Technical Analysis Summary KSM is reacting positively from a strong intraday demand zone, holding above key support at 7.36. Market structure on the 15m timeframe shows bullish continuation with higher lows forming. Liquidity is stacked above current price, making the following levels highly probable: 7.647 → first resistance & liquidity grab 7.800 → intraday breakout level 8.040 → structure expansion 8.229 → higher timeframe resistance As long as price holds above 7.36, bullish momentum remains valid. --- ⚙️ Trade Management Rules ✔ Partial profit at TP1 ✔ Move SL to Break-Even after TP1 ✔ Trail SL as price moves toward TP3–TP4 ✔ No re-entry if SL (7.360) is hit ✔ Always confirm price action before entry --- ⚠️ Risk Management Is Mandatory Trade smart. Protect capital first. --- 🔗 VIP Signals Channel: 👉 [ t.me/CryptoMasterr_signl_bot --- 📌 TradingView Hashtags #KSMUSDT #KSM #CryptoSignal #LongSetup #TradingView #FuturesTrading #PriceAction --
mastercrypto2020
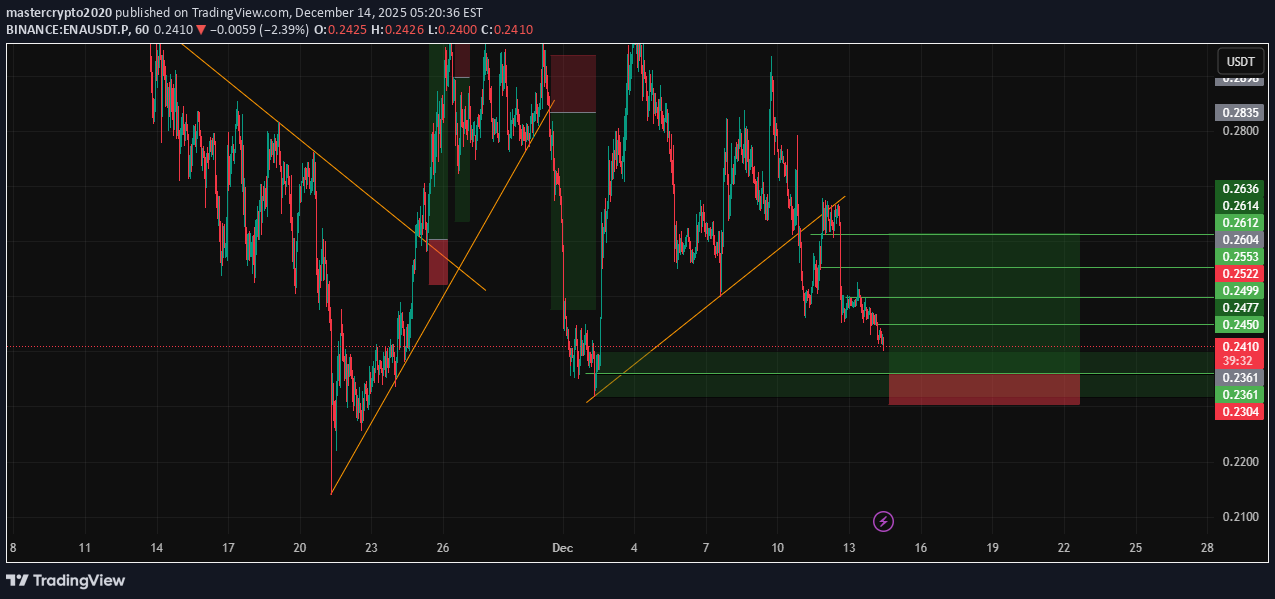
--- 📢 Official Trade Signal – ENA/USDT 📈 Position Type: LONG 💰 Entry Price: 0.2400 0.2360 --- 🎯 Take-Profit Targets (Partial Exits) • TP1: 0.2450 • TP2: 0.2499 • TP3: 0.2553 • TP4: 0.2612 • TP5: — • TP6: — --- 🛑 Stop-Loss: 0.2300 📊 Timeframe: 15m ⚖️ Risk/Reward Ratio: — 💥 Suggested Leverage: 3× – 5× --- 🧠 Technical Analysis Summary ENA is holding above a strong intraday demand zone near 0.23, showing signs of bullish continuation. On the 15m timeframe, price structure indicates higher lows with increasing buying pressure. Liquidity pools are clearly stacked above current price, aligning with our upside targets: 0.2450 → minor resistance & first liquidity 0.2499 → intraday high sweep 0.2553 → structure breakout level 0.2612 → higher timeframe resistance & final bullish target A clean hold above 0.24 confirms bullish momentum toward higher targets. --- ⚙️ Trade Management Rules ✔ Partial profit at TP1 ✔ Move SL to Break-Even after TP1 is hit ✔ Trail SL as price reaches TP2–TP4 ✔ No re-entry if SL (0.2300) is hit ✔ Confirm bullish structure before entering --- ⚠️ Risk-Management Note Capital protection is mandatory. Once TP1 is secured, the trade becomes risk-free by moving SL to entry. --- 📌 TradingView Hashtags #ENAUSDT #ENA #CryptoSignal #LongSetup #TradingView #FuturesTrading #TechnicalAnalysis ---
mastercrypto2020
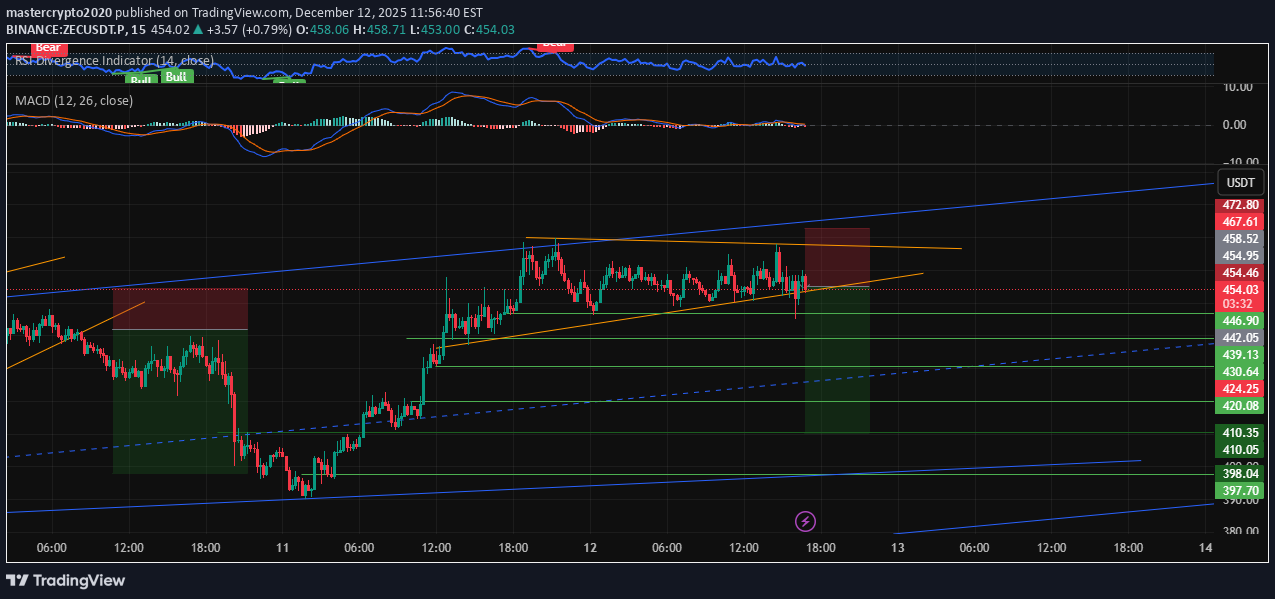
--- 📢 Official Trade Signal – ZEC/USDT 📉 Position Type: SHORT 💰 Entry Price: 454.45 --- 🎯 Take-Profit Targets (Partial Exits) • TP1: 446.88 • TP2: 439.40 • TP3: 430.54 • TP4: 419.74 • TP5: — • TP6: — --- 🛑 Stop-Loss: 472.80 📊 Timeframe: 15m ⚖️ Risk/Reward Ratio: — 💥 Suggested Leverage: 5× – 10× --- 🧠 Technical Analysis Summary ZEC is showing increasing bearish pressure after a clear rejection from the 464–472 supply zone. The 15m market structure has shifted downward, forming lower highs and breaking key intraday support at 451.50. Liquidity pockets below the current price align perfectly with our downside target levels: 446.88 → first liquidity sweep 439.40 → continuation zone 430.54 → deeper liquidity 419.74 → final bearish target A break below 450.00 will likely accelerate bearish momentum toward TP2 and TP3 zones. --- ⚙️ Trade Management Rules ✔ Take partial profit at TP1 ✔ Move SL to Break-Even after TP1 ✔ Trail SL as price moves toward deeper targets ✔ No re-entry if SL is hit ✔ Confirm bearish structure before entering --- 📌 TradingView Hashtags #ZECUSDT #ZEC #CryptoSignal #ShortSetup #FuturesTrading #TradingView #CryptoAnalysis
mastercrypto2020
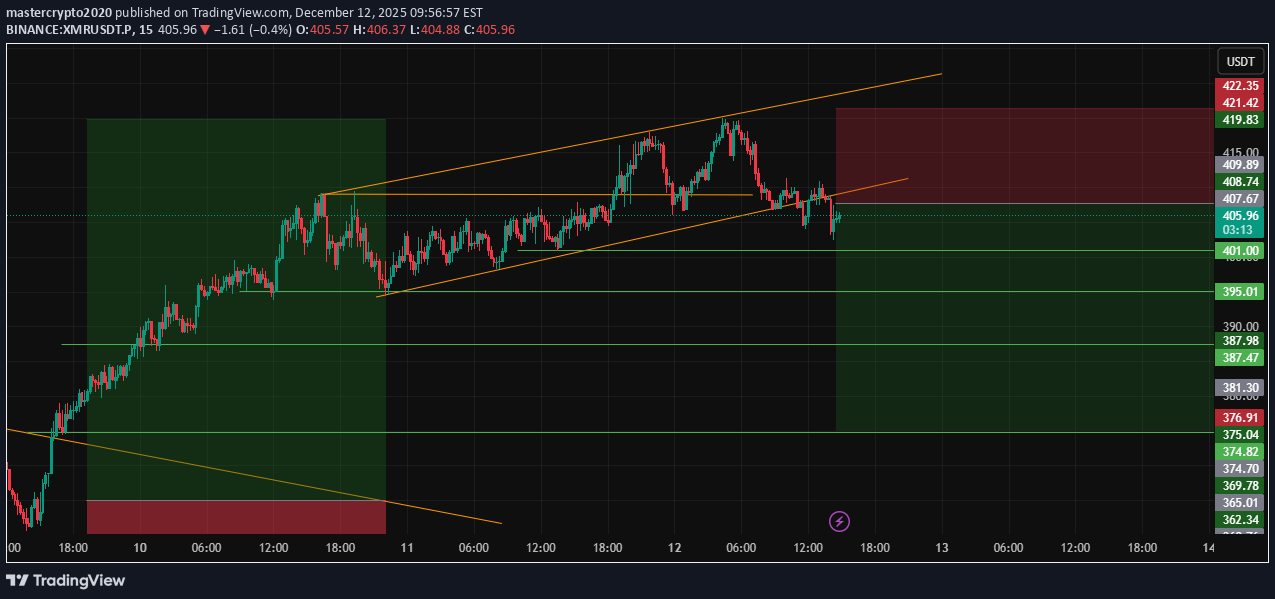
--- 📢 Official Trade Signal – XMR/USDT 📉 Position Type: SHORT 💰 Entry Price: 407.66 --- 🎯 Take-Profit Targets (Partial Exits) • TP1: 401 • TP2: 395 • TP3: 387.98 • TP4: 375.05 • TP5: — • TP6: — --- 🛑 Stop-Loss: 421.65 📊 Timeframe: 15m ⚖️ Risk/Reward Ratio: 5.9 💥 Suggested Leverage: 5× – 10× --- 🧠 Technical Analysis Summary XMR is currently displaying strong bearish momentum after rejecting the 410–420 supply zone. Structure on the 15m chart is clearly shifting downward, forming lower highs and lower lows. The downside liquidity map aligns cleanly with our TP targets: 401 → First liquidity pocket 395 → Deep imbalance zone 387.98 → Major liquidity pool 375.05 → Final demand zone target A confirmed break below 401 is expected to accelerate the bearish continuation toward lower liquidity zones. --- ⚙️ Trade Management Rules ✔ Take partial profit at TP1 ✔ Move SL → Break-Even after TP1 ✔ Trail the stop as price reaches deeper targets ✔ Avoid re-entry if SL is hit ✔ Enter only with clear bearish confirmation --- 📌 TradingView Hashtags #XMRUSDT #XMR #CryptoSignal #ShortSetup #TradingView #FuturesTrading #CryptoAnalysis ---
mastercrypto2020
LINK USDT LONG SIGNAL
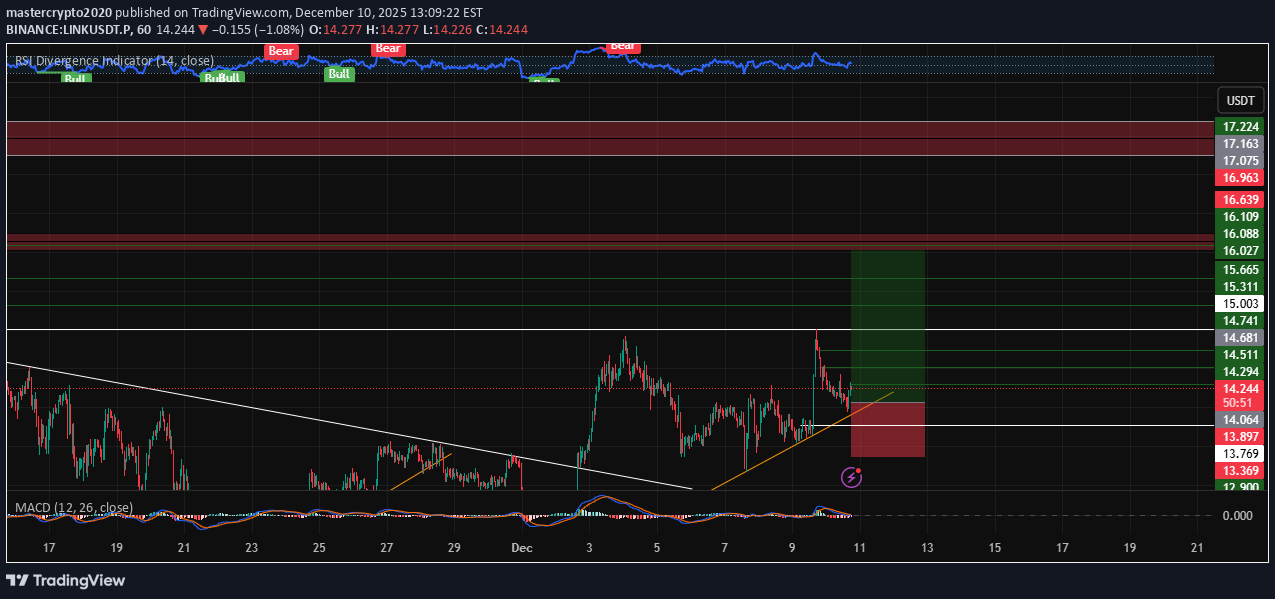
--- 📢 Official Trade Signal – LINK/USDT 📈 Position Type: LONG 💰 Entry Price: 14.064 Entry price=2 13.756 --- 🎯 Take-Profit Targets (Partial Exits): • TP1: 14.294 • TP2: 14.515 • TP3: 14.740 • TP4: 14.976 • TP5: 15.316 • TP6: 15.660 --- 🛑 Stop-Loss: 13.355 📊 Timeframe: 15m ⚖️ Risk/Reward Ratio: ≈ 2.03 (based on TP6) 💥 Suggested Leverage: 5× – 10× --- 🧠 Technical Analysis Summary LINK is showing signs of bullish momentum after holding above the key support level around 14.064. The market structure on the 15-minute chart suggests a potential upward move, with higher lows forming and price testing immediate resistance zones. The take-profit levels are aligned with previous swing highs and liquidity concentrations on the higher timeframes. The critical upside targets are: 14.294 → 14.515 → 14.740 → 14.976 → 15.316 → 15.660 A confirmed break above TP1 (14.294) may accelerate momentum toward the subsequent targets, especially if supported by increasing volume and bullish market sentiment. --- ⚙️ Trade Management Rules ✔ Take partial profit at each TP level ✔ Move stop-loss to entry point once TP1 is reached ✔ Trail stop-loss upward as price advances ✔ No re-entry if stop-loss (13.872) is triggered ✔ Confirm bullish structure and momentum before entering --- 📌 TradingView Hashtags #LINKUSDT #LINK #CryptoSignal #LongSetup #TradingView #FuturesTrading #TechnicalAnalysis --- Disclaimer: Always practice proper risk management and verify market conditions before entering any trade.
mastercrypto2020
ICP USDT LONG SIGNAL
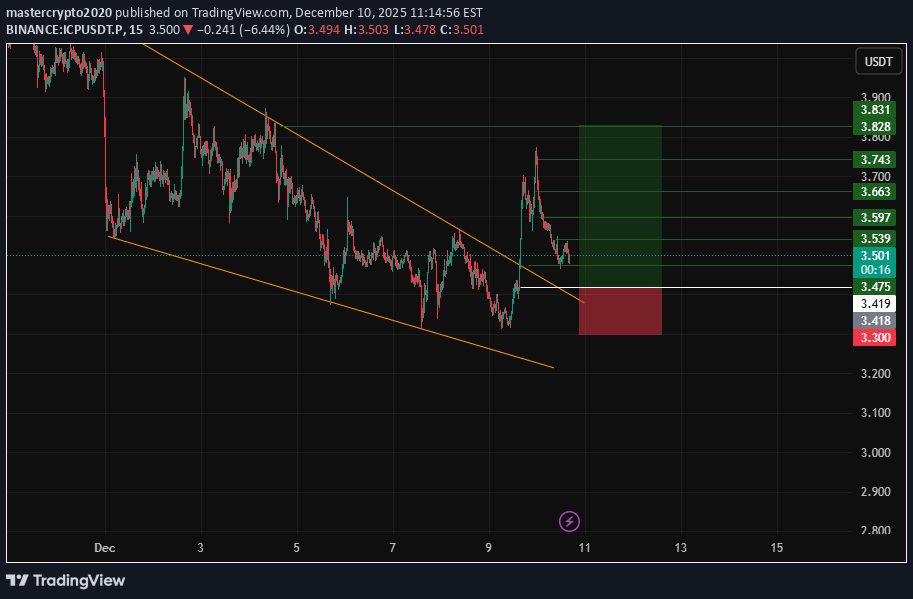
--- 📢 Official Trade Signal – ICP/USDT 📈 Position Type: LONG 💰 Entry Price: 3.419 --- 🎯 Take-Profit Targets (Partial Exits): • TP1: 3.472 • TP2: 3.541 • TP3: 3.596 • TP4: 3.660 • TP5: 3.743 • TP6: —3.828 --- 🛑 Stop-Loss: 3.300 📊 Timeframe: 15m ⚖️ Risk/Reward Ratio: ≈ 2.03 (based on TP4) 💥 Suggested Leverage: 5× – 10× --- 🧠 Technical Analysis Summary ICP is showing signs of bullish momentum after finding support near the 3.419 level. The market structure on the 15-minute chart indicates a potential upward shift, with price action forming higher lows and testing key resistance zones. The identified take-profit levels align with previous swing highs and liquidity concentrations. The critical upside targets are: 3.472 → 3.541 → 3.596 → 3.660 A confirmed break above TP1 (3.472) is expected to accelerate momentum toward the subsequent targets, particularly if accompanied by increasing buying volume. --- ⚙️ Trade Management Rules ✔ Take partial profit at each TP level ✔ Move stop-loss to entry point once TP1 is reached ✔ Trail stop-loss upward as price advances ✔ No re-entry if stop-loss (3.300) is triggered ✔ Confirm bullish structure and momentum before entering --- 📌 TradingView Hashtags #ICPUSDT #ICP #CryptoSignal #LongSetup #TradingView #FuturesTrading #TechnicalAnalysis --- Disclaimer: Always practice proper risk management and verify market conditions before entering any trade.
mastercrypto2020
ENA USDT LONG SIGNAL
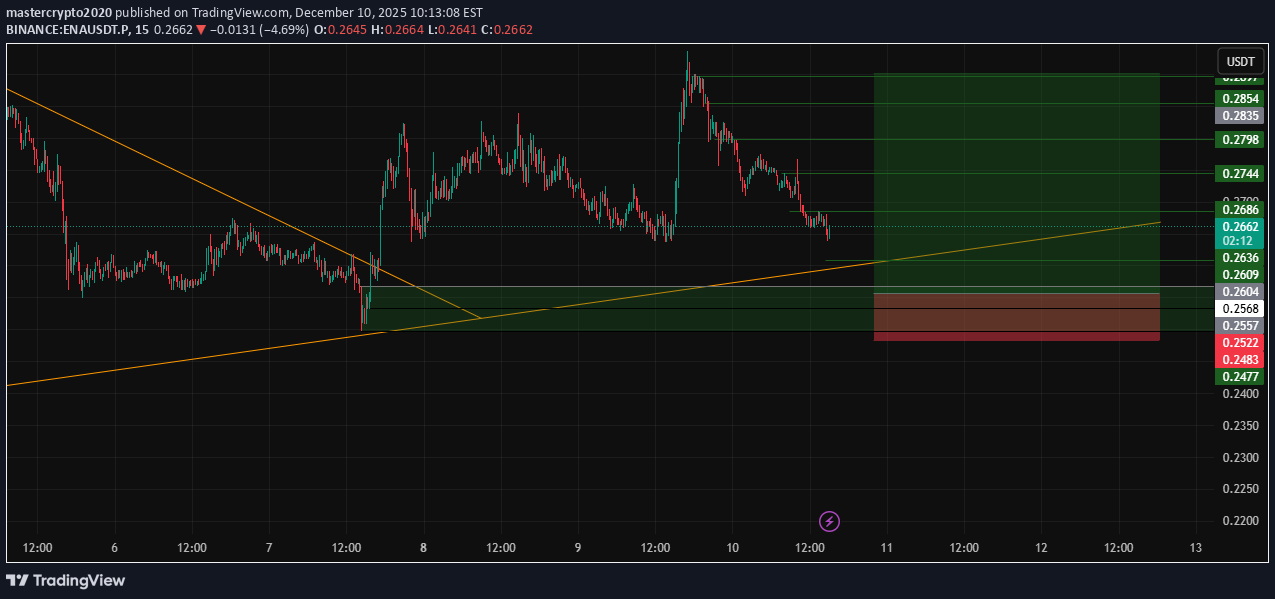
--- 📢 Official Trade Signal – ENA/USDT 📈 Position Type: LONG 💰 Entry Price: 0.2559 --- 🎯 Take-Profit Targets (Partial Exits): • TP1: 0.2605 • TP2: 0.2686 • TP3: 0.2744 • TP4: 0.2798 --- 🛑 Stop-Loss: 0.2482 📊 Timeframe: 15m ⚖️ Risk/Reward Ratio: ≈ 3.17 (based on TP4) 💥 Suggested Leverage: 5× – 10× --- 🧠 Technical Analysis Summary ENA/USDT is showing signs of bullish momentum, with price action holding above a critical support zone. The market structure on the 15-minute chart suggests a potential upward shift, supported by increasing buying pressure near the entry level. The take-profit targets are aligned with key resistance zones where liquidity is likely concentrated. The primary upside targets are sequenced as follows: 0.2605 → 0.2686 → 0.2744 → 0.2798 A confirmed move above TP1 (0.2605) could accelerate bullish momentum toward the higher targets, especially if supported by rising volume. --- ⚙️ Trade Management Rules ✔ Take partial profit at each TP level ✔ Move stop-loss to entry (break-even) once TP1 is reached ✔ Trail stop-loss upward as price advances toward higher targets ✔ No re-entry if stop-loss (0.2482) is triggered ✔ Confirm bullish structure and volume support before entering --- 📌 TradingView Hashtags #ENAUSDT #ENA #CryptoSignal #LongTrade #TradingView #FuturesTrading #TechnicalAnalysis --- Reminder: Use proper risk management. Adjust position size according to your risk tolerance, especially when using leverage.
mastercrypto2020
ZEC USDT SHORT SIGNAL
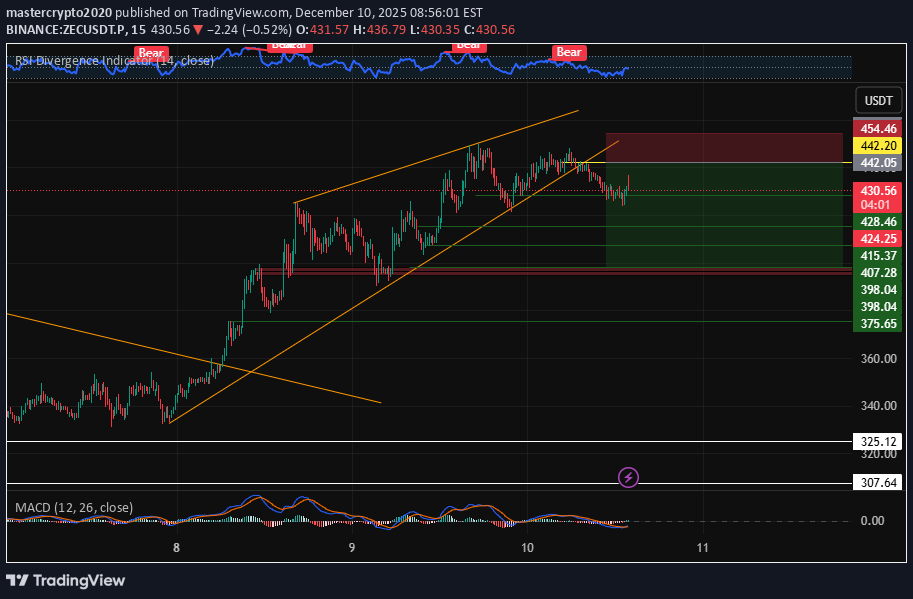
--- 📢 Official Trade Signal – ZEC/USDT 📉 Position Type: SHORT 💰 Entry Price: 442.33 --- 🎯 Take-Profit Targets (Partial Exits): • TP1: 428.46 • TP2: 415.37 • TP3: 407.28 • TP4: 398.00 --- 🛑 Stop-Loss: 454.46 📊 Timeframe: 15m ⚖️ Risk/Reward Ratio: ≈ 3.65 (based on TP4) 💥 Suggested Leverage: 5× – 10× --- 🧠 Technical Analysis Summary ZEC is exhibiting bearish momentum following a rejection from a key resistance area. The market structure on the 15-minute chart suggests a shift downward, with lower highs indicating increasing selling pressure. The identified take-profit levels align with projected liquidity zones and previous support areas. The critical downside targets are: 428.46 → 415.37 → 407.28 → 398.00 A sustained break below TP1 (428.46) is expected to accelerate the move toward the subsequent targets. --- ⚙️ Trade Management Rules ✔ Take partial profits at each TP level ✔ Move stop-loss to entry point once TP1 is hit ✔ Trail stop-loss downward as price moves in your favor ✔ Do not re-enter if stop-loss (454.46) is triggered ✔ Confirm bearish structure on the chart before entering --- 📌 TradingView Hashtags #ZECUSDT #ZEC #CryptoSignal #ShortTrade #TradingView #FuturesTrading #TechnicalAnalysis --- Let me know if you need any adjustments or a Persian version.
mastercrypto2020
DOT USDT LONG SIGNAL
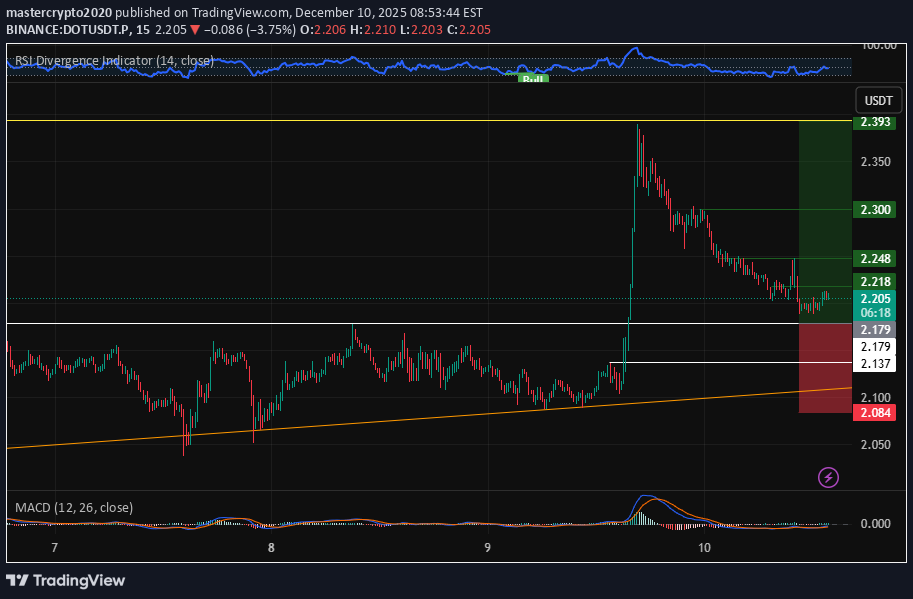
--- 📢 Official Trade Signal – DOT/USDT 📈 Position Type: LONG 💰 Entry Price: 2.179 (Limit Order) --- 🎯 Take-Profit Targets (Partial Exits): • TP1: 2.218 • TP2: 2.248 • TP3: 2.300 • TP4: 2.393 • TP5: — --- 🛑 Stop-Loss: 2.084 📊 Timeframe: 15m ⚖️ Risk/Reward Ratio: ≈ 2.25 (based on TP4) 💥 Suggested Leverage: 3× – 5× --- 🧠 Technical Analysis Summary DOT shows potential bullish momentum after stabilizing near a key support zone around 2.179. A successful break above immediate resistance could trigger a move toward higher timeframe liquidity areas. The 15m chart structure suggests a possible shift upward, with clear targets aligned with previous swing highs and orderbook liquidity levels. Critical upside targets: 2.218 → 2.248 → 2.300 → 2.393 A sustained move above TP1 (2.218) may accelerate momentum toward 2.300 and 2.393. --- ⚙️ Trade Management Rules ✔ Take partial profit at each TP level ✔ Move stop-loss to entry point once TP1 is reached ✔ Trail stop-loss as price progresses toward higher targets ✔ No re-entry if stop-loss (2.084) is triggered ✔ Confirm bullish structure on 15m chart before entering --- 📌 TradingView Hashtags #DOTUSDT #DOT #CryptoSignal #LongTrade #TradingView #FuturesTrading #TechnicalAnalysis --- Let me know if you would like this translated to Persian or adjusted in any way.
mastercrypto2020
APT USDT LONG SIGNAL
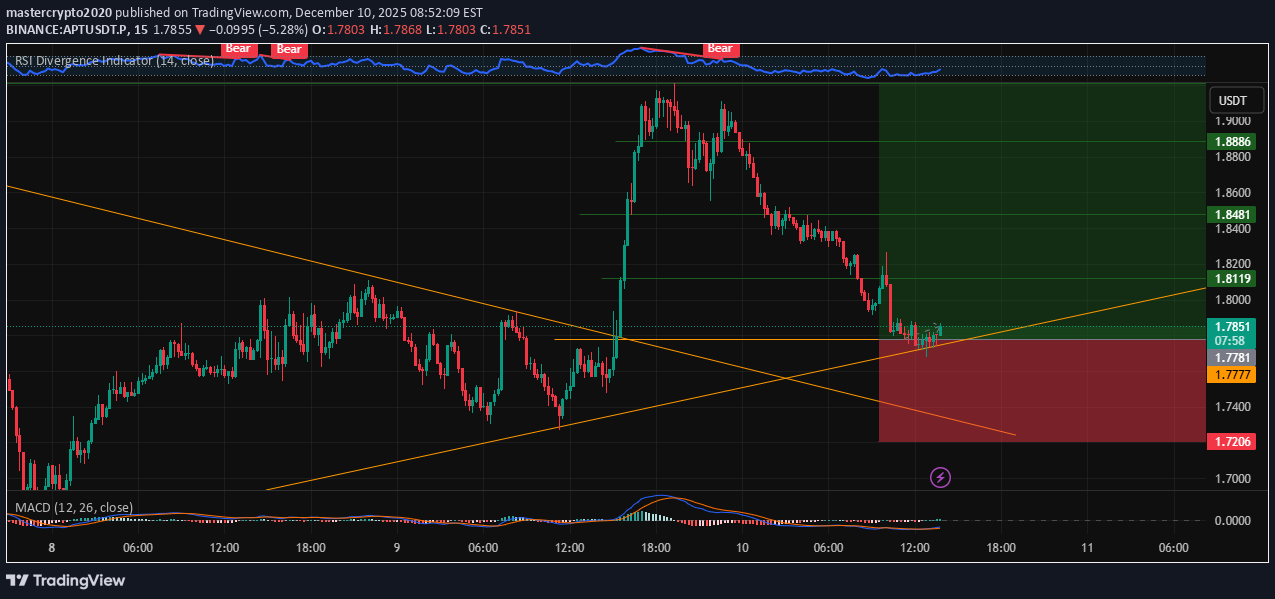
--- 📢 Official Trade Signal – APT/USDT 📈 Position Type: LONG 💰 Entry Price: 1.7780 --- 🎯 Take-Profit Targets (Partial Exits): • TP1: 1.8100 • TP2: 1.8480 • TP3: 1.8880 • TP4: 1.9214 • TP5: 1.9532 • TP6: 2.0000 --- 🛑 Stop-Loss: 1.7200 📊 Timeframe: 15m ⚖️ Risk/Reward Ratio: ≈ 2.34 (based on TP6) 💥 Suggested Leverage: 5× – 10× --- 🧠 Technical Analysis Summary APT is showing signs of bullish momentum after holding above a key support area near 1.7750. The 15m chart suggests a potential upward shift if price breaks above immediate resistance around 1.8100. Higher lows and increasing buy pressure could propel APT toward the identified liquidity zones above. The key upside targets are structured as follows: 1.8100 → 1.8480 → 1.8880 → 1.9214 → 1.9532 → 2.0000 A confirmed break above TP1 (1.8100) may accelerate upward movement toward 1.8880 and beyond. --- ⚙️ Trade Management Rules ✔ Take partial profit at each TP level ✔ Move SL to entry once TP1 is reached ✔ Trail stop-loss upward as price advances ✔ Do not re-enter if SL (1.7200) is triggered ✔ Confirm bullish structure on 15m chart before entering --- 📌 TradingView Hashtags #APTUSDT #APT #CryptoSignal #LongTrade #TradingView #FuturesTrading #TechnicalAnalysis --- Let me know if you'd like this adjusted for a different style or translated into Persian.
Disclaimer
Any content and materials included in Finbeet's website and official communication channels are a compilation of personal opinions and analyses and are not binding. They do not constitute any recommendation for buying, selling, entering or exiting the stock market and cryptocurrency market. Also, all news and analyses included in the website and channels are merely republished information from official and unofficial domestic and foreign sources, and it is obvious that users of the said content are responsible for following up and ensuring the authenticity and accuracy of the materials. Therefore, while disclaiming responsibility, it is declared that the responsibility for any decision-making, action, and potential profit and loss in the capital market and cryptocurrency market lies with the trader.