
melikatrader94
@t_melikatrader94

What symbols does the trader recommend buying?
Purchase History
Trader Messages
Filter
Message Type
melikatrader94
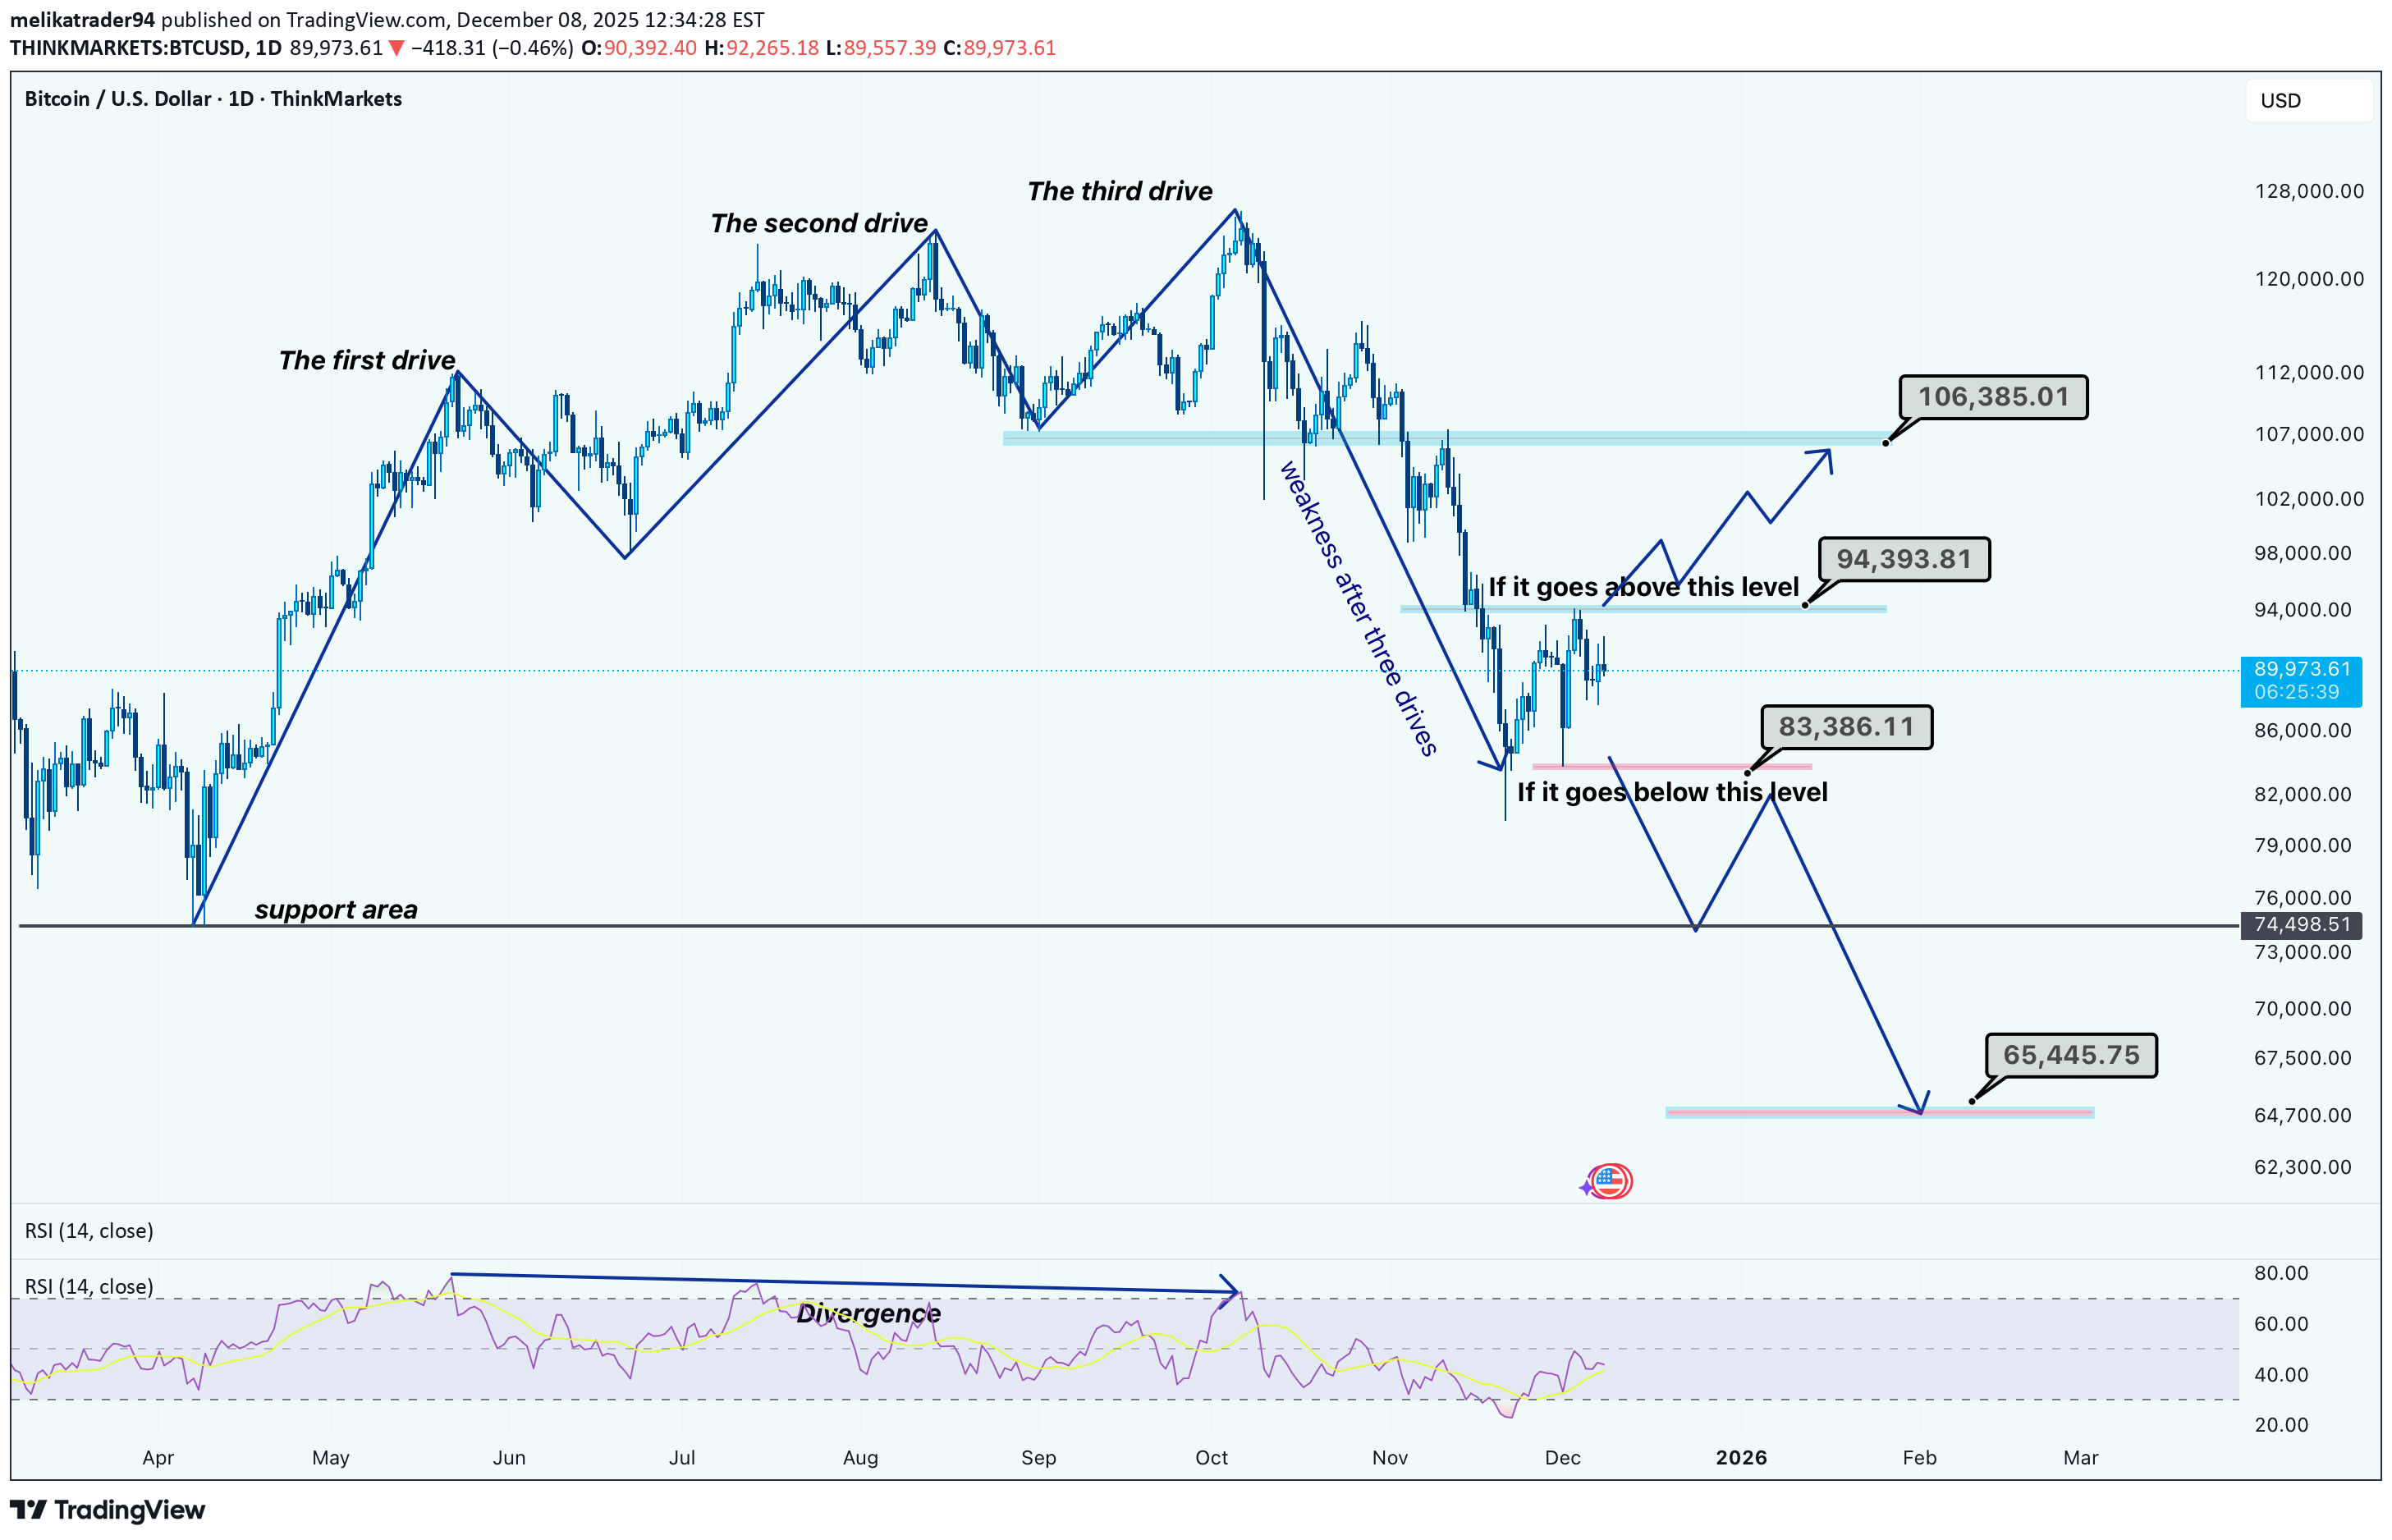
Hi guys! The current BTC structure displays a textbook Three Drives Pattern, followed by visible momentum weakness. After the first, second, and third drives completed, price failed to create higher highs, confirming exhaustion. This aligns with the RSI divergence, which began forming during the second and third drives. Price has now pulled back into a key decision zone. Two scenarios stand out: Bullish Scenario If BTC breaks and sustains above 94,393 USD, it would signal renewed strength. This could trigger a continuation toward the upper supply zone around 105,000–110,000 USD, where previous rejection occurred. Bearish Scenario Failure to break higher and instead falling below 82,000–83,000 USD opens the path toward deeper retracement. A breakdown confirms the distribution phase after the three drives, exposing the broader support area near 74,500 USD and potentially down to 65,445 USD, which aligns with historical demand. Disclaimer: As part of ThinkMarkets’ Influencer Program, I am sponsored to share and publish their charts in my analysis.
melikatrader94
LUNC Showing Classic Three-Drive Structure
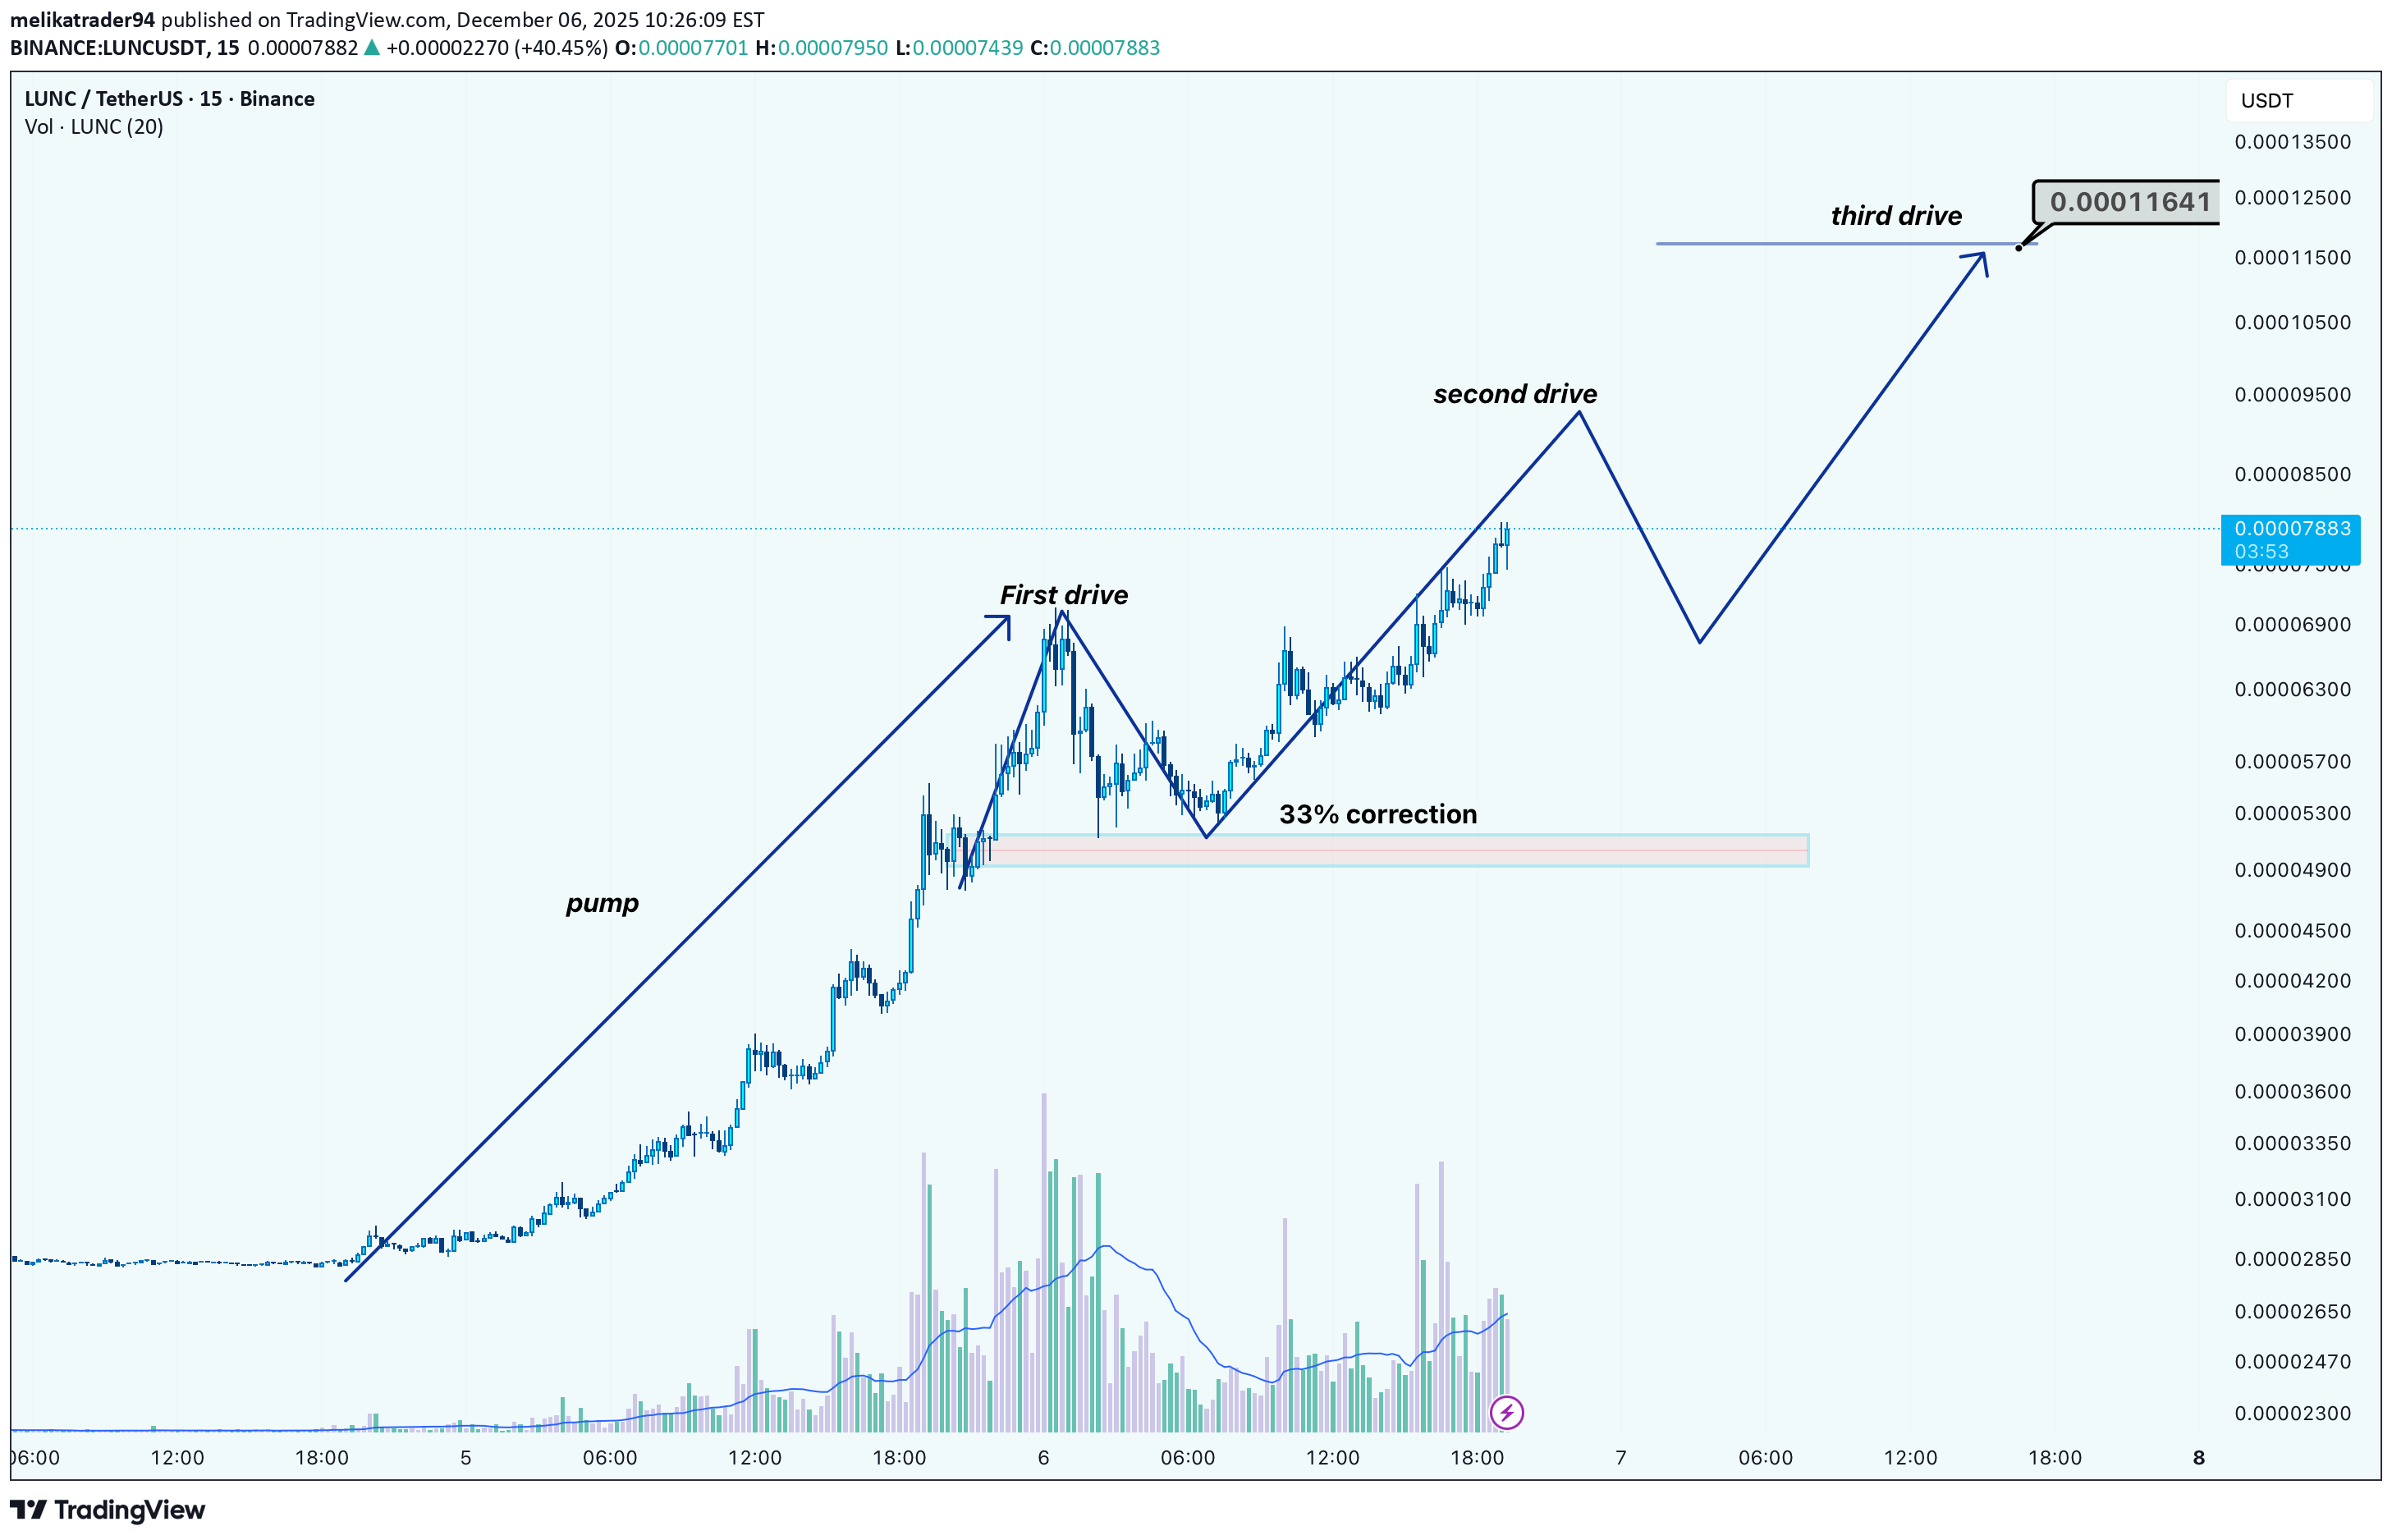
Hi! The chart illustrates a strong pump followed by what looks like a developing three-drive pattern. After the first drive, price pulled back roughly 33%, forming a solid base before climbing into the second drive. Momentum is still bullish, but a deeper retracement may occur before the projected third drive toward the 0.000116 area. As long as corrections stay controlled and volume supports the trend, the overall structure suggests continued upside potential.
melikatrader94
Bitcoin (BTCUSDT) – Intraday Trend & Pattern Analysis

Hi! Bitcoin continues to trade within a broader ascending structure, supported by an established rising trendline that has guided price higher over the past weeks. After forming a double bottom near the lower boundary of this channel, BTC initiated a strong rally toward the major resistance zone around 95,000 USDT, where a clear head-and-shoulders reversal pattern appeared. The neckline later broke, and its measured target has already been fully achieved, confirming the pattern’s validity. Following the completion of this decline, the price stabilized inside the previous consolidation zone and began forming a triangle pattern, signaling compression and potential trend continuation. BTC is now testing the upper boundary of this triangle. A confirmed breakout above the pattern could trigger a bullish continuation toward 90,500–91,200 USDT, aligning with the dashed trendline and short-term resistance levels. Failure to break upward may lead to a retest of the triangle’s lower boundary or even the broader demand area around 88,000–88,500 USDT, which previously acted as a reaction zone. Overall, as long as the price remains above the ascending channel’s main support, the medium-term structure favors buyers. A breakout from the triangle will be the key signal for renewed bullish momentum.
melikatrader94
SOLUSD: Breakout from Bottom Structure Inside Downtrend Channel

Hi! SOL has been trading inside a descending channel, consistently respecting both upper and lower boundaries. Recently, price formed a clear Inverse Head & Shoulders at the bottom of the channel, signaling potential bullish reversal momentum. The neckline breakout aligns with the break of the minor descending trendline, strengthening the shift in structure. If price holds above the neckline, the pattern projects a move toward the 160–165 USD zone, which also aligns with the channel’s upper boundary, a strong confluence area and natural target for bulls. However, failure to sustain above the neckline could lead to a pullback toward the right-shoulder region, though the setup remains valid as long as price stays above the head level. Overall, SOL is showing a bullish reversal signal, with upside continuation favored while above the breakout zone.
melikatrader94
BTC (bitcoin) Double-Bottom Reversal Testing Key Resistance

Hi! The chart shows Bitcoin forming a clear double-bottom pattern, supported by bullish RSI divergence on the lower panel. This combination often signals exhaustion of downward momentum and a potential trend reversal. The price has rallied strongly from the second bottom and is now pressing directly into the neckline zone, which aligns with a broader descending trendline drawn from previous swing highs. This overlap creates a high-confluence resistance area. The current reaction here is critical: if price decisively breaks above the neckline and closes above the descending trendline, it would confirm the reversal structure and open the path toward the next major liquidity pocket around the 100k–104k region, marked on your chart as the target. This region matches previous consolidation and supply, making it a realistic upside magnet if breakout momentum is strong. However, without a confirmed breakout, the neckline remains a potential rejection level, and price could retest the mid-range or even revisit trendline support. Bulls need continuation volume above resistance to flip the zone into support. Overall, market structure has shifted from aggressive selling to a constructive bottoming phase. The key now is whether bulls can convert this pattern into a sustained trend reversal.
melikatrader94
BTC: Bearish Continuation Setup After Major Channel Breakdown

Hi! Price broke hard below the long-term ascending channel, confirming a clear shift from bullish to bearish momentum. After the breakdown, BTC is moving in a small descending correction channel, creating a classic lower-high retracement toward supply. Direction: Short Entry Area: 87,200 – 88,300 (two stacked red zones) Stop-Loss: Above 88,700–89,000 (top of supply) Target: 83,000 – 84,800 (large green demand area)our target was between 83,000 – 84,800 that reached
melikatrader94
Bitcoin Weakens After H&S Pattern: Next Stop, 89k?

Hi! It looks like price recently formed a pretty clean Head & Shoulders pattern on the 15m timeframe. The left shoulder, head, and right shoulder are all well-defined, and price has already broken beneath the neckline with a clear shift in structure. Momentum is leaning bearish. The chart also shows a large supply zone above (the red area), which rejected price strongly adding confluence that the top may be in for now. The projections on the chart make sense: if the neckline continues to hold as resistance, we could see a move down toward the blue demand zone around 88.7k–89k. That’s the next major liquidity pool and likely where buyers might step in again. Unless price reclaims the neckline with strength, the bias stays short-term bearish with continuation lower.
melikatrader94
BNB/USDT 1H Analysis
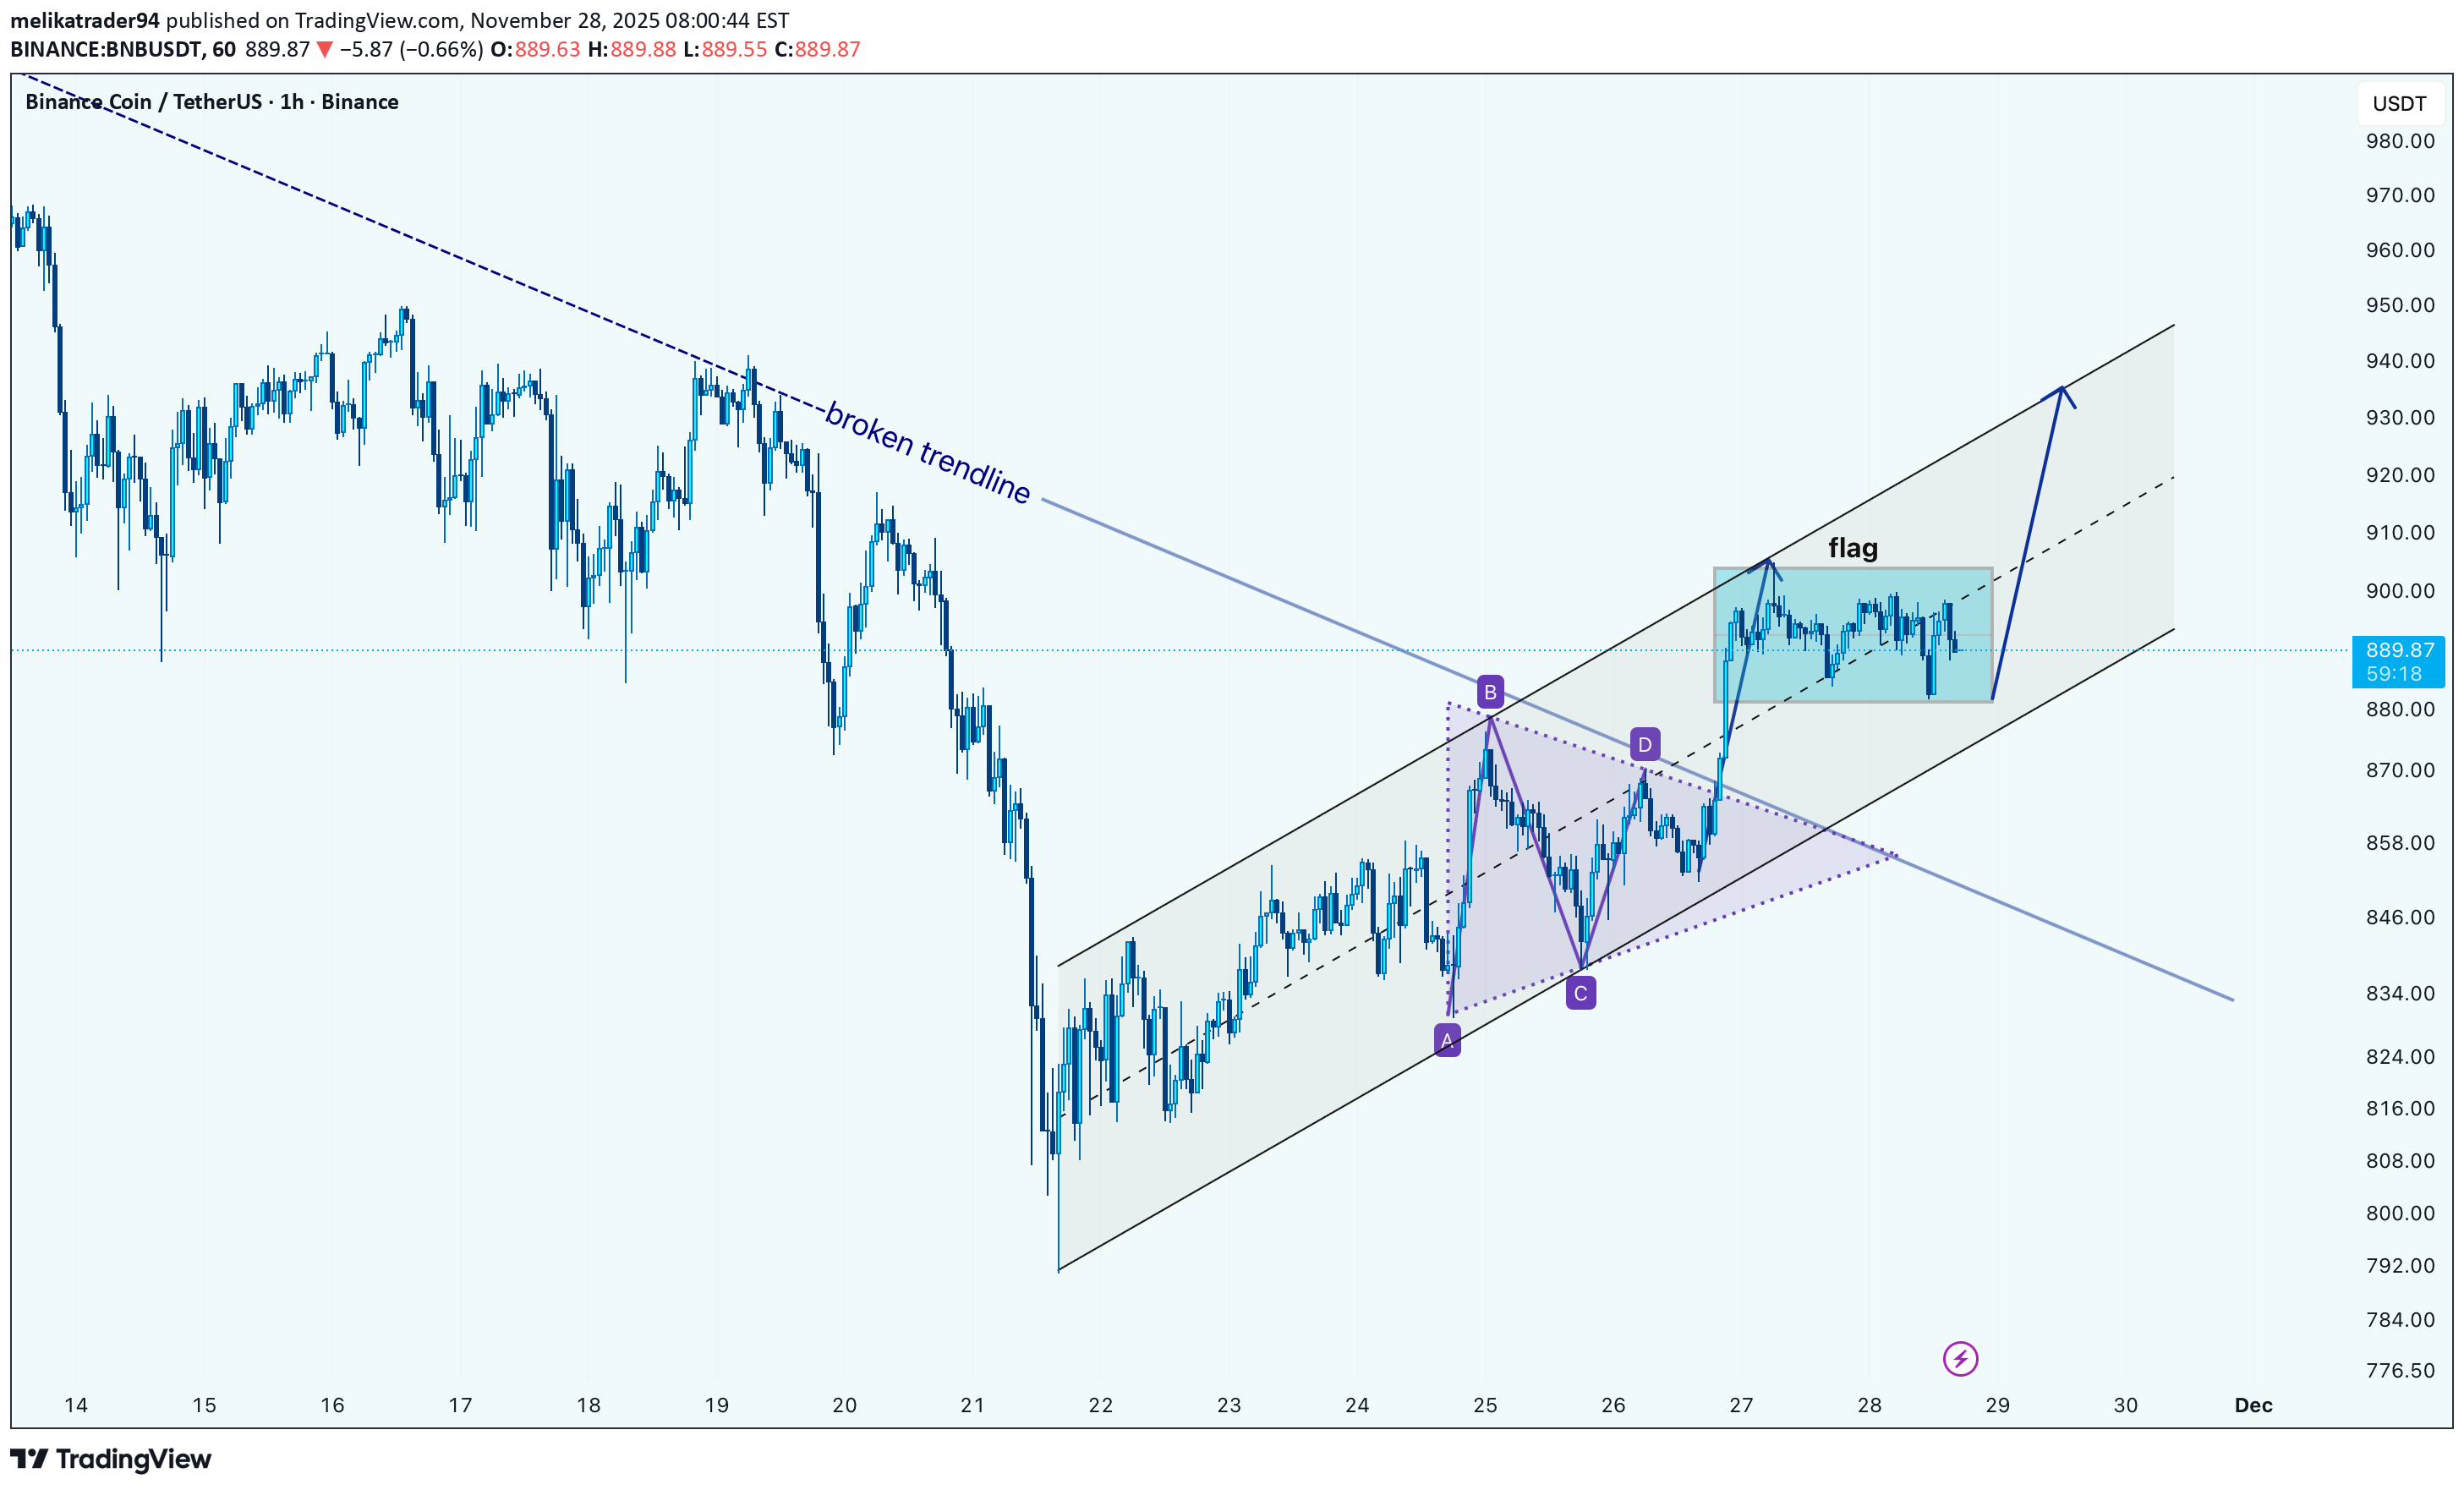
Hi After a prolonged downtrend, BNB has broken its descending trendline, signaling a shift from bearish to bullish momentum. The price formed a symmetrical triangle pattern, completing at point D, which coincides with the lower boundary of the rising channel. Since then, BNB has been trading inside a clearly defined ascending channel, respecting both support and resistance levels. Recently, a bullish flag has formed, representing a consolidation after a strong upward impulse. A breakout from this flag suggests continuation towards the upper channel boundary near $940–950. Support lies around $880, aligning with both the flag’s lower boundary and the channel’s midline.
melikatrader94
SOL Reversal Structure Forming Inside Downtrend Channel

Hi! Solana is trading inside a well-defined descending channel, but momentum is shifting. Price has broken the inner descending trendline and is now forming a clear inverse Head & Shoulders at the bottom of the structure. The neckline zone has been tested multiple times, showing growing buyer strength. As long as price holds above the right-shoulder support, the structure favors a bullish continuation. A breakout above the neckline opens the way toward the upper boundary of the main descending channel, with the next key reaction zone near $155–160. Failure to hold the right shoulder would delay the reversal and pull the price back toward mid-channel support.
melikatrader94
BTCUSDT (bitcoin) toward $91k?
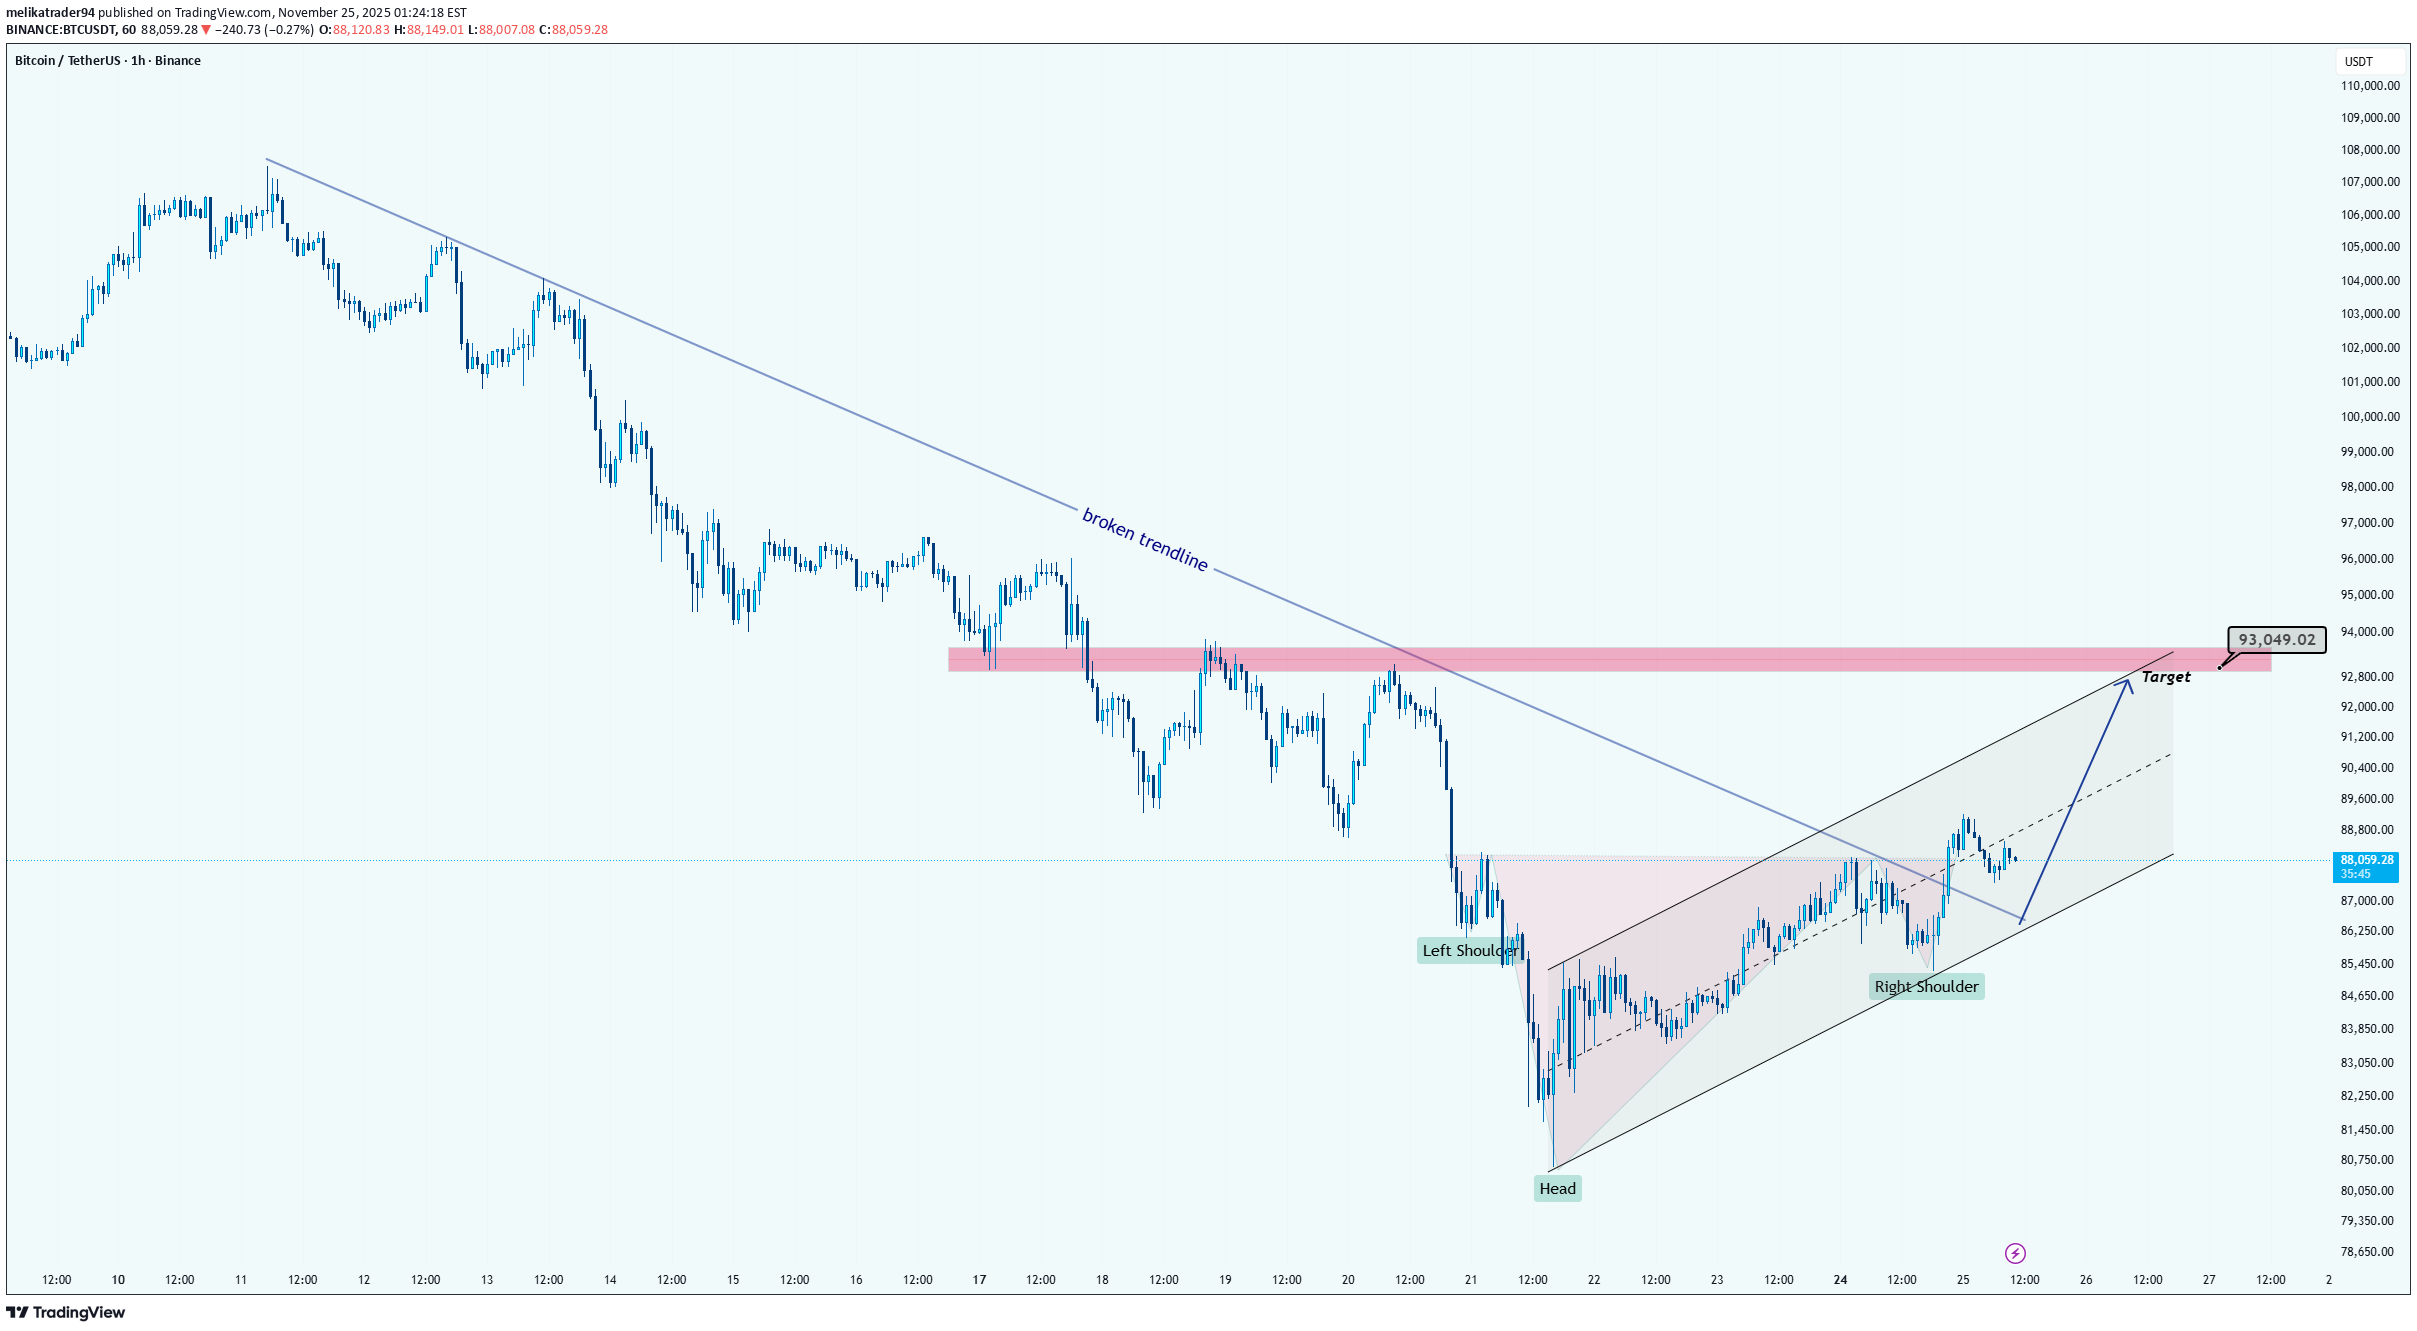
Hi! BTC has finally broken its major descending trendline, signaling a shift in market sentiment after a long period of selling pressure. Following that break, price formed a clear inverse head and shoulders pattern, showing that buyers stepped in aggressively after the final liquidity sweep at the Head. Since then, BTC has been moving inside a well-defined ascending channel, consistently printing higher highs and higher lows, which confirms bullish momentum. As long as price respects the lower boundary of this channel, the upside structure remains intact. The next significant resistance sits at 92,500–93,000, which also aligns with the previous breakdown zone you highlighted. This area is likely to attract sellers, making it a logical target for the current move. Overall, the chart supports continued upside toward 93K, unless price breaks below channel support, which would weaken the bullish reversal setup.close 80% of the position here:
Disclaimer
Any content and materials included in Finbeet's website and official communication channels are a compilation of personal opinions and analyses and are not binding. They do not constitute any recommendation for buying, selling, entering or exiting the stock market and cryptocurrency market. Also, all news and analyses included in the website and channels are merely republished information from official and unofficial domestic and foreign sources, and it is obvious that users of the said content are responsible for following up and ensuring the authenticity and accuracy of the materials. Therefore, while disclaiming responsibility, it is declared that the responsibility for any decision-making, action, and potential profit and loss in the capital market and cryptocurrency market lies with the trader.