
popularexperttrader57
@t_popularexperttrader57

What symbols does the trader recommend buying?
Purchase History
Trader Messages
Filter
Message Type
LONG on BTCUSD (Bitcoin) at 91,050 Targets: TP1: 91,800 TP2: 92,500 TP3: 93,000+ (running to 93k zone) Stop Loss: 90,000 (below the daily demand zone) Leverage: 10–20x (adjust to your risk) Reason: Strong bounce from the 4H + Daily order block, bullish structure still intact, volume increasing on the retest. Expecting continuation to the upside. NOT financial advice DYOR – Trade at your own risk – Only risk what you can afford to lose!#Bitcoin #BTC #BTCUSD #Crypto #Cryptocurrency #BitcoinTrading #TradingSignals #CryptoTrading #Bullish #Altseason #Binance #BybitWho’s buying the dip with me? Smash if you’re in! Drop your entry below Good luck legends, let’s eat!

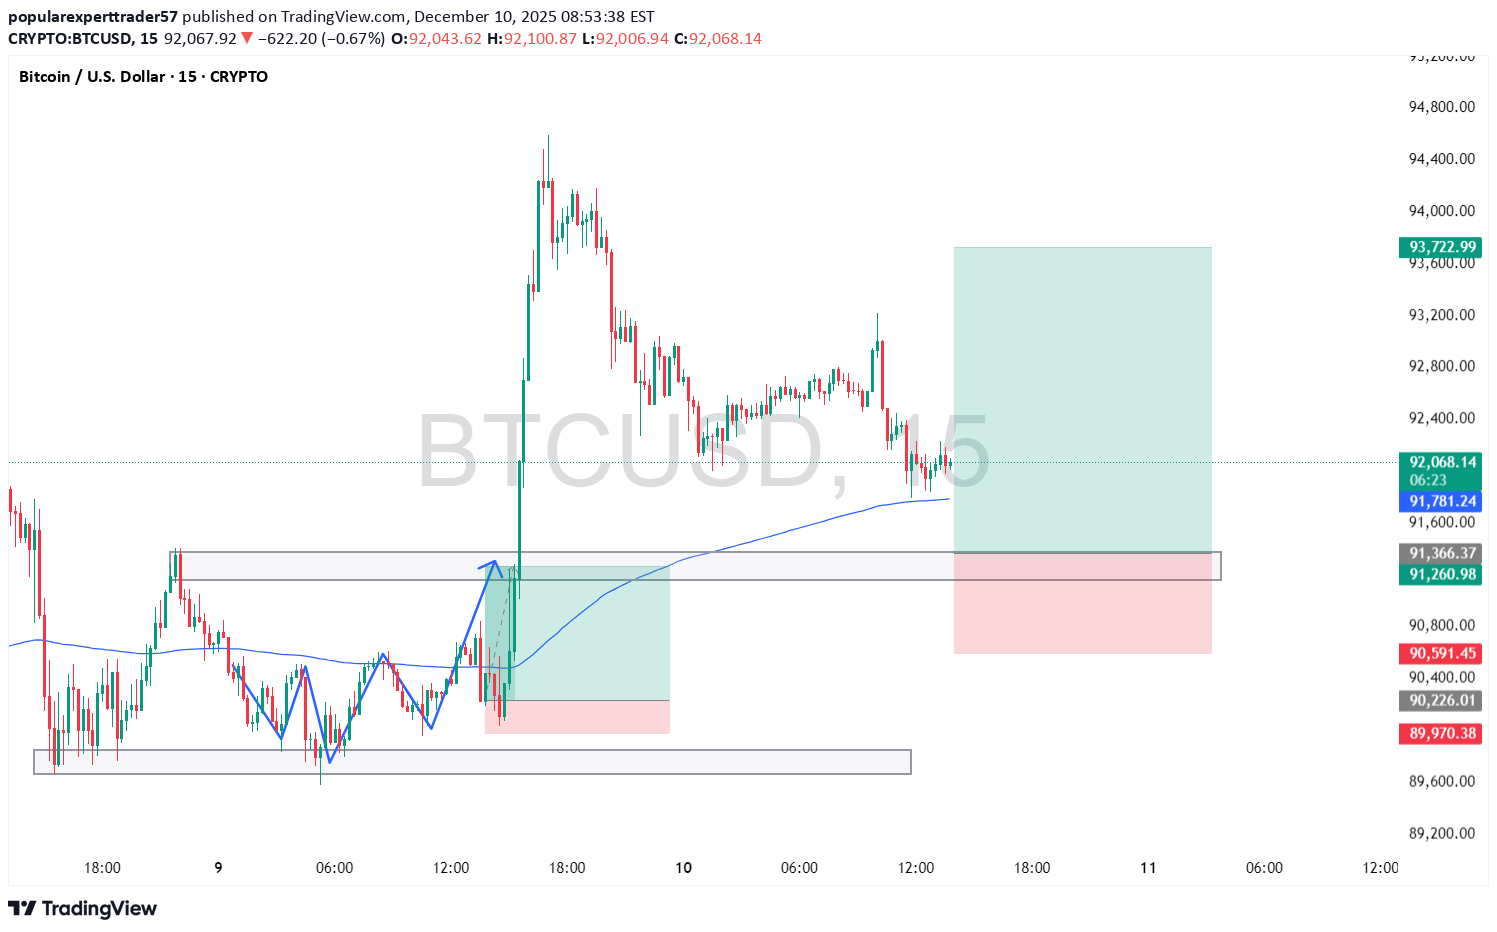
TP HIT perfectly on BTC! From our entry zone ~90,260 → Target smashed at 94,168 That’s +3,908 pips ($3,908 move) in the bag! Clean break & retest of the range high, liquidity sweep below, then straight to the moon as planned. Textbook. Pure price action, no BS indicators. #Bitcoin #BTC #Crypto #Trading #PriceAction Not financial advice, trade at your own risk. DYOR. See you at the next setup! Still miss my signals??? My channel is totally free also attached in the profile.
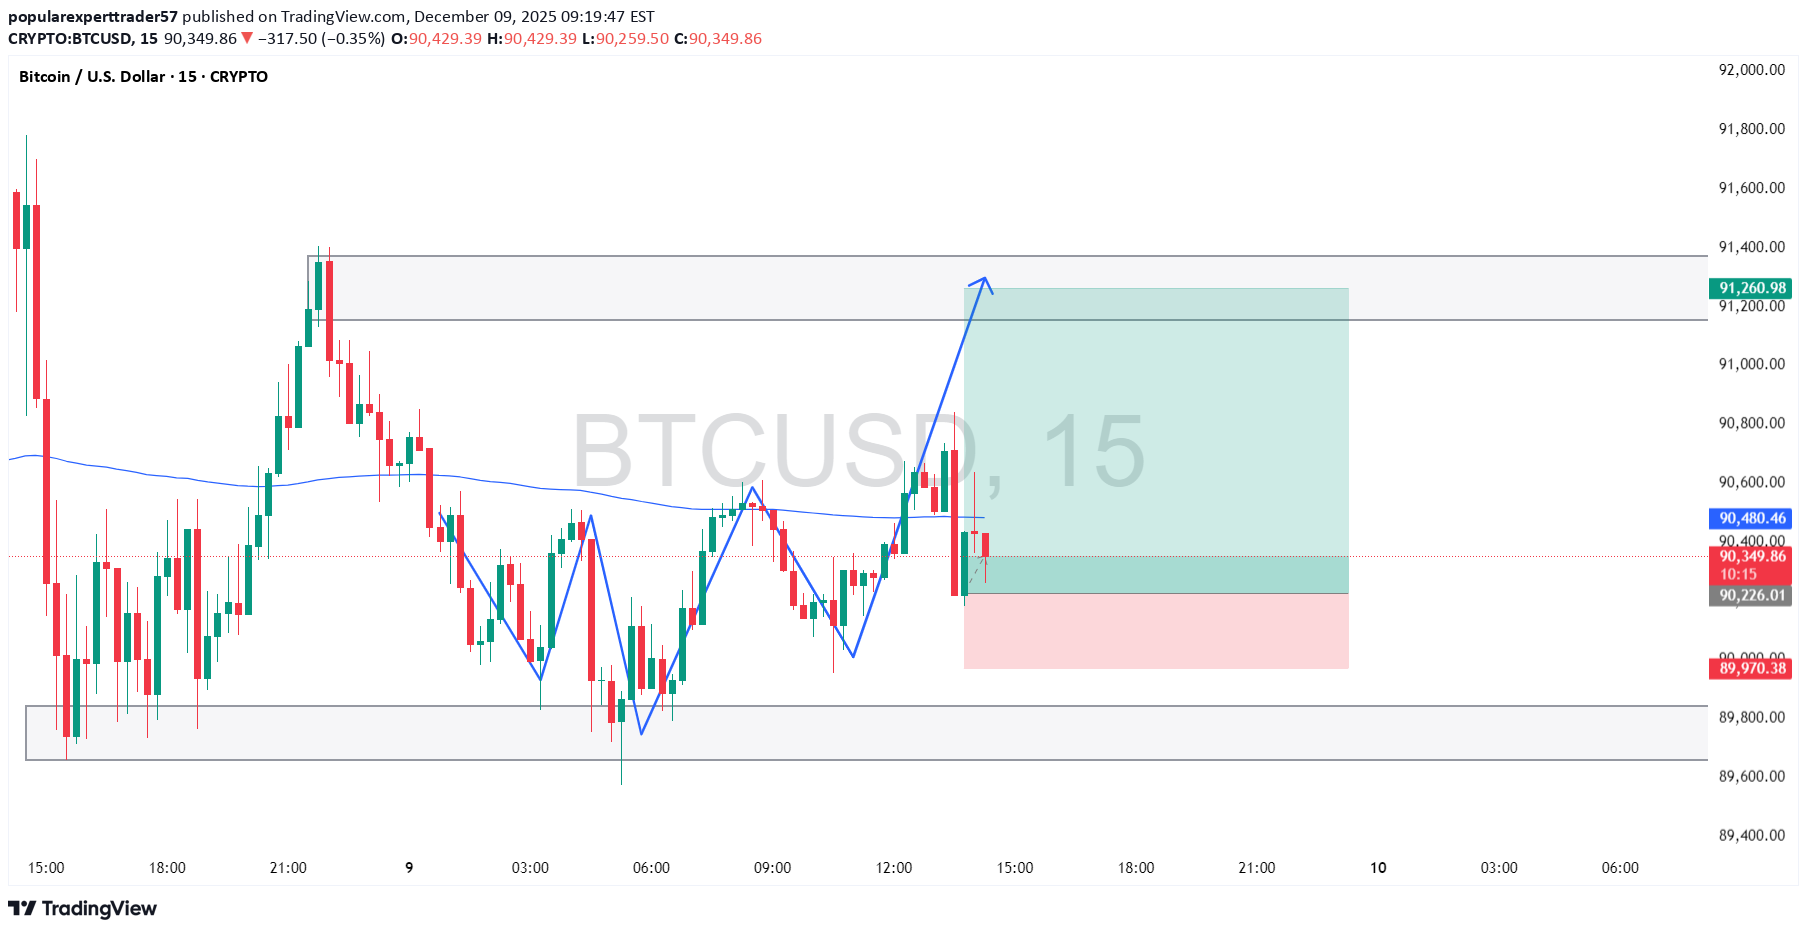
BTC/USD 15m – Live Long Signal (Dec 09, 2025)Buying the dip right here at ~$90,480–$90,550 zone Perfect higher low formed Strong bounce + bullish engulfing off the $90k–$90.2k demand Clean retest of breakout level → now flipping to support Entry: 90,480–90,550 Stop Loss: Below 89,900 (risk ~600–650 points) Take Profit 1: 91,200 Take Profit 2: 91,800+ R:R = 1:2.5 – 1:4 Bias: Bullish while above $90k#Bitcoin #BTC #Crypto #BTCUSD #BitcoinLong #BTCLongSignal #CryptoTrading #BreakoutPlay Not financial advice – This is my personal trade setup. Trade at your own risk, use proper risk management, DYOR!
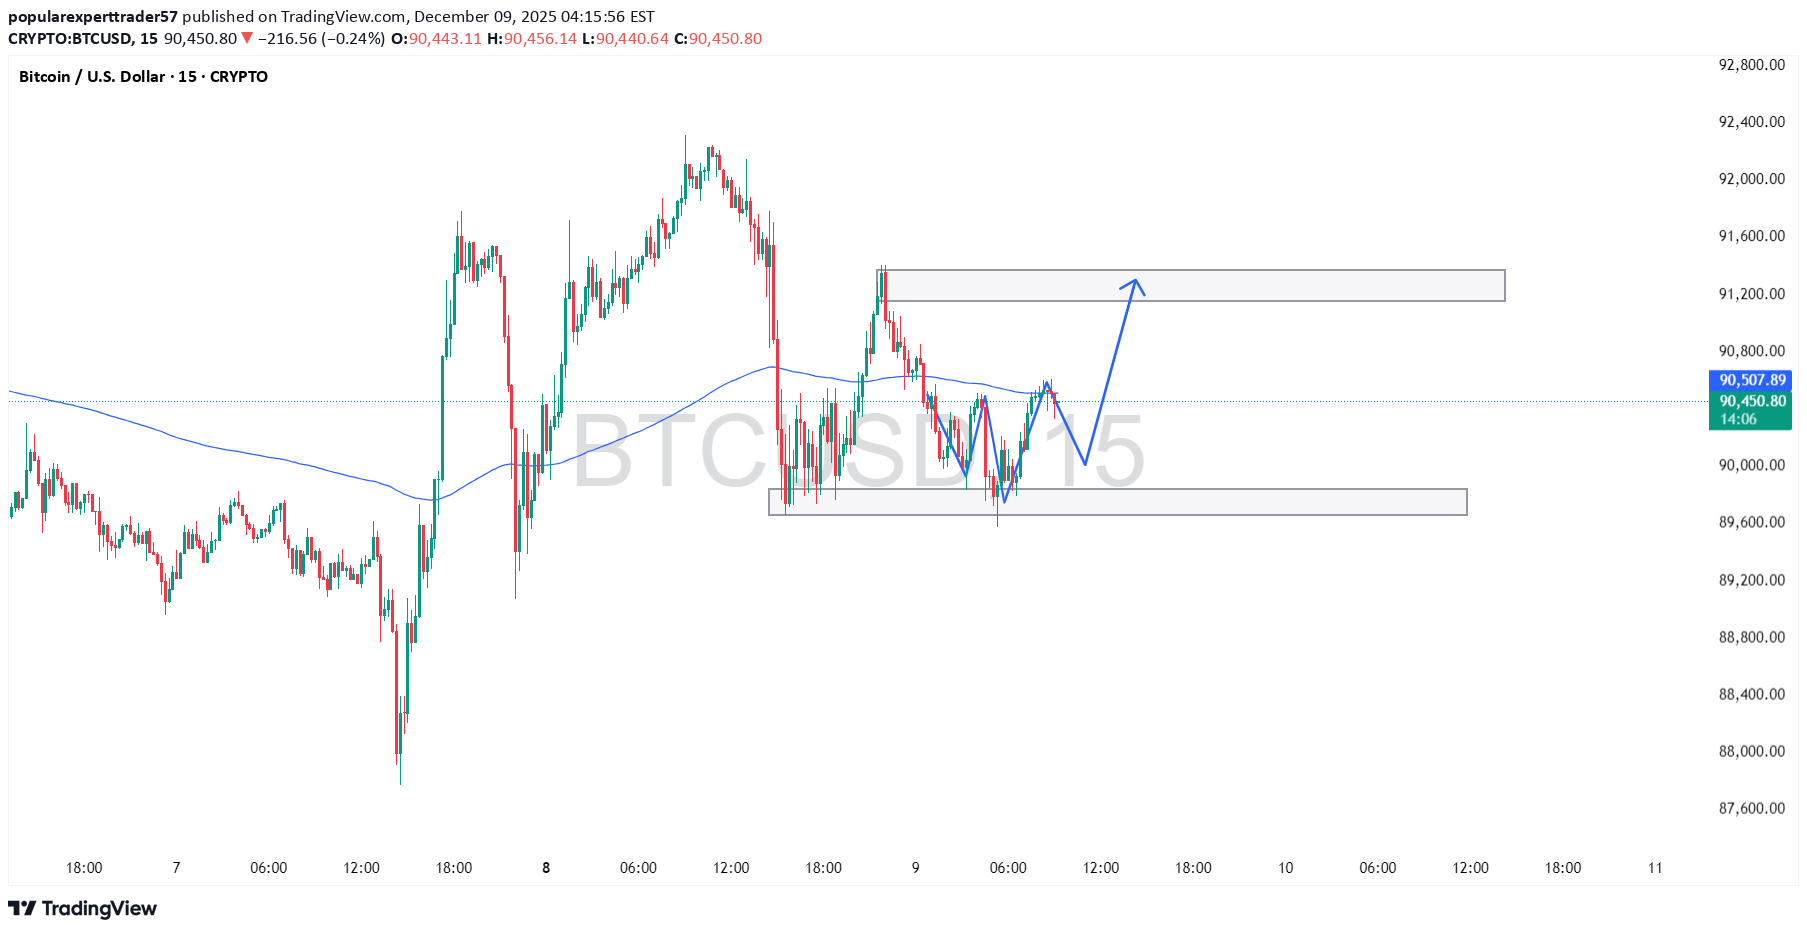
BTC/USD 15m Quick Analysis – Dec 09, 2025Price just broke the short-term downtrend with a strong bounce off the $89.8k–$90k support zone (multiple rejections = strong demand).Bullish as long as we hold $90k. Next targets: $91.2k → $91.8k Invalidation: Close below $89.8kLong bias active – dip buys around $90.3k–$90.5k look solid.#Bitcoin #BTC #Crypto #BTCUSD #BitcoinLong #Breakout Not financial advice – DYOR, trade at your own risk.
BTCUSD Daily – Major Topping Structure Confirmed
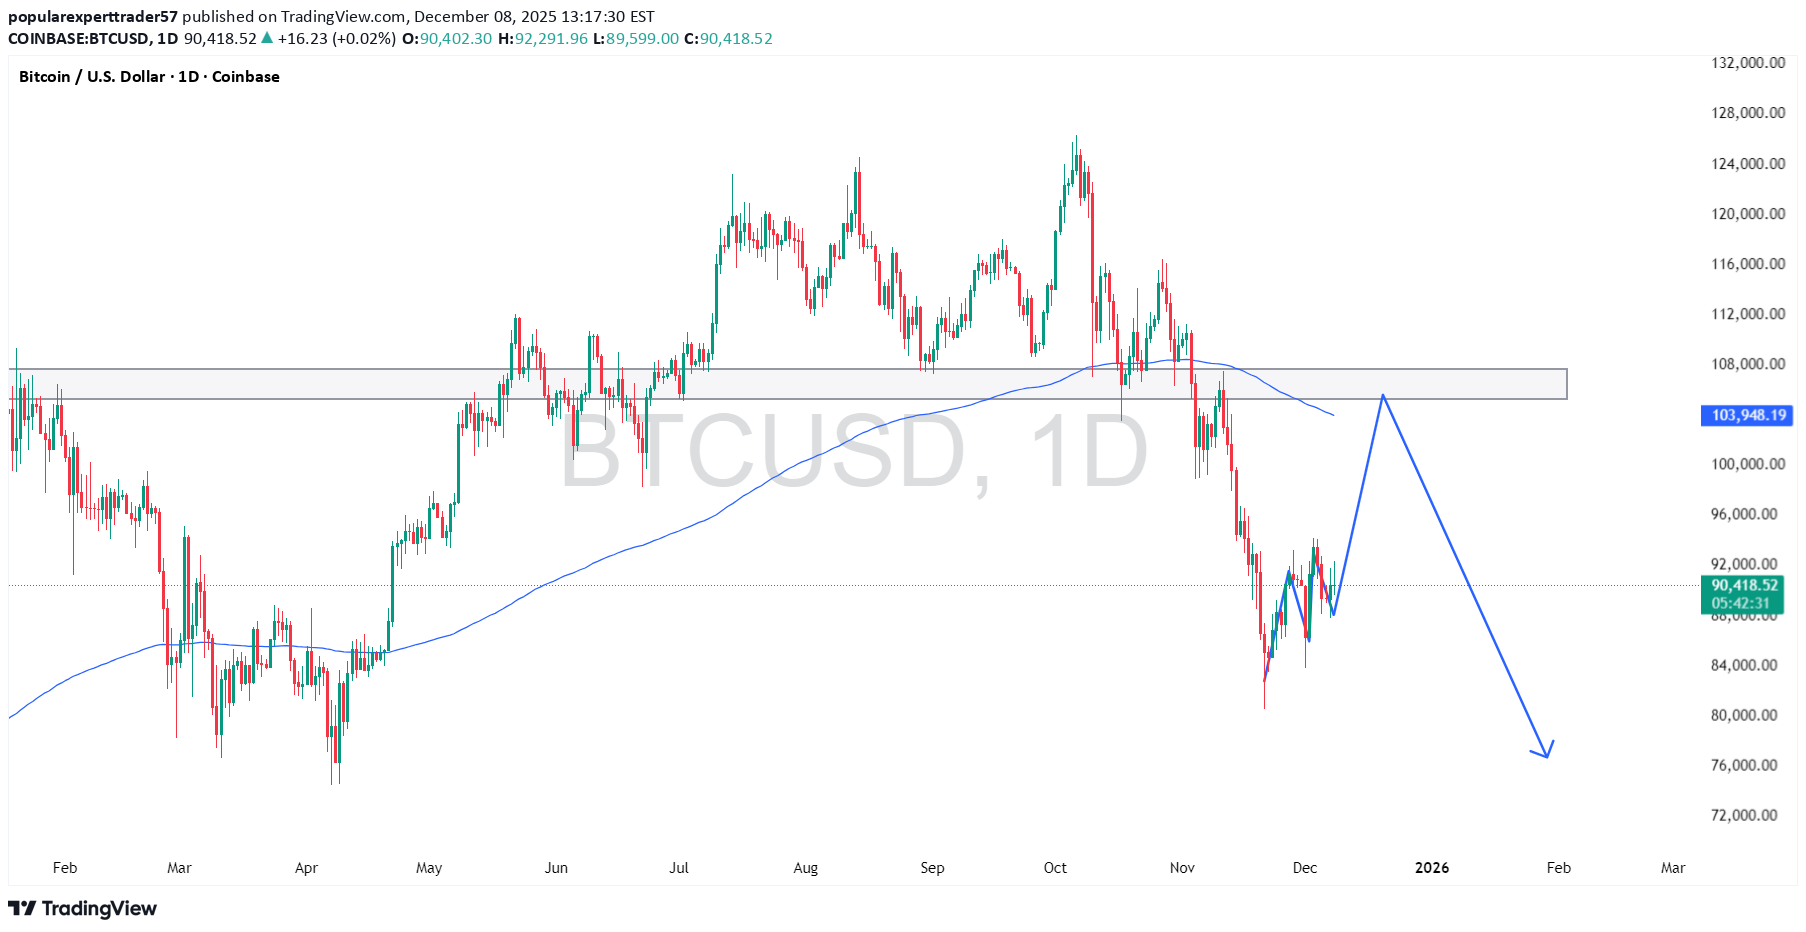
BTCUSD Daily – Major Topping Structure Confirmed | Bearish BiasBitcoin has printed a textbook distribution phase after the parabolic run to ~$109K: Double-top + lower high around the $108–109K zone Clear break & daily close below the multi-month bullish trendline (former support since March 2025) Strong bearish momentum candle with increased volume on the breakdown Price now retesting the broken trendline from below → perfect lower-timeframe rejection expected Bigger-picture target sits at $90–92K (previous range highs) and $84–80K if bears stay in control.Short / Sell Signal Direction: Short Bitcoin Entry: 103,500 – 104,500 (retest of broken trendline) Stop Loss: 107,200 (above the lower high) Take Profit 1: 96,000 Take Profit 2: 90,000 – 92,000 Take Profit 3: 84,000 – 80,000 R:R: 1:5+ easily achievable #BTC #Bitcoin #BTCUSD #ShortBitcoin #Bearish #DailyBreakdown #Crypto #TechnicalAnalysis Not financial advice – cryptocurrency trading is extremely risky. Always manage your risk and do your own research!
BTC/USD 15m Update – Fibonacci Dip-Buy Setup

BTC/USD 15m Update – Fibonacci Dip-Buy Setup ActivatedCurrent Price: ~90,640 (+0.47% recovering)After the strong breakout above the descending trendline, Bitcoin has pulled back sharply and is now perfectly respecting the 61.8% Fibonacci retracement of the entire impulsive leg (from the FVG low ~88,500 up to 92,773 high). Price has already swept the 61.8% level, reclaimed it with a strong green candle, and is now holding above the ascending micro-trendline + the 61.8% zone. This is textbook pullback into golden Fibonacci + trendline confluence is one of the highest-probability long setups on lower timeframes.Trading Signal (15m/1h Scalp – Swing) Direction: Long (Aggressive Buy) Entry Zone: 90,300 – 90,600 (61.8% – 65% Fib area) → already filling Stop Loss: 89,750 (below 78.6% Fib and FVG low) Take Profit 1: 92,000 – 92,500 (previous highs) Take Profit 2: 93,500 – 94,000 (measured move & next resistance) Risk/Reward: 1:3+ possible Confluence: 61.8% Fibonacci retracement Ascending trendline support FVG already filled earlier Bullish orderflow on lower timeframes (aggressive bids stepping in) #BTC #Bitcoin #Crypto #Fibonacci #DipBuy #GoldenRatio #BTCLong #TradingSignal #TechnicalAnalysis Not financial advice – trade at your own risk, use proper risk management, and always do your own research!
Bitcoin 15m Analysis: Bullish Trendline Breakout –
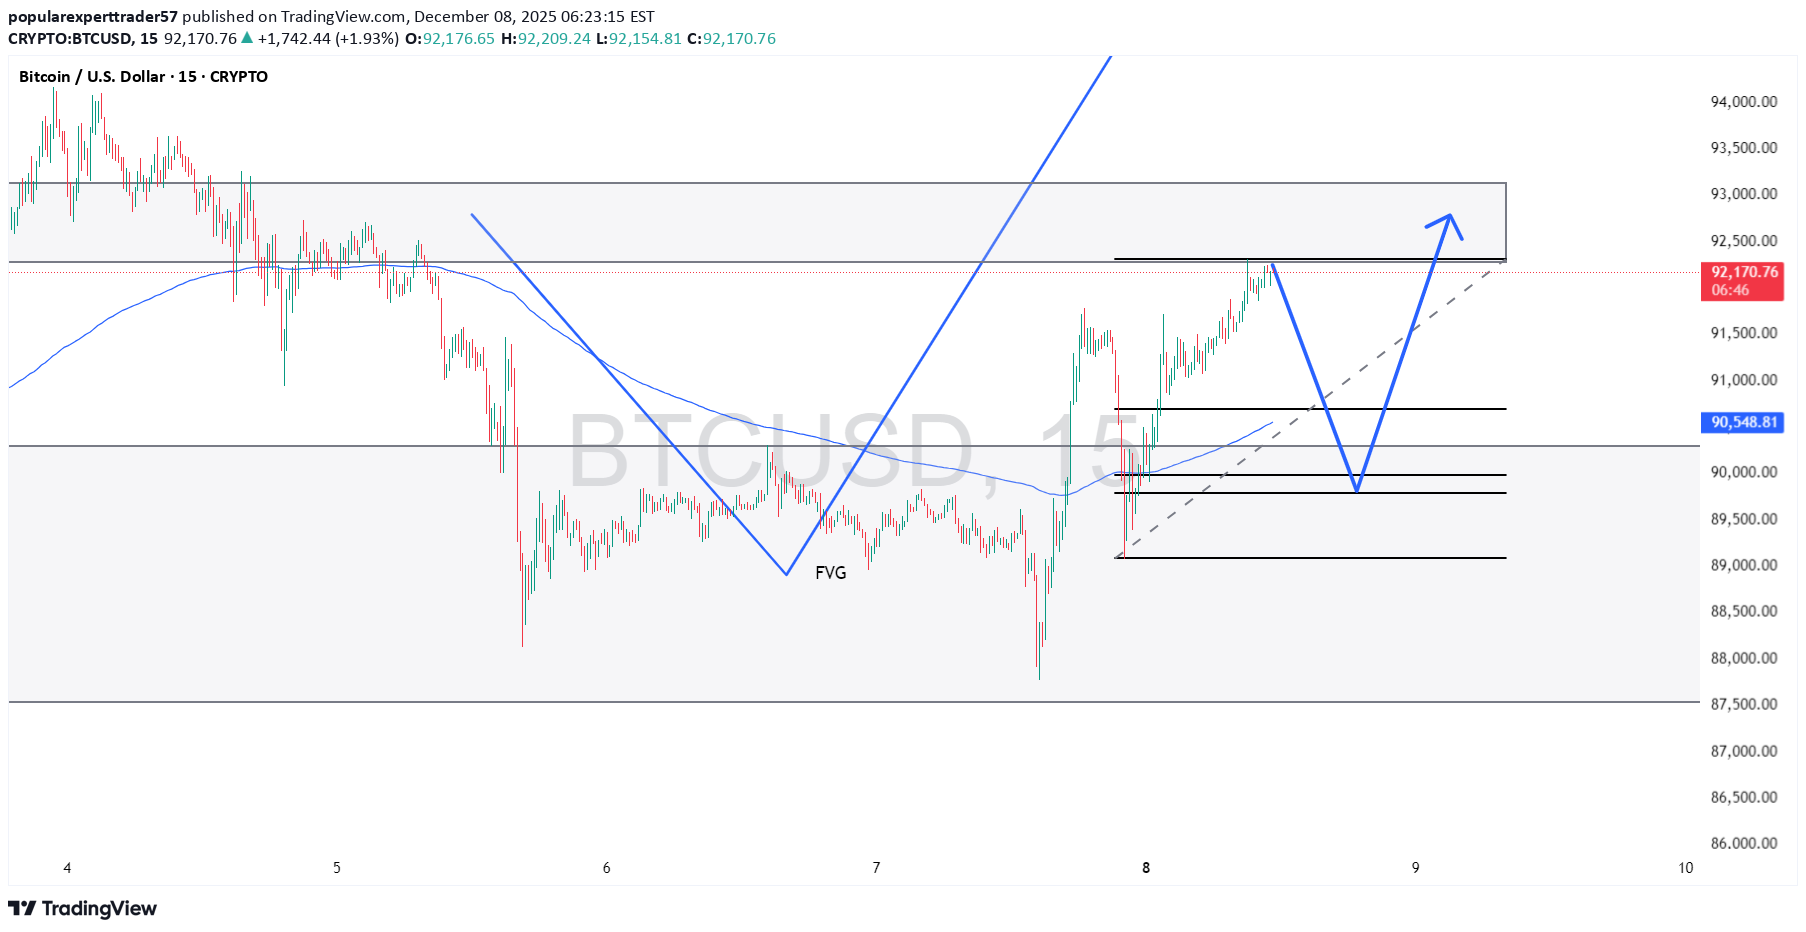
The provided chart is a 15-minute timeframe for BTC/USD, showing recent price action from December 6 to around December 8, 2025. Bitcoin appears to have formed a descending trendline (blue line sloping downward from the left), which acted as resistance during a pullback phase. Price consolidated in a choppy manner, dipped to fill a Fair Value Gap (FVG) near the lower levels around 88,500-89,000, and then broke out bullishly above the descending trendline, supported by an ascending trendline from the recent low. This breakout suggests renewed upward momentum, with the price currently hovering around 92,173 (down 0.41% on the candle), testing immediate resistance near 92,500-93,000. Multiple horizontal support/resistance lines are drawn, including key zones at 90,548, 90,000, and lower at 89,500-89,000, indicating potential areas for bounces or reversals.Focusing on the 89,800 level you're eyeing: This sits near the lower end of the recent FVG zone and aligns with a horizontal support line visible on the chart. It could represent a high-probability dip-buy opportunity if price retraces from current levels, especially as it coincides with the ascending trendline support. Volume appears to pick up on the upside breakout, supporting bullish bias, but watch for any failure to hold above 90,548, which could lead to a retest of 89,800. Overall, the structure looks constructive for bulls in the short term, with potential targets at 93,000 and beyond to 94,000 if momentum sustains, but broader market factors (like macro news or sentiment) could influence this.Trading Signal: Entry: Long (Buy) on dip to 89,800 (wait for confirmation like a bullish candle or bounce off trendline). Stop Loss: 88,500 (below FVG low for risk management). Take Profit 1: 92,500 (near current resistance). Take Profit 2: 94,000 (extension target). Risk/Reward: Aim for 1:2 or better. #BTC #Bitcoin #Crypto #TradingSignal #TechnicalAnalysis This is not financial advice—trading involves risk, and you should do your own research or consult a professional.
BTC/USD – Potential Long Setup (15m)
🚨 BTC/USD – Potential Long Setup (15m) Buy Zone: $87,300 – $87,600 Entry: Aggressively now or on retest of 87.4k–87.5k Target 1: $89,000 Target 2: $90,000 Target 3: $91,600+ (previous highs) Stop Loss: $86,800 (below the recent swing low) Reason: Strong bounce forming from the rising trendline + higher-timeframe support zone. Bullish divergence on RSI and volume spike on the reversal candle. Risk: 1–2% of capital R:R = 1:3+ #BTC #Bitcoin #BTCUSD #CryptoTrading #CryptoSignal #SwingTrade #Altseason2025 ⚠️ Not financial advice – Trade at your own risk. Always do your own research and manage risk properly. Feel free to copy-paste or adjust the targets/SL to your exact plan! Good luck if you're entering.
BITCOIN (BTCUSD) – AGGRESSIVE BULLISH BUY SIGNAL
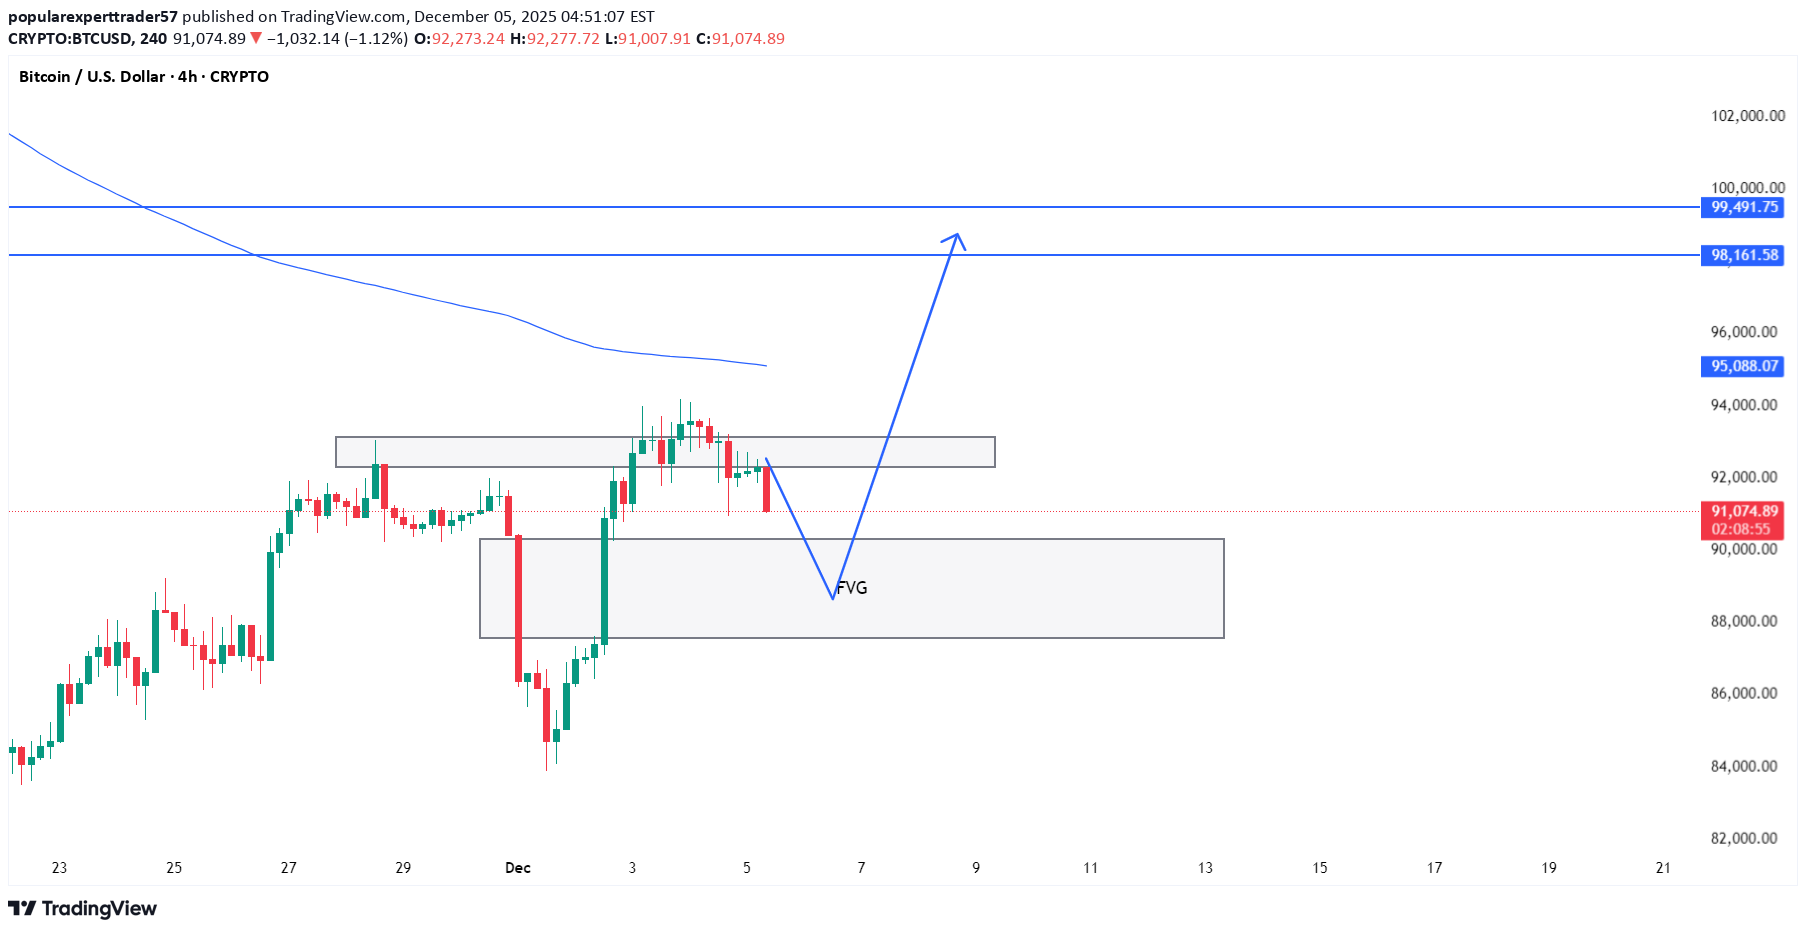
BITCOIN (BTCUSD) – AGGRESSIVE BULLISH BUY SIGNAL Timeframe: 4H Current Price: ~$96,800 Entry Zone (Your FVG): 87,800 – 89,200 (Main 4H Fair Value Gap + high-volume demand area from the previous rally leg)Stop Loss: 86,500 – 87,000 (below the FVG and recent major low) Take Profit Targets: TP1: 92,000 – 93,000 TP2: 96,000 – 97,500 (current value area) TP3: 100,000 – 102,000+ (if momentum explodes) Reason: Strong 4H FVG at 88k zone acting as deep discount area. Expecting aggressive buying and potential sweep-the-lows before continuation of the macro uptrend. High reward setup for patient buyers.Risk-Reward: 1:4 to 1:7+ possible #Bitcoin #BTC #Crypto #BTCUSD #FVG #SmartMoney #CryptoTrading #TradingSignal Not financial advice – this is my personal technical analysis only. Trade at your own risk, use proper money management, and always DYOR.
ETHUSD Long Signal
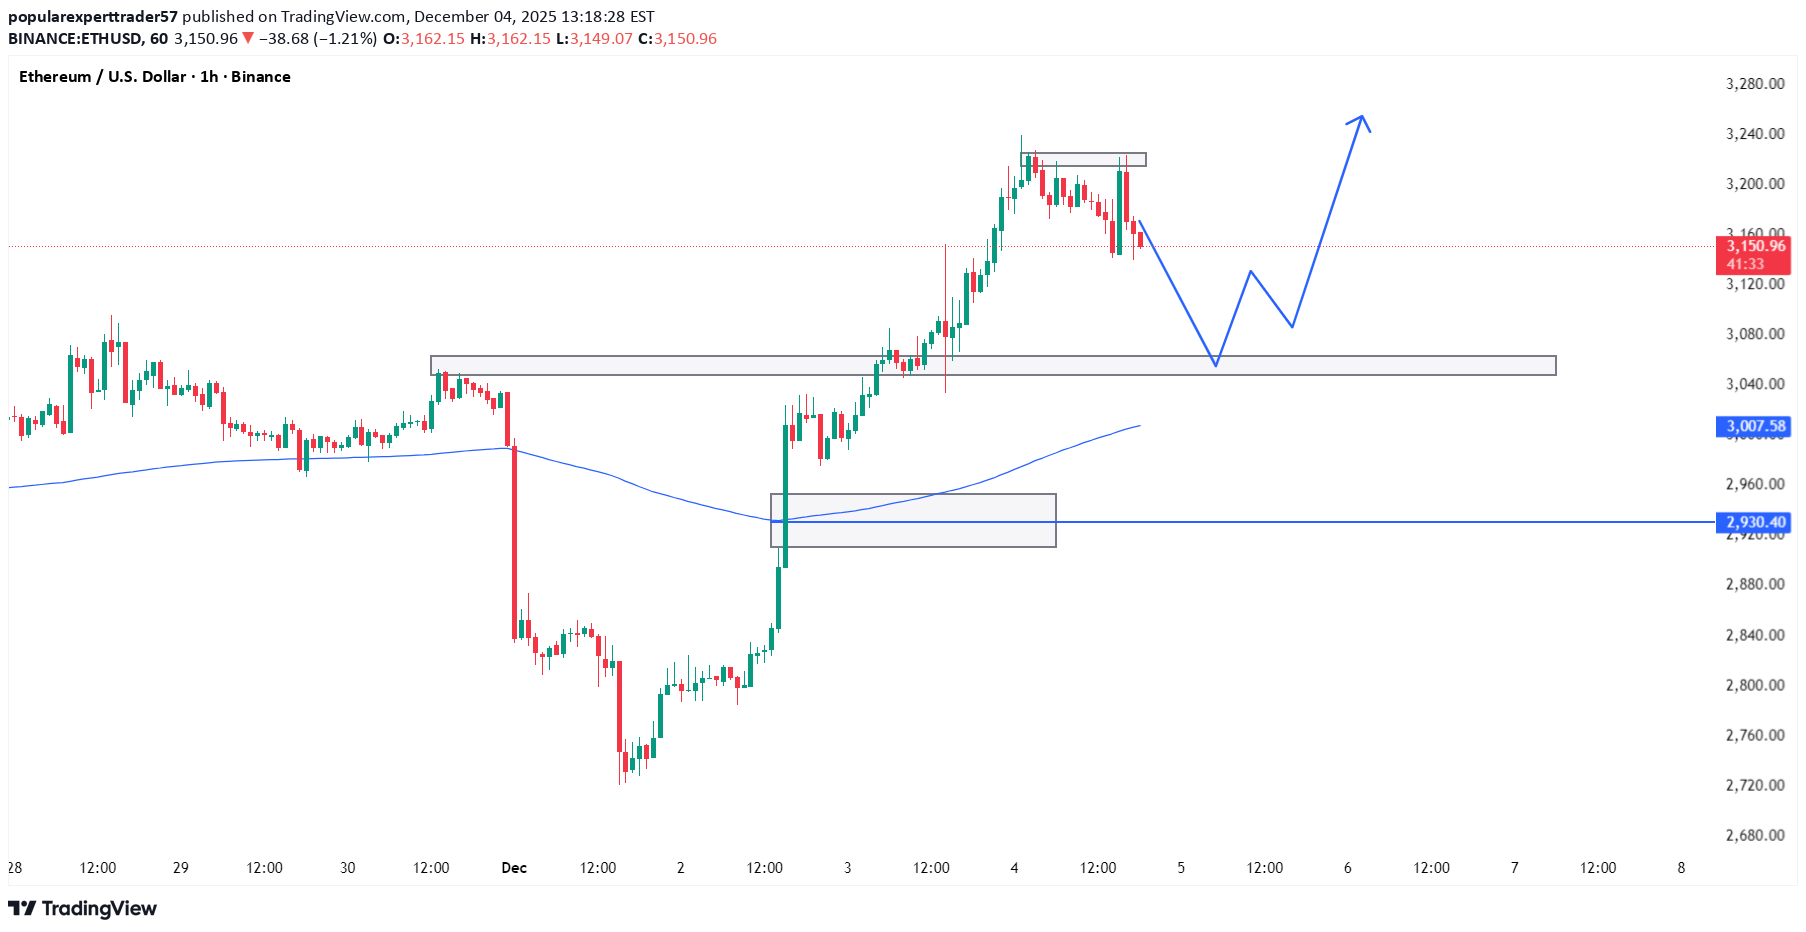
ETHUSD Long Signal – Buying the Major Demand Zone Price just swept the 4H/1H demand zone at 2,920–2,940 (multiple touches since November + high volume node). Clean bullish reaction already printing, looking for continuation higher.Entry: 2,925 – 2,945 (buy limit zone or aggressive market buy) Stop Loss: 2,880 (below the demand zone & swing low) Take Profit 1: 3,020 Take Profit 2: 3,100 Take Profit 3 (runner): 3,200–3,250 supply zone Risk-Reward: 1:3 → 1:7+Reason: Strong support hold, liquidity taken below the zone, bullish order flow returning, ETH/BTC ratio also turning up.This is NOT financial advice! Only trade with money you can afford to lose. Do your own research and manage risk properly. #ETHUSD #Ethereum #ETHLong #Crypto #BuyTheDip #EthereumSignals #CryptoTrading #PriceAction #Altseason #Trading Loading the ETH bags at support – let’s ride this back to 3.2k+
Disclaimer
Any content and materials included in Finbeet's website and official communication channels are a compilation of personal opinions and analyses and are not binding. They do not constitute any recommendation for buying, selling, entering or exiting the stock market and cryptocurrency market. Also, all news and analyses included in the website and channels are merely republished information from official and unofficial domestic and foreign sources, and it is obvious that users of the said content are responsible for following up and ensuring the authenticity and accuracy of the materials. Therefore, while disclaiming responsibility, it is declared that the responsibility for any decision-making, action, and potential profit and loss in the capital market and cryptocurrency market lies with the trader.