
sladkamala123
@t_sladkamala123

What symbols does the trader recommend buying?
Purchase History
Trader Messages
Filter
Message Type
sladkamala123
SPX
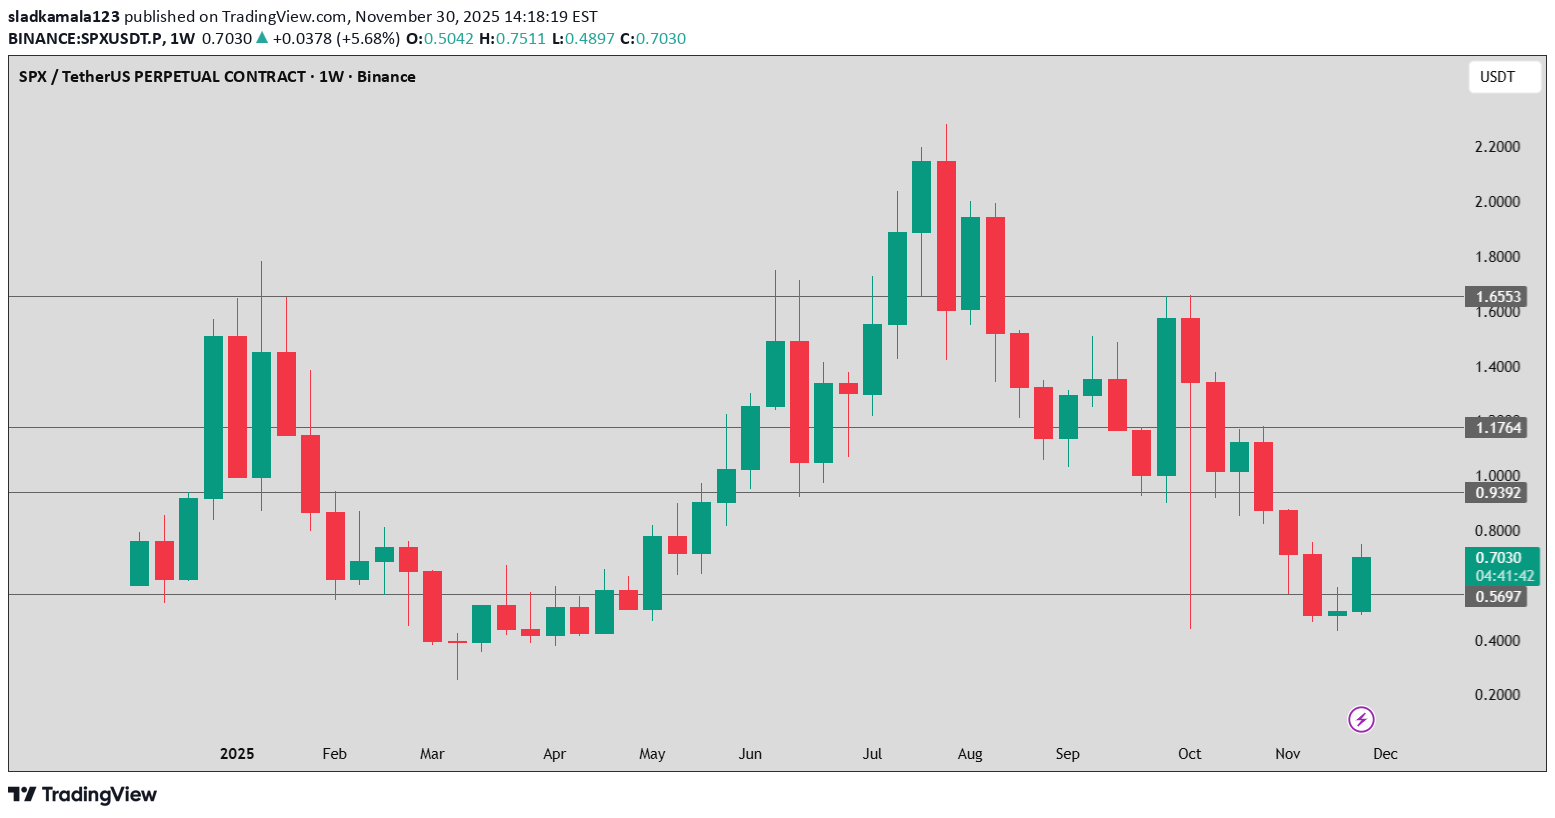
SPX is in a broad downtrend after a full bull cycle. The recent green candle indicates a temporary bounce, not a confirmed reversal. Key resistance: 1.00 USDT Key support: 0.5697 USDT A break above 1.00 would be the first real bullish confirmation.
sladkamala123
KOMA
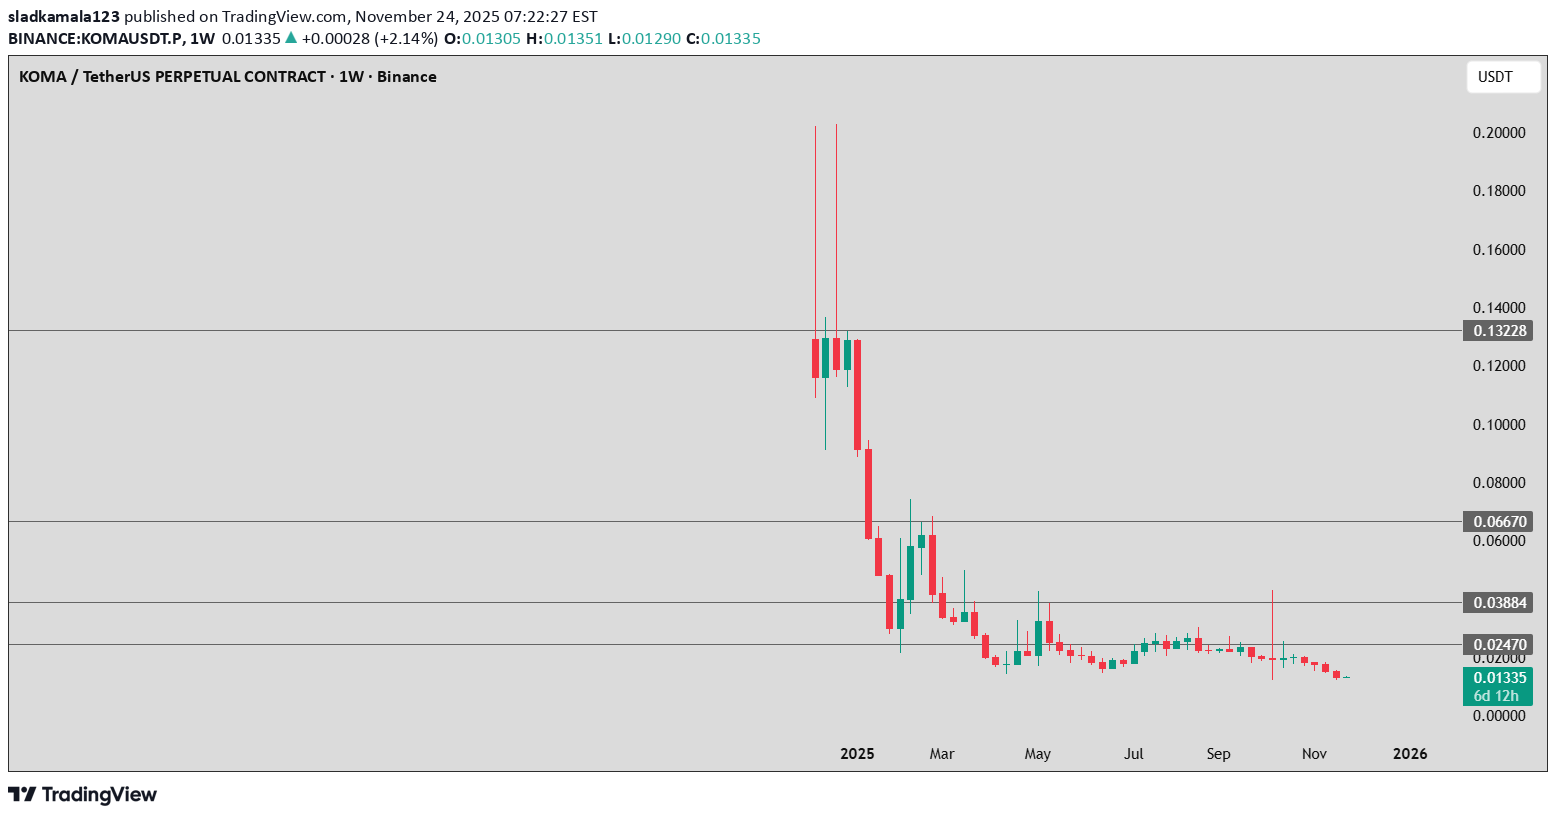
Bullish Scenario For the trend to reverse upward, the price must: Break above 0.0247 USDT Then break above 0.0388 USDT Only above 0.0667 USDT can we talk about a true trend reversal There are long wicks in the chart history, which means short-term pumps are possible. If a pump occurs, the targets are: 0.020 0.025 0.038 🔻 5. Bearish Scenario (currently the most likely) If the price falls below 0.012 USDT, it will very likely: test 0.010 USDT if that level fails → 0.0080 → 0.0060 USDT This aligns with the overall trend since the beginning of 2025.
sladkamala123
BOS
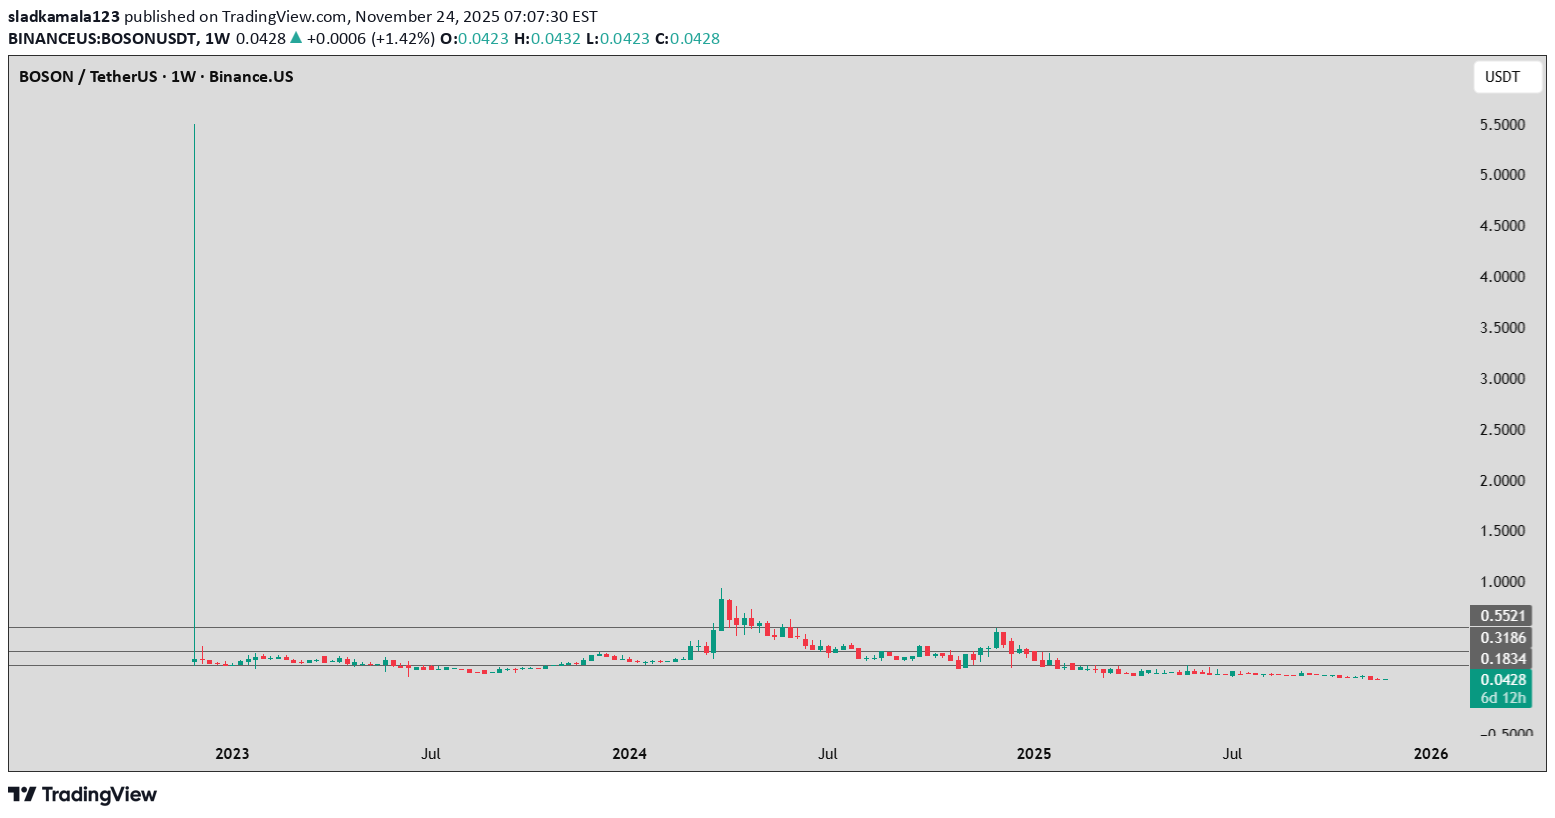
The price is stagnating at 0.042 USDT, close to multi-year lows; The trend is strongly bearish; Liquidity is very poor. If it falls below 0.040, 0.030 and 0.025 are very likely. If it breaks above 0.09, there is a chance for a move toward 0.18.
sladkamala123
AERO
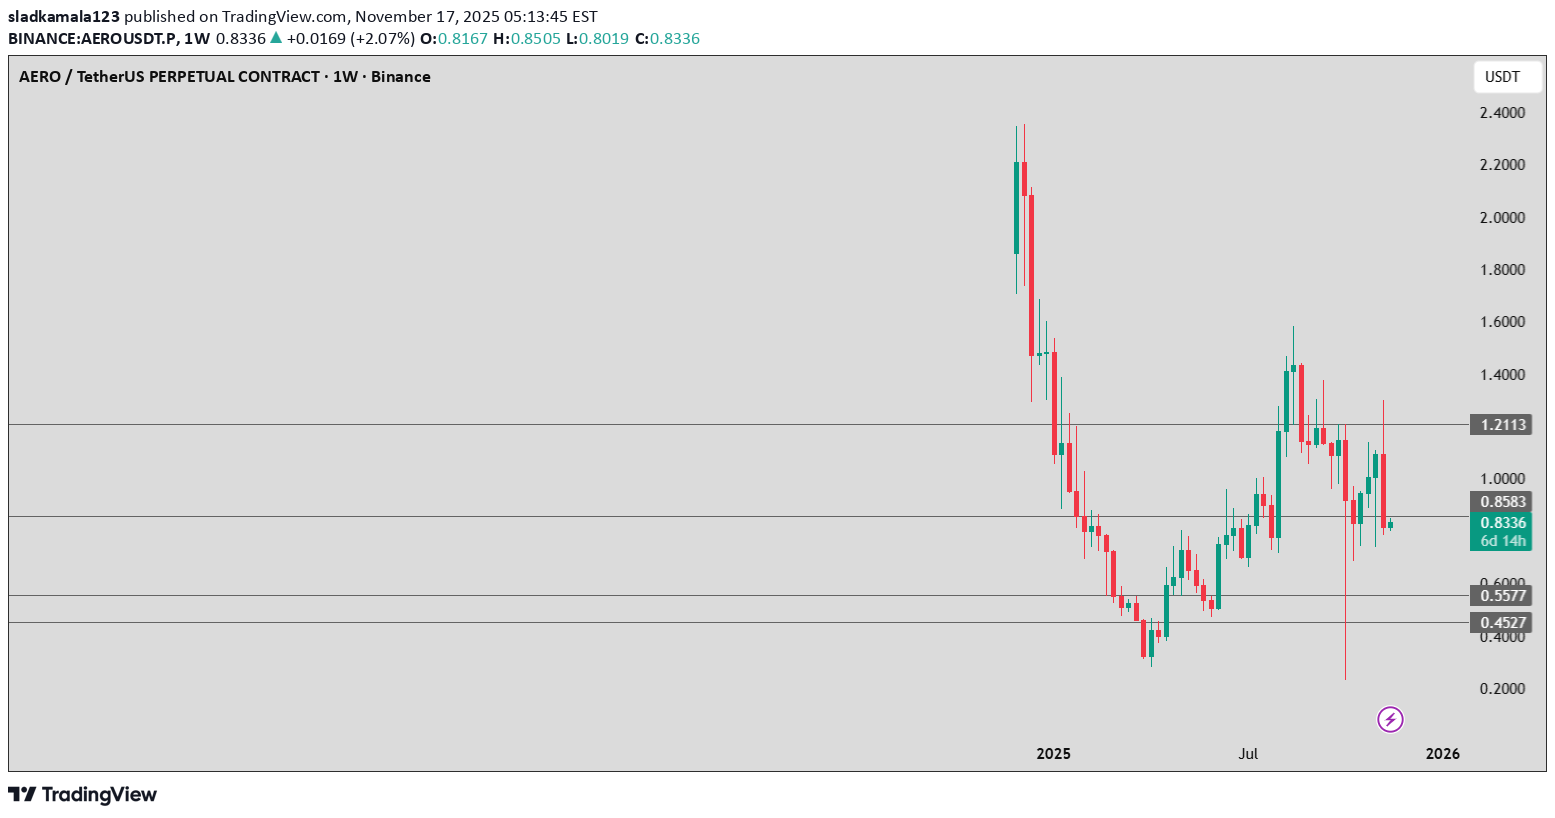
Bullish Scenario For the uptrend to continue, the following must happen: Hold support at 0.83 or 0.5577 Break above: 1.00 1.2113 (the key signal for a trend reversal) Targets in a bullish continuation: Target 1 → 1.00 USDT Target 2 → 1.21 USDT Target 3 → 1.40 USDT Target 4 → 1.60 USDT (only in a strong bullish trend)
sladkamala123
SUP
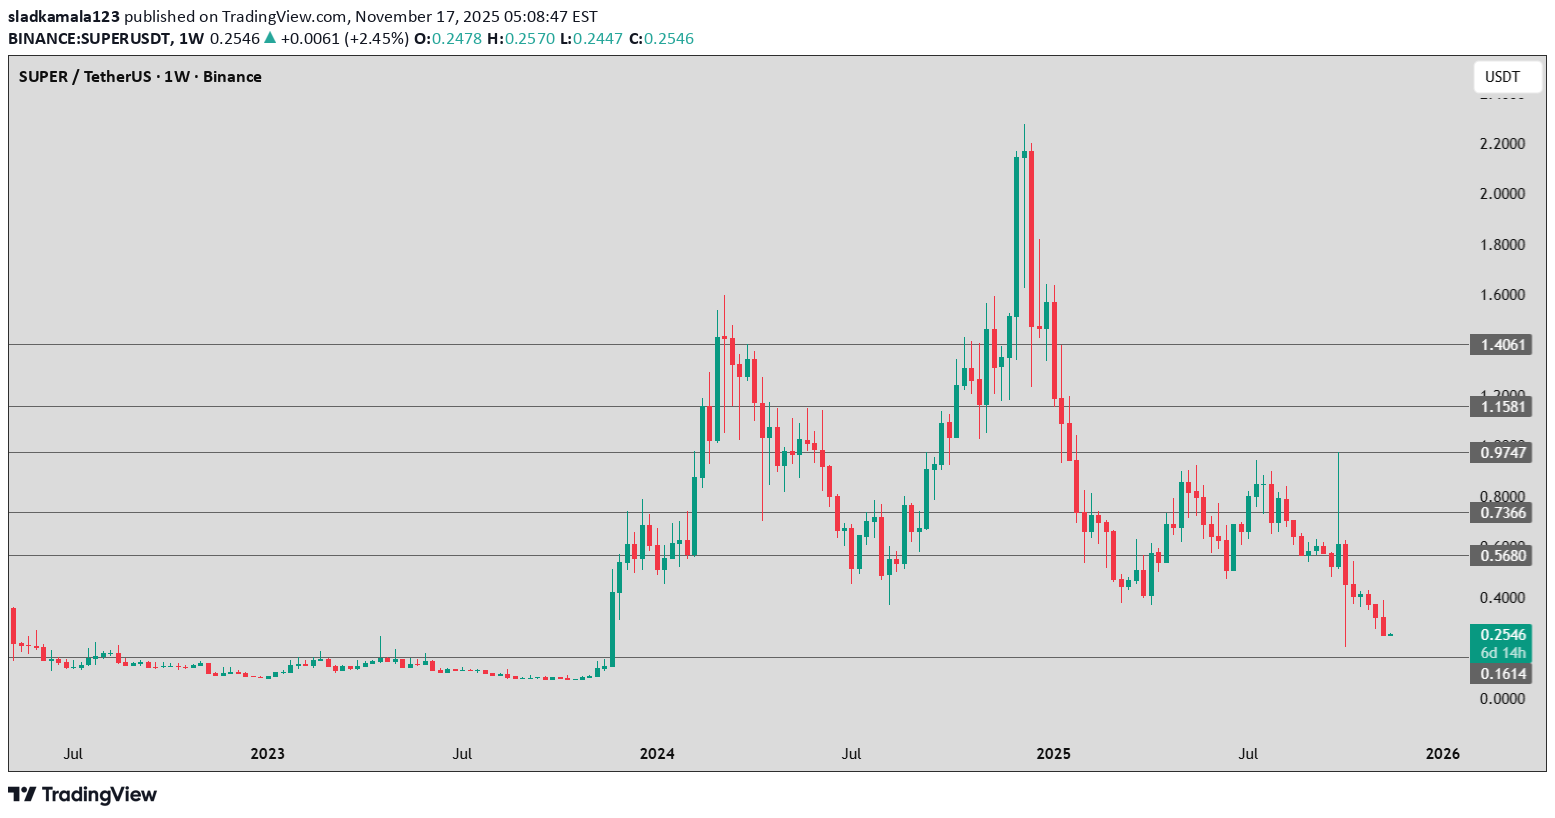
Bullish Scenario (medium–low probability) If the price bounces from 0.25 or 0.16: Target 1 → 0.568 USDT Target 2 → 0.736 USDT Target 3 → 0.974 USDT To confirm a trend reversal, the weekly close should be above 0.568. Bearish Scenario (medium–high probability) If the price falls below 0.1614, the next support zone is around: 0.10 – 0.12 USDT This would signal a continuation of the multi-month downtrend.
sladkamala123
SFP
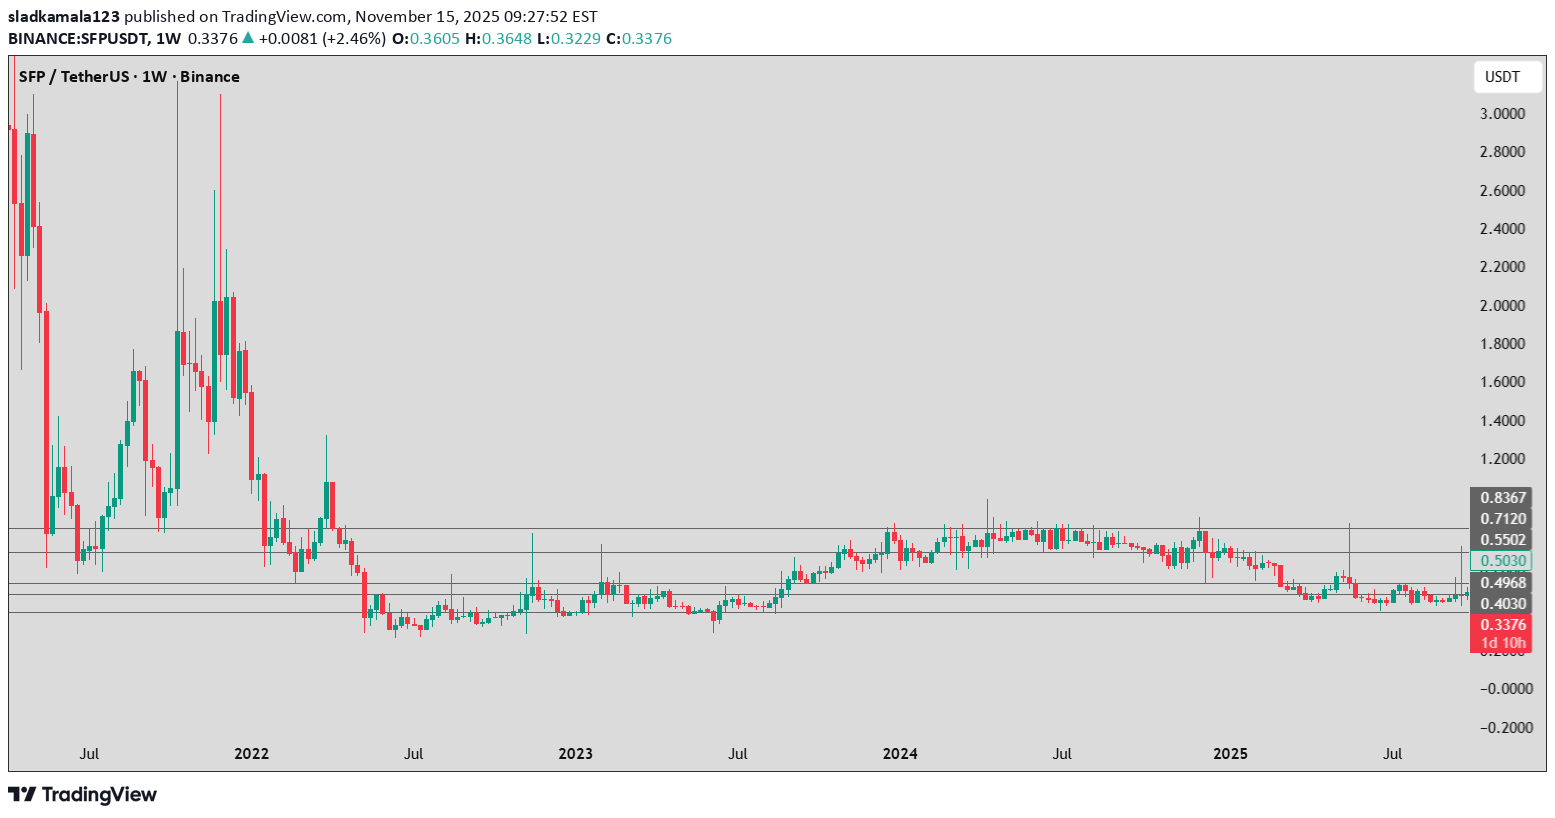
SFP is out of trend — it has been moving horizontally for 2 years, indicating a stagnation of interest. The price has been forming lower highs since the beginning of 2024, which strengthens the bearish structure. The current candle is red, but not extreme, which suggests weak but consistent selling pressure.
sladkamala123
ID
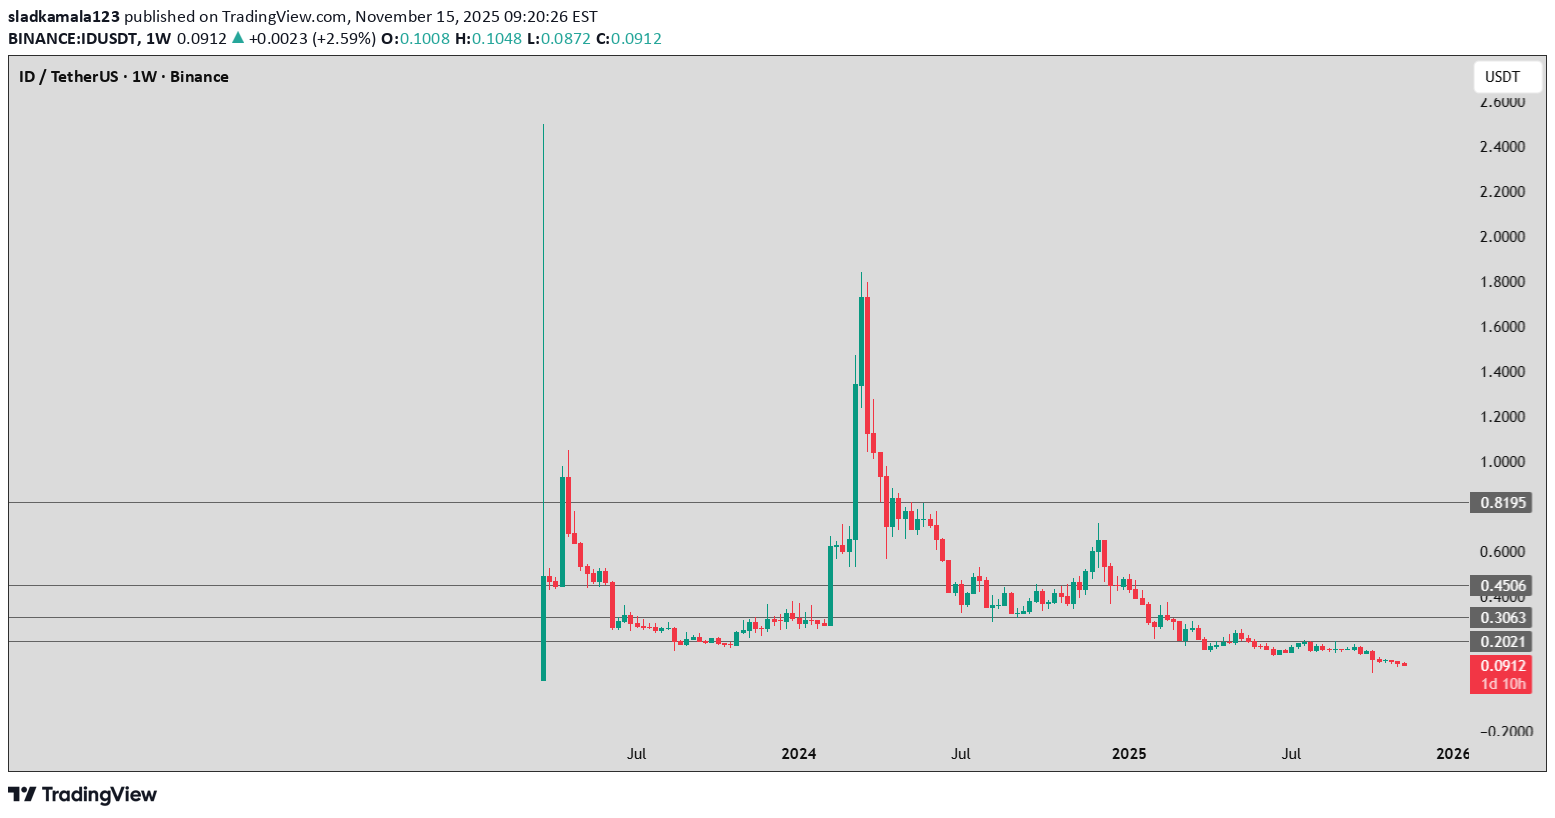
ID is in a clear and strong bearish trend — the price has been falling for more than a year. No higher lows have formed, which means buyers are showing no strength. The candles are small and red → low volume + selling pressure dominance. Additionally, large upward “spike” wicks are visible, which usually indicate: 👉 a liquidity grab → followed by a drop.
sladkamala123
DOT
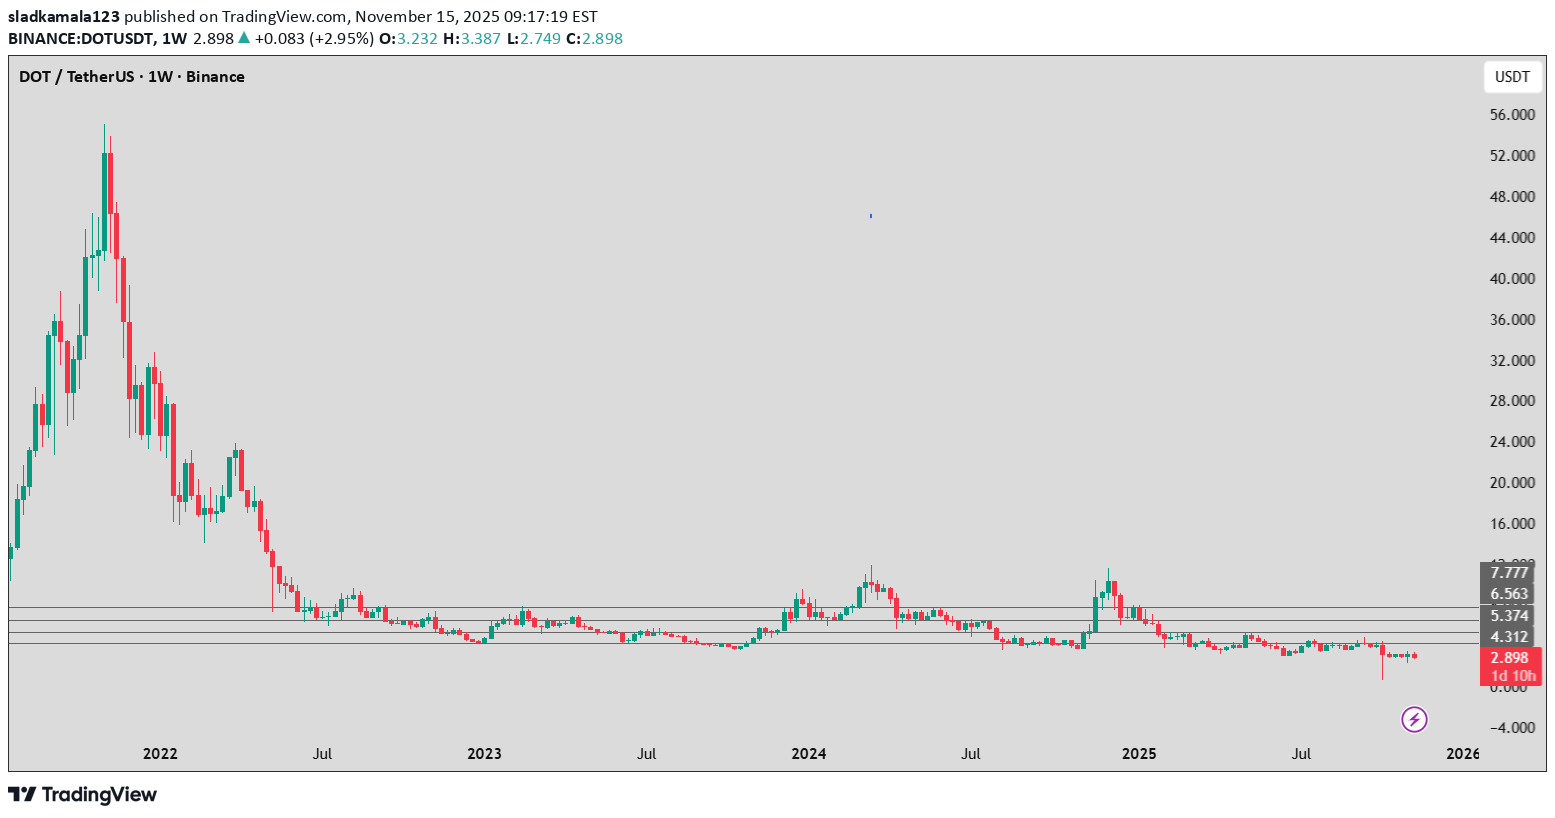
DOT has been in a long-term bearish trend for more than 2 years, with no clear signs of reversal. The recent candle is a large red one, confirming increased selling pressure. The price is sitting at the very bottom of the range, indicating weak buying interest.
sladkamala123
AVAX
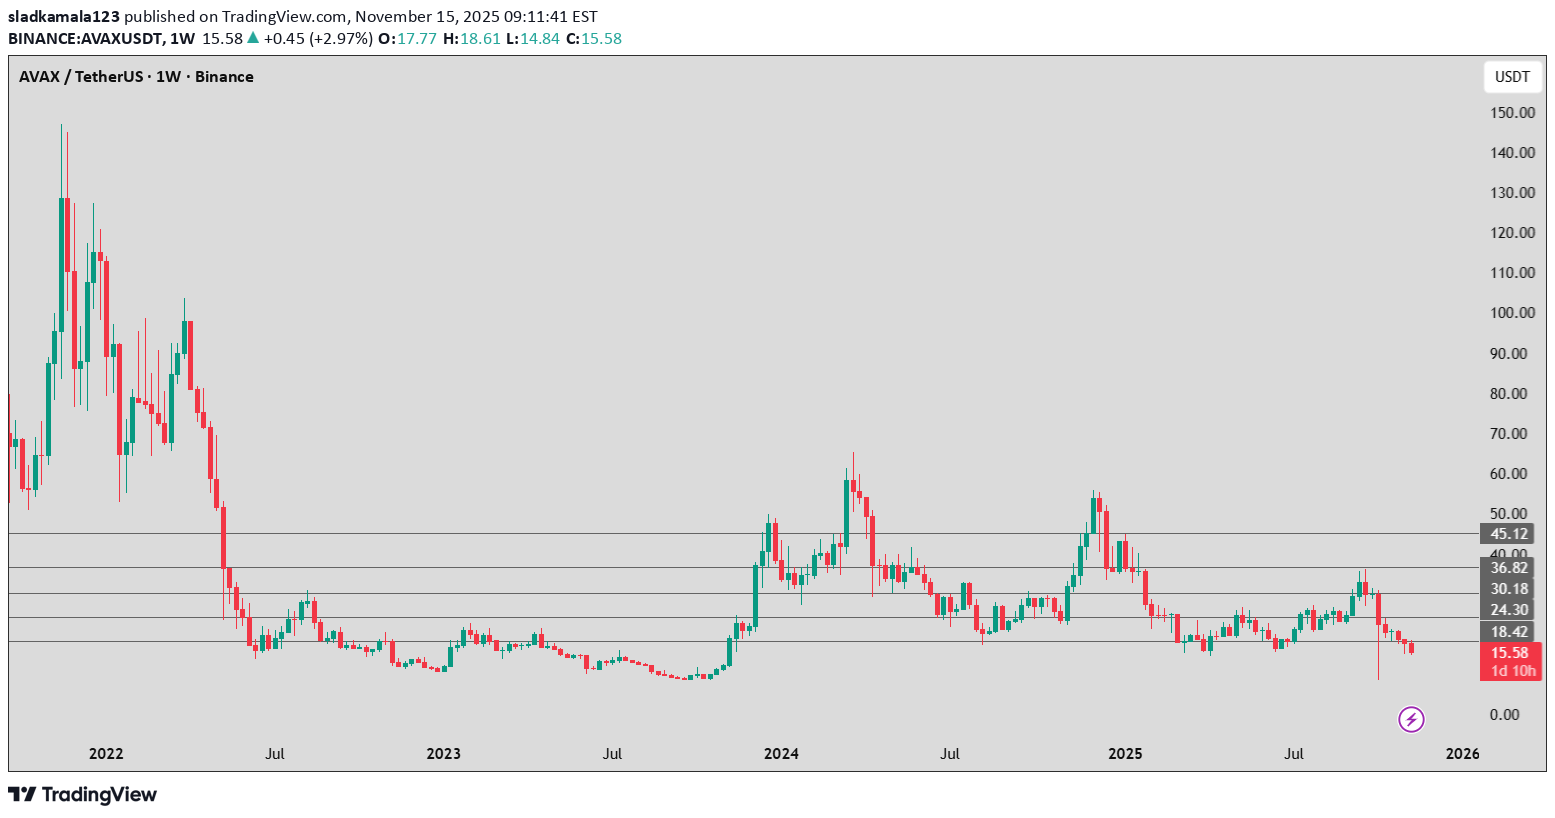
Current signal: bearish. If AVAX stays below 18.4 USDT, there is a real possibility of a continuation of the decline toward 13–14 USDT. For a reversal into a bullish trend, AVAX would need to: break above 24.30 USDT, hold a weekly higher low, increase buying volume.
sladkamala123
XLM tries to breakout
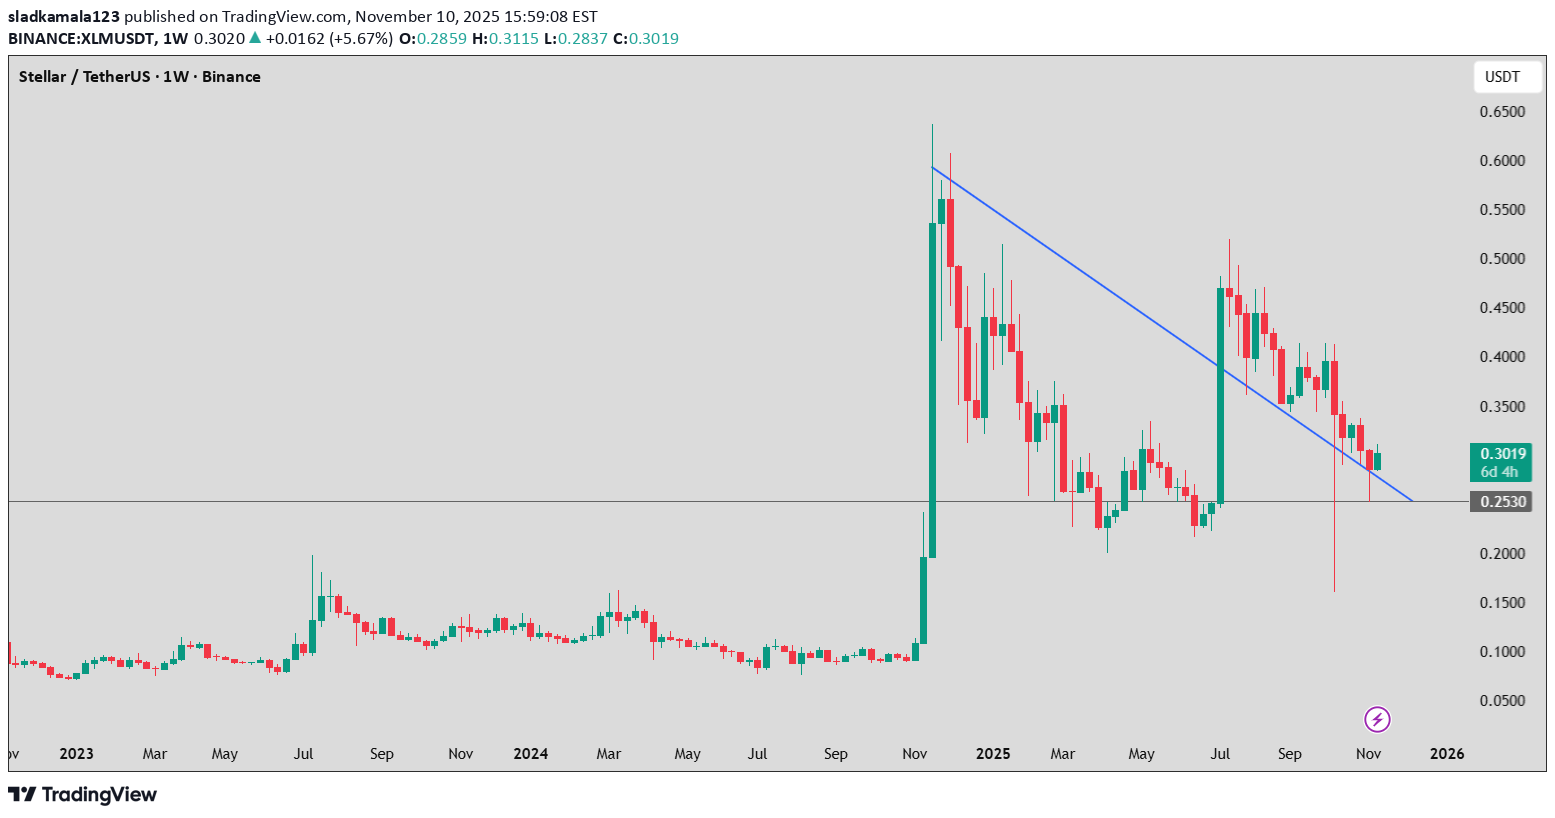
XLM is sitting between a wedge and above support line which indicates it could break that trendline and we could see more uptrend
Disclaimer
Any content and materials included in Finbeet's website and official communication channels are a compilation of personal opinions and analyses and are not binding. They do not constitute any recommendation for buying, selling, entering or exiting the stock market and cryptocurrency market. Also, all news and analyses included in the website and channels are merely republished information from official and unofficial domestic and foreign sources, and it is obvious that users of the said content are responsible for following up and ensuring the authenticity and accuracy of the materials. Therefore, while disclaiming responsibility, it is declared that the responsibility for any decision-making, action, and potential profit and loss in the capital market and cryptocurrency market lies with the trader.