
tomas_jntx
@t_tomas_jntx

What symbols does the trader recommend buying?
Purchase History
Trader Messages
Filter
Message Type
tomas_jntx
Turning a Popular Indicator Into a Structured Decision Tool Many traders use MACD as a simple signal generator. They see a crossover, enter a trade, and later realise the result does not match the expectation. MACD becomes useful only when it is applied inside a clear framework built on trend, momentum, and timing. Its real value lies in reading shifts in participation rather than delivering standalone entry signals. Understanding what the indicator represents is the first step. MACD measures the relationship between two moving averages and reveals how fast price is accelerating or slowing down. The histogram shows the rate of change. When used with intent, MACD helps you read the strength behind a move instead of trying to predict direction. Momentum confirms structure and brings clarity to the decision process. Define the market environment before looking at MACD. Trending markets and ranging markets produce different behaviours. In a trend, a rising histogram often supports continuation and helps you judge whether a pullback is healthy or the start of a deeper rotation. In a range, the histogram moves around the zero line and highlights areas where momentum is fading. Without this context, MACD signals tend to mislead more than they help. The next step is aligning MACD with the locations your system already relies on. Use it as part of the confluence, not as a trigger. When price reaches a higher-timeframe level, a liquidity area, or a clear structural pivot, the histogram can show whether momentum is shifting in your favour. You are not asking MACD to discover the trade. You are using it to confirm the logic you have prepared. With structure and location in place, create specific decision rules for MACD behaviour. Examples include shrinking momentum when price approaches a level, expansion that supports a breakout, crossovers that match the higher-timeframe direction, or divergences that signal exhaustion at important zones. Every rule needs to serve a practical purpose. Reacting to every crossover removes discipline and weakens the system. Well-defined conditions make MACD a reliable filter. Risk management remains outside the indicator. MACD does not define stops, invalidation, or how much to risk. Those rules come from structure. Stops should respect swing highs or lows, well-defined invalidation areas, or volatility-based distances. Combining this approach with MACD’s momentum read protects you from chasing trades that lack strength and reduces over-engagement during slow conditions. Validation closes the loop. Backtest the exact behaviours you rely on, not the indicator as a whole. Study how histogram shifts behave at your chosen levels. Compare momentum against structure. Track how timing improves when MACD is used to refine execution instead of generate entries. When the data confirms the rules across different market conditions, the system gains stability. MACD becomes a valuable asset when integrated into a disciplined process. On its own, it produces too much noise. Inside a structured system, it sharpens momentum reading, filters out weak trades, and builds cleaner execution. Traders who use MACD to support their framework instead of driving it achieve far greater consistency over time.
tomas_jntx
Trend Check: MSB flipped bullish and price broke aggressively above $0.280. Now entering potential cooldown/retest zone. Indicators: RSI: 71 (overbought) MACD: Topping out, slight divergence Structure: Clean impulse from demand zone, but current levels overextended. Ideal setup would be a retest of $0.279–$0.280. Position: Long bias Entry Idea: Long on retrace to $0.280 Stop: Below $0.276 Targets: $0.286 → $0.290 Reasoning: MSB + demand confluence triggered bullish push. Wait for a clean retest before jumping in.
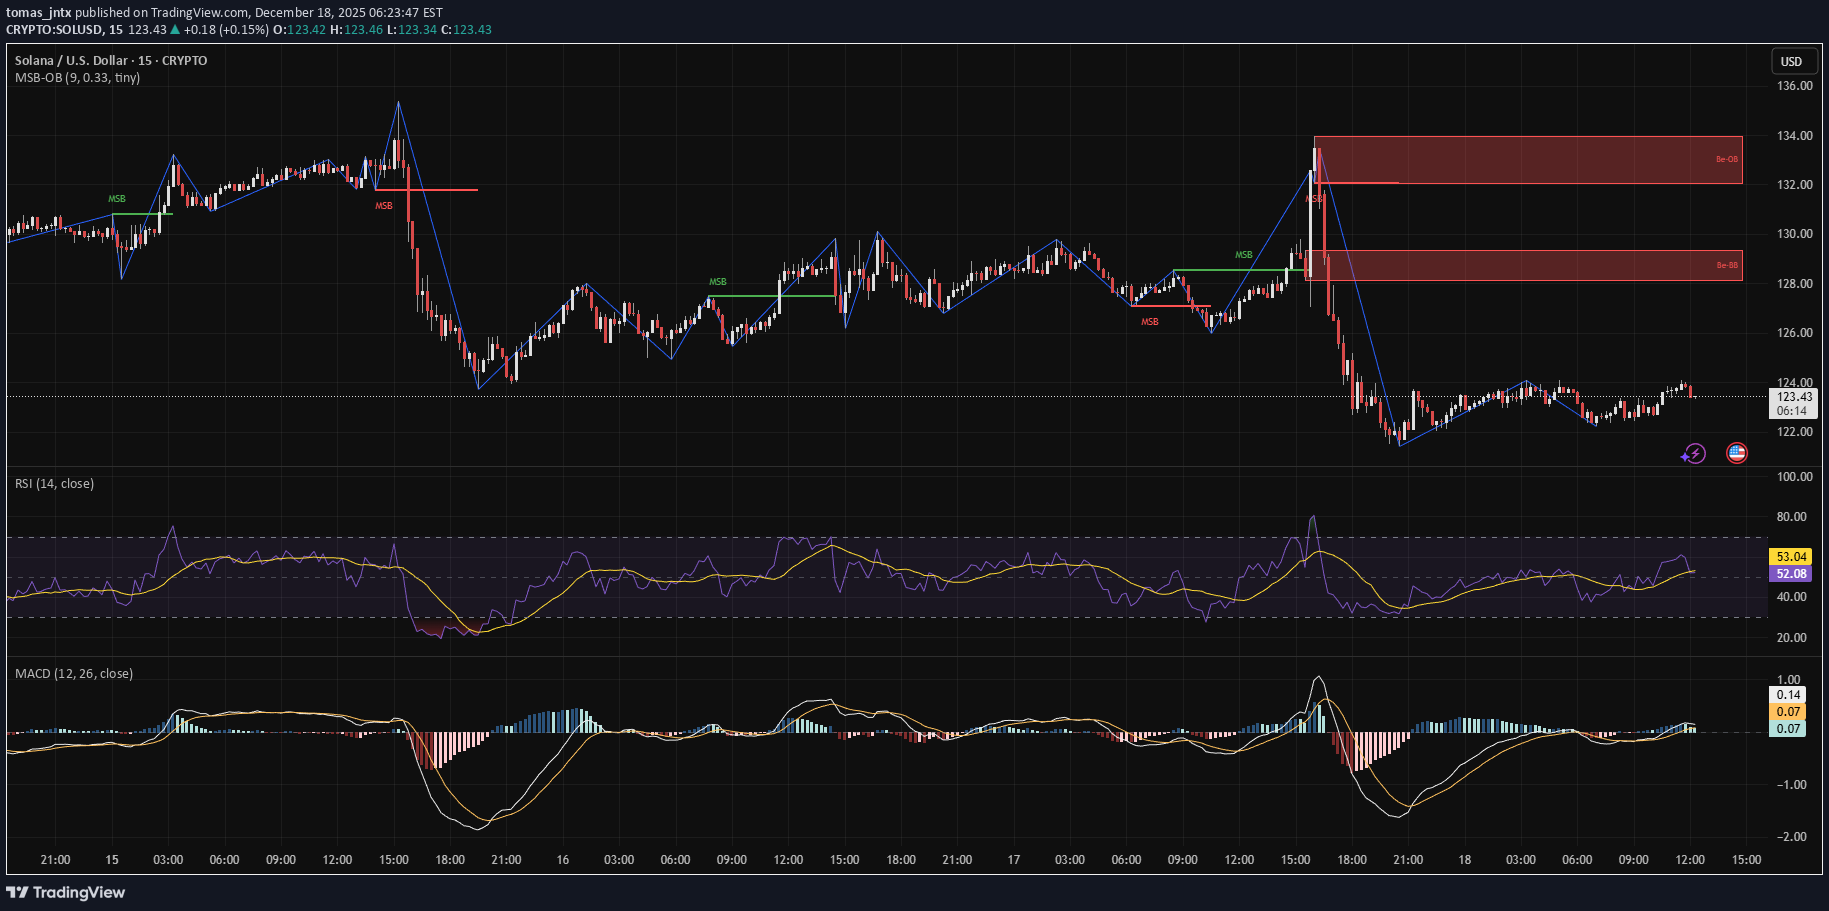
tomas_jntx
Trend Check: SOL printed a bullish MSB but is now running into a heavy supply zone between $128–$132. Indicators: RSI: 56 (neutral to bullish) MACD: Bullish but weakening Structure: Short-term structure flipped bullish, but long-term lower highs remain intact. Needs to clear $128 cleanly for any serious upside. Position: Short bias (until supply breaks) Entry Idea: Short between $127.5–$128.5 Stop: Above $130 Targets: $123.5 → $120 Reasoning: Supply overhead still respected. Until breakout is confirmed, short plays have cleaner RR.
tomas_jntx
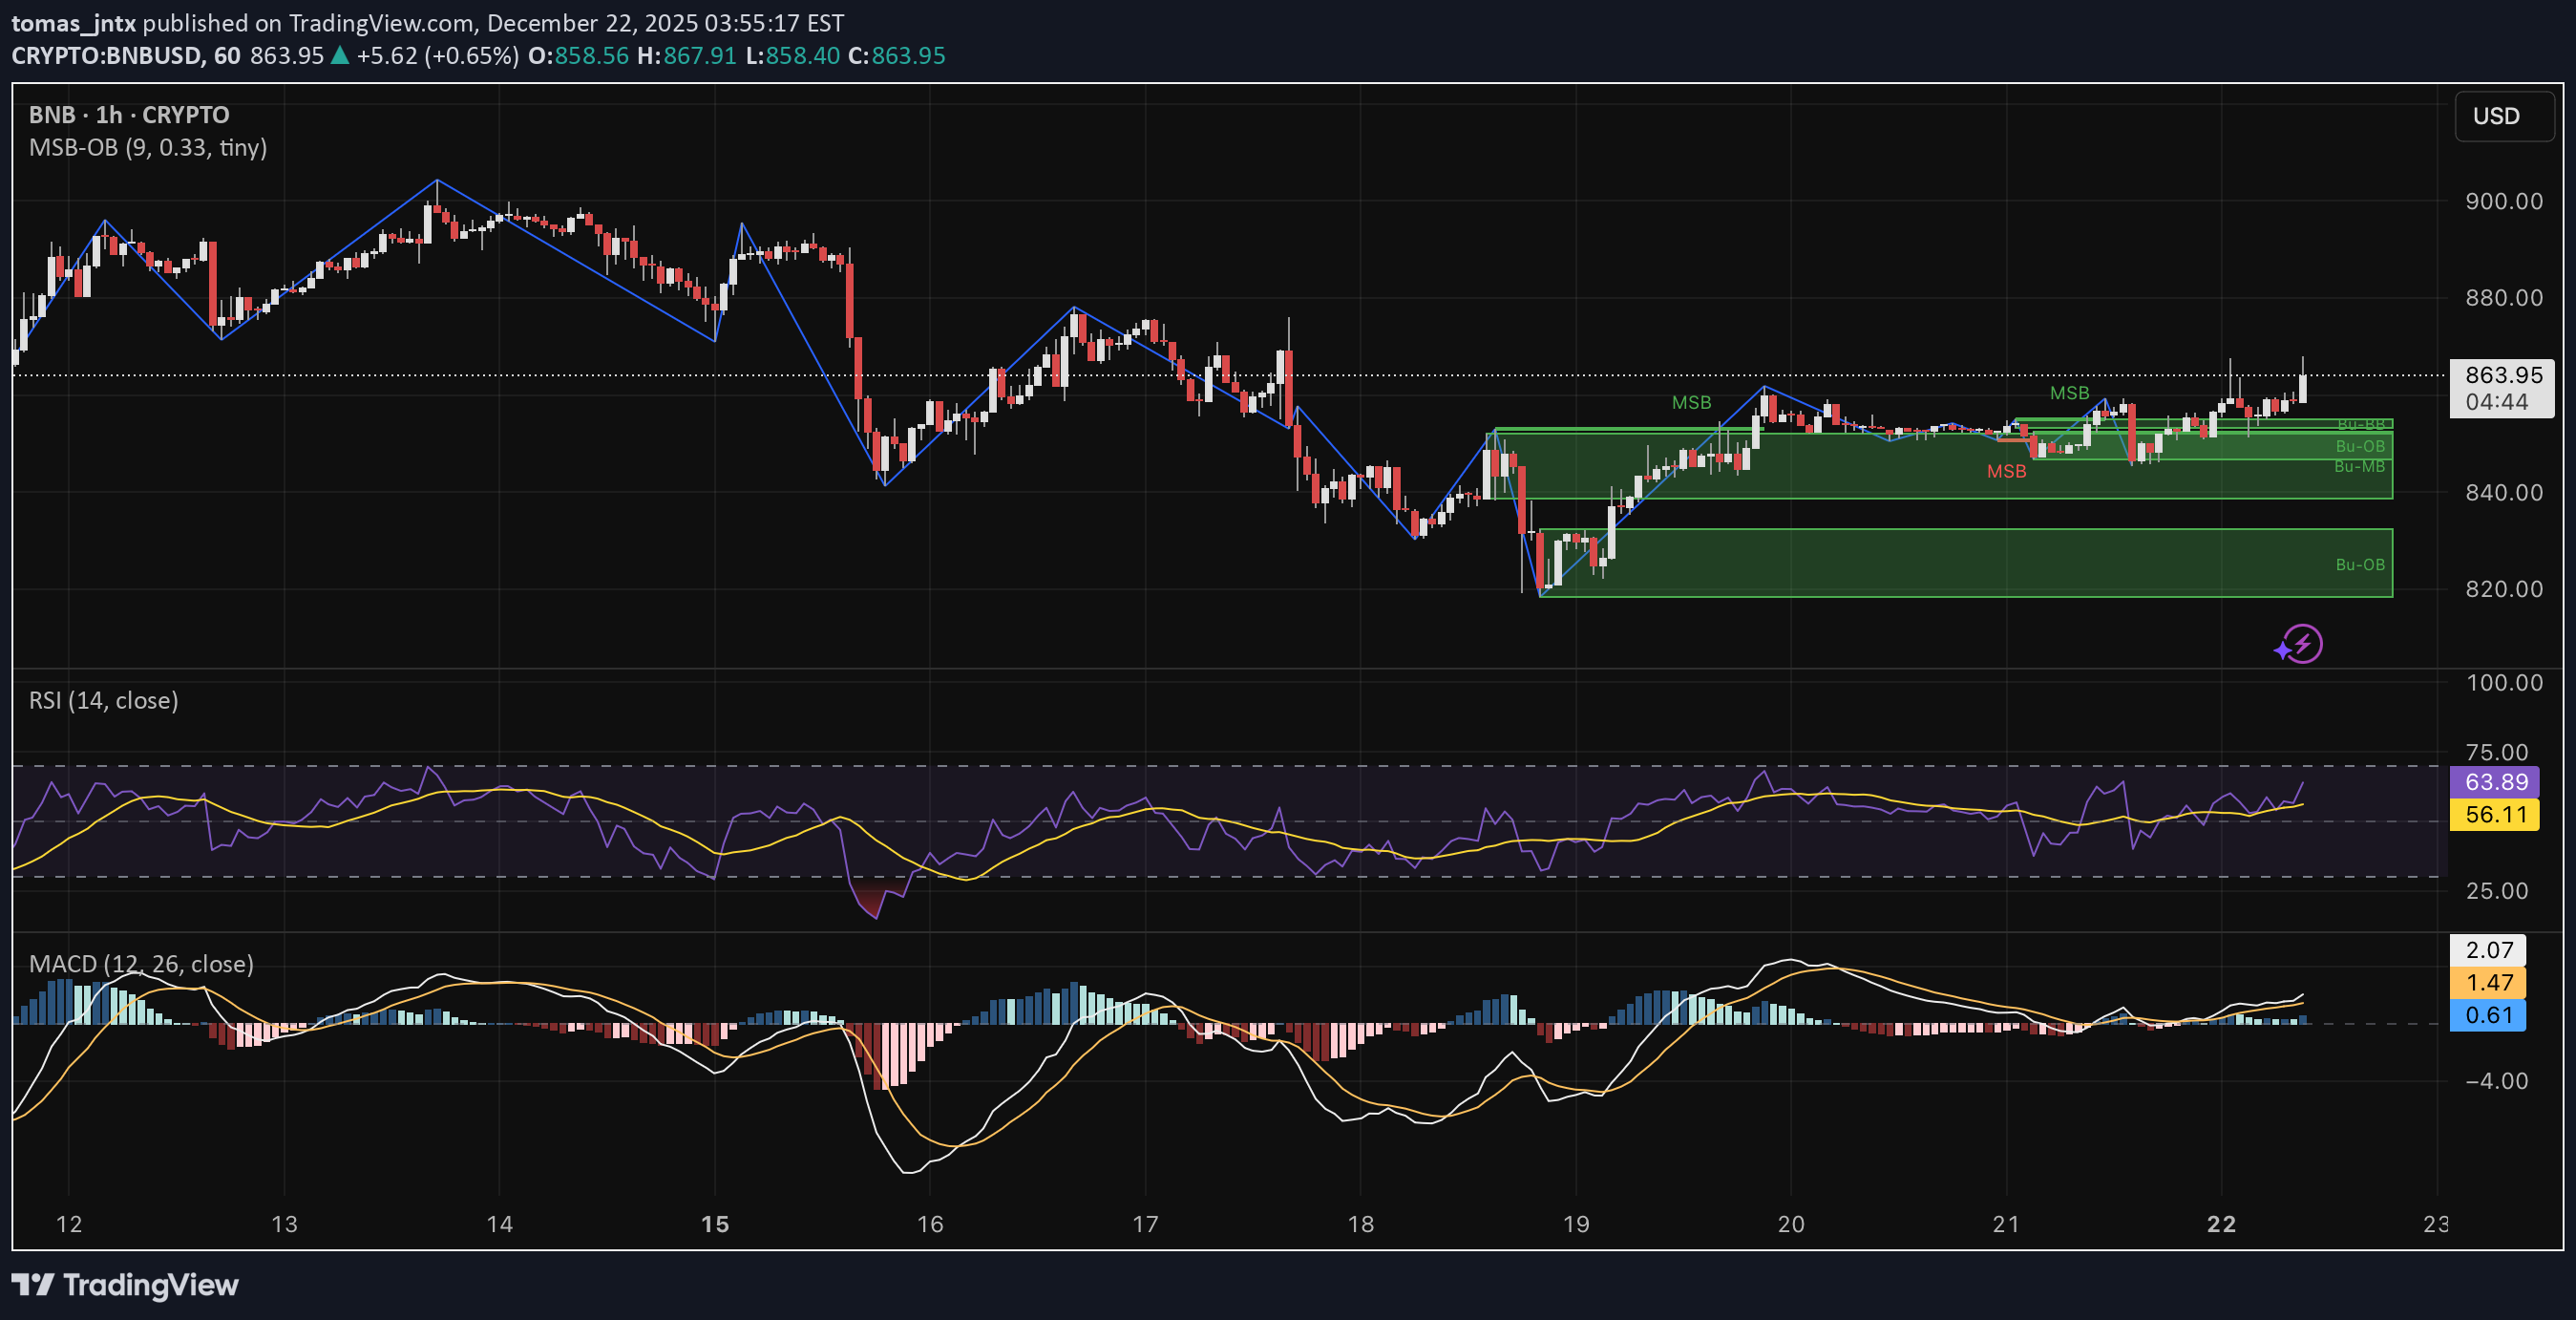
Trend Check: BNB printed a clean bullish MSB and held the OB at $830–$845. Breakout above local structure is now in play. Indicators: RSI: 63 (bullish) MACD: Bullish cross, rising histogram Structure: Price respected higher lows and reclaimed structure after MSB. Looks ready to test previous highs near $880. Position: Long bias Entry Idea: Long on breakout above $865 Stop: Below $850 Targets: $880 → $900 Reasoning: BNB broke key structure and bounced from strong demand. Bullish momentum supports upside continuation.
tomas_jntx
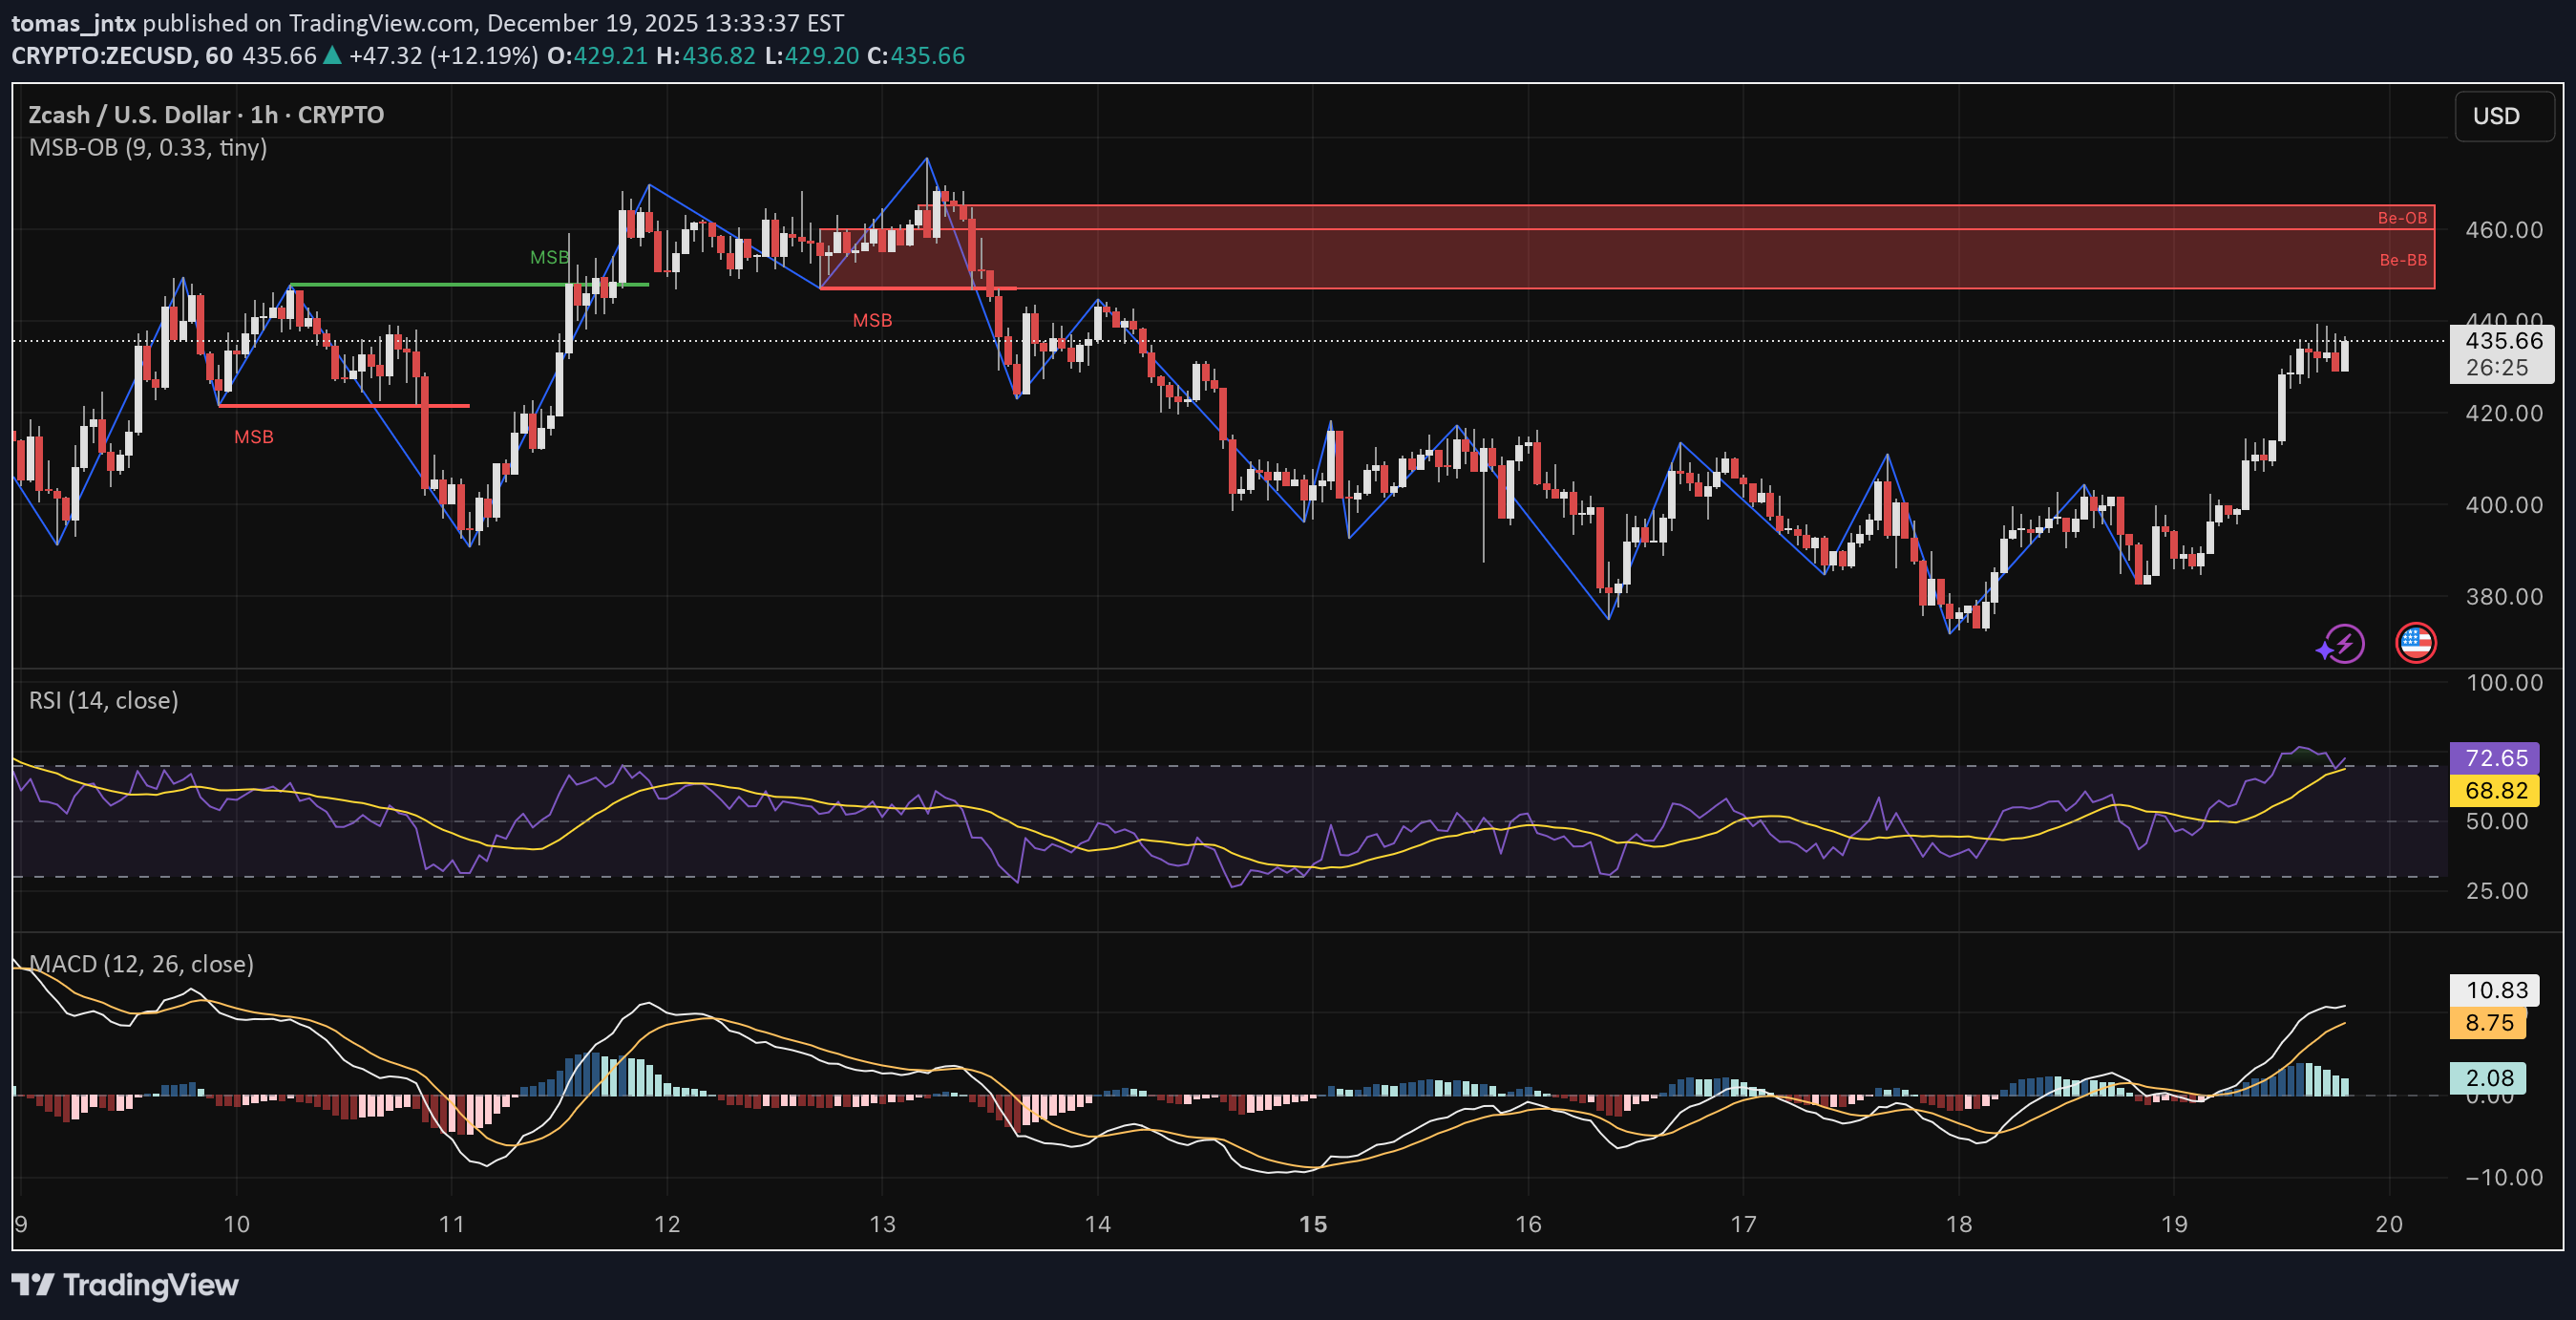
Trend Check: ZEC broke bearish structure and rallied straight into heavy supply. Bulls still control, but RSI is overheated. Indicators: RSI: 72 (overbought) MACD: Strong bullish cross Structure: The rally formed clean HH/HL structure but supply sits at $445–$460. Overextension may trigger profit-taking. Position: Short bias Entry Idea: Short between $445–$455 Stop: Above $460 Targets: $426 → $412 Reasoning: Overbought RSI and vertical pump into HTF supply. Short setup likely unless price cleanly reclaims above.
tomas_jntx
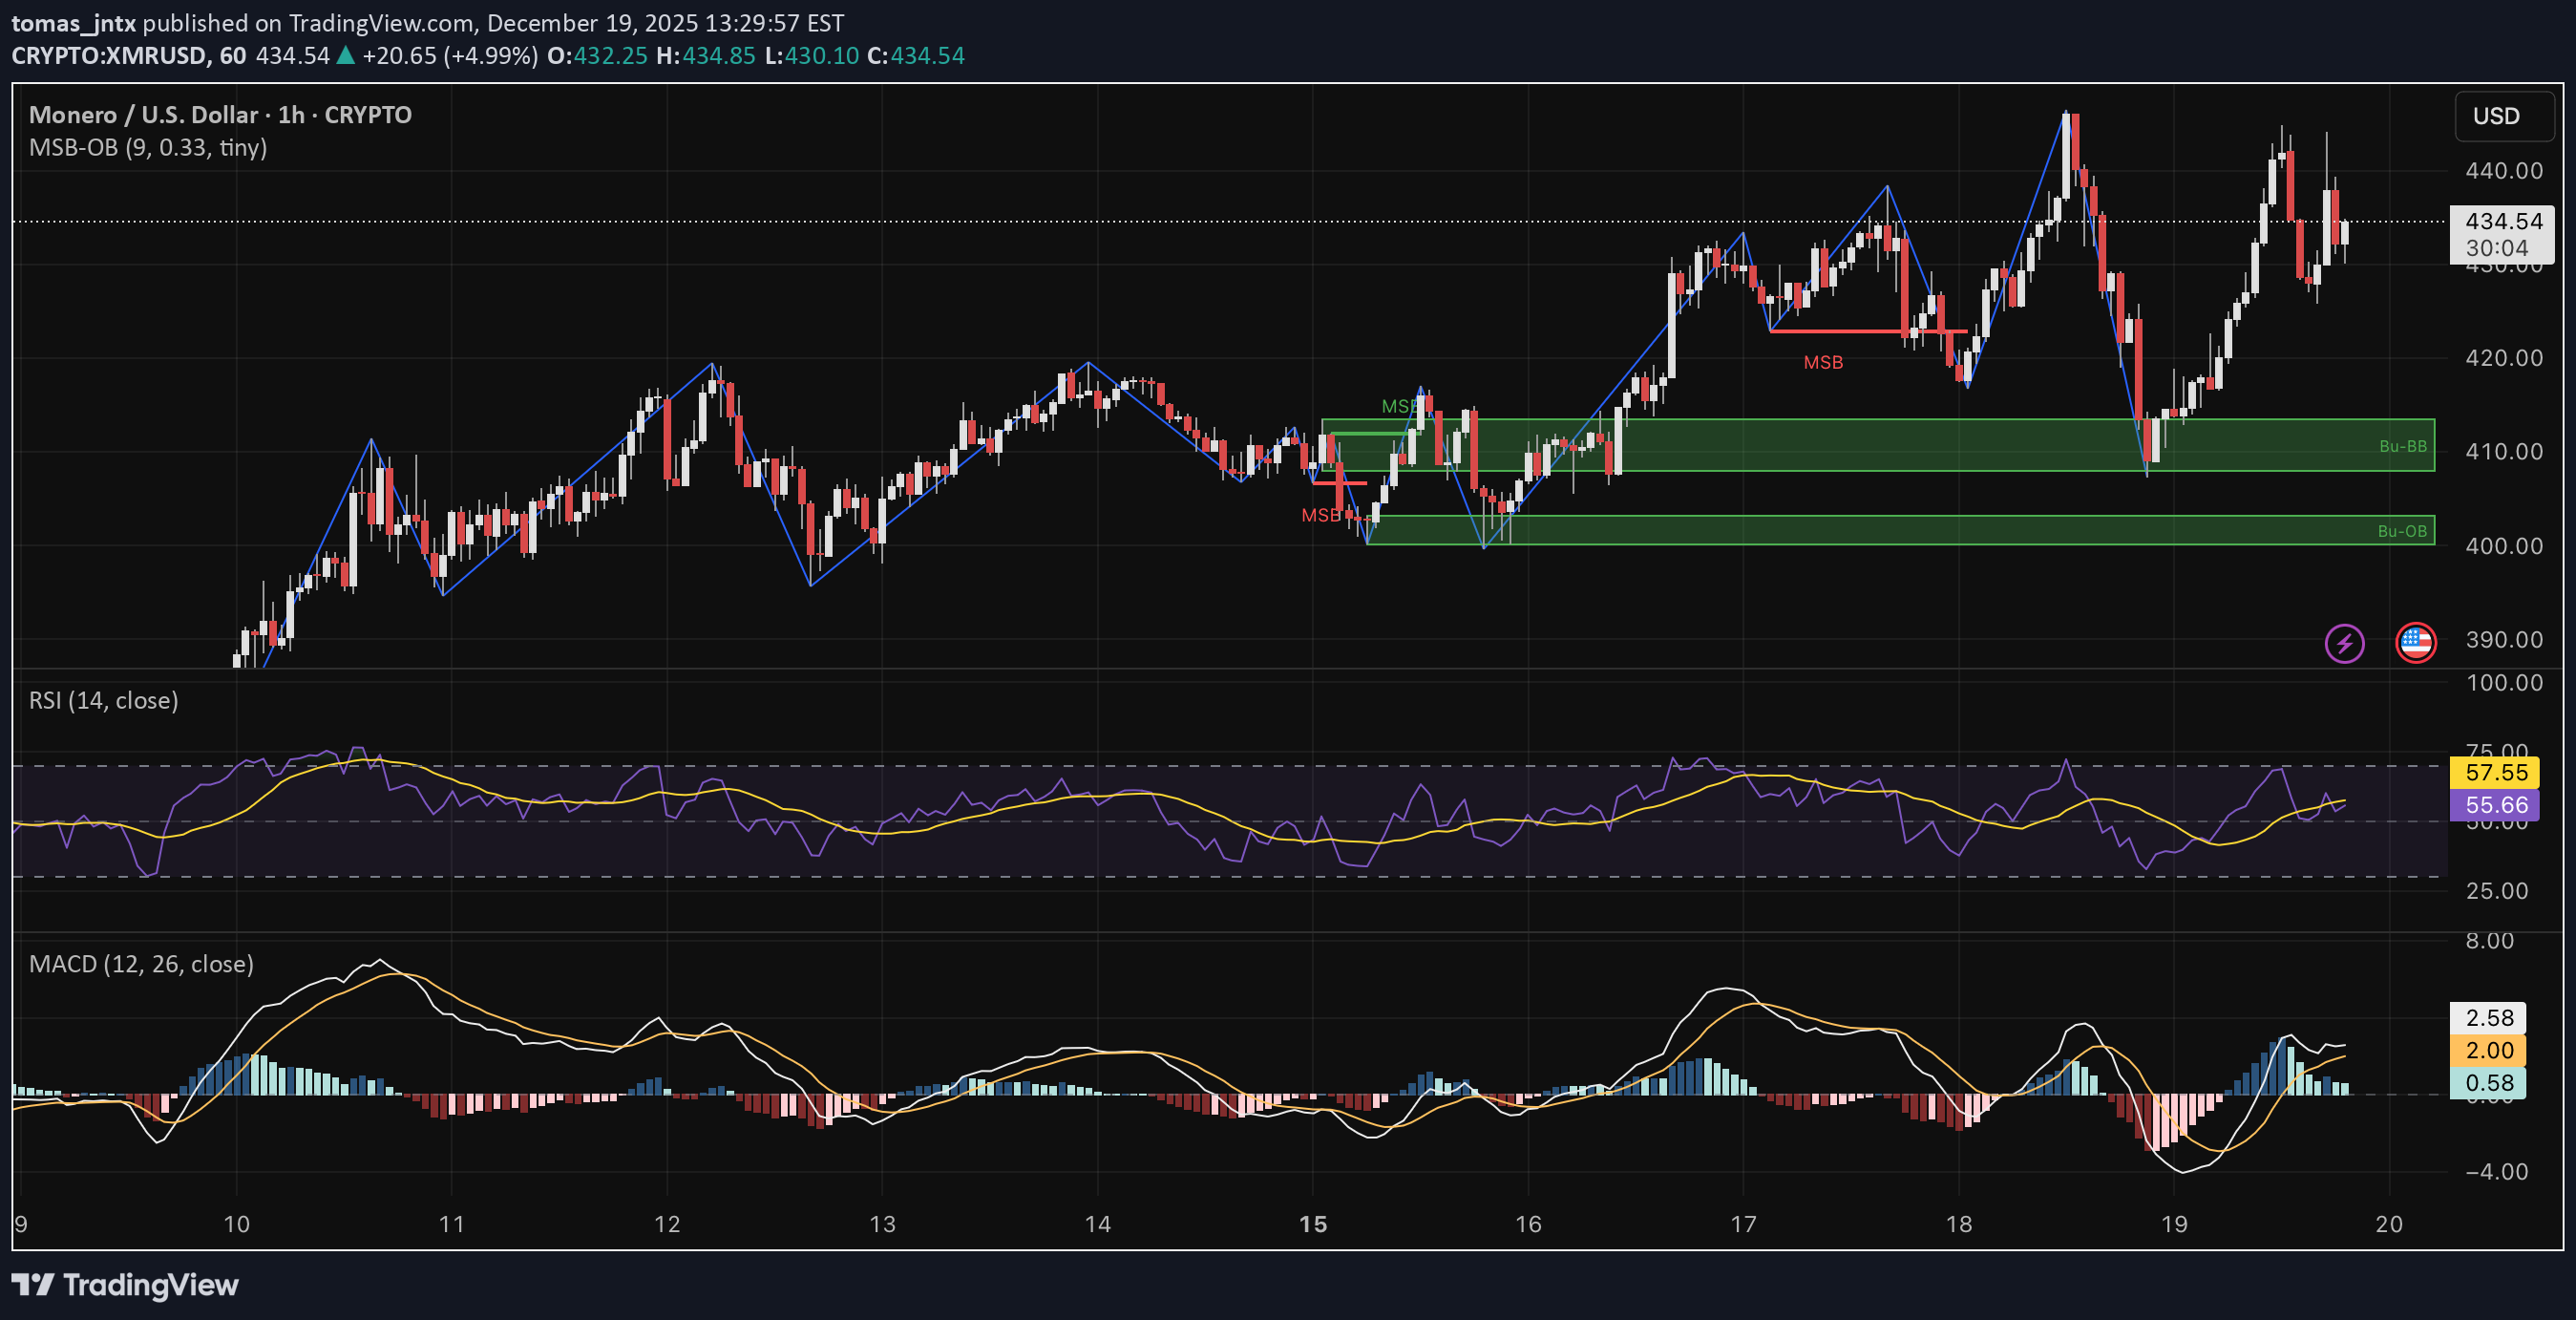
Trend Check: XMR held demand and flipped MSB with strong momentum. Bullish continuation is in play above $420. Indicators: RSI: 57 (bullish) MACD: Bullish with rising histogram Structure: Price broke bearish structure and flipped it bullish after reclaiming demand zones. The current setup favors higher prices. Position: Long bias Entry Idea: Long on retest of $426–$428 Stop: Below $420 Targets: $442 → $456 Reasoning: Demand respected, structure flipped. Momentum indicators support further upside.
tomas_jntx
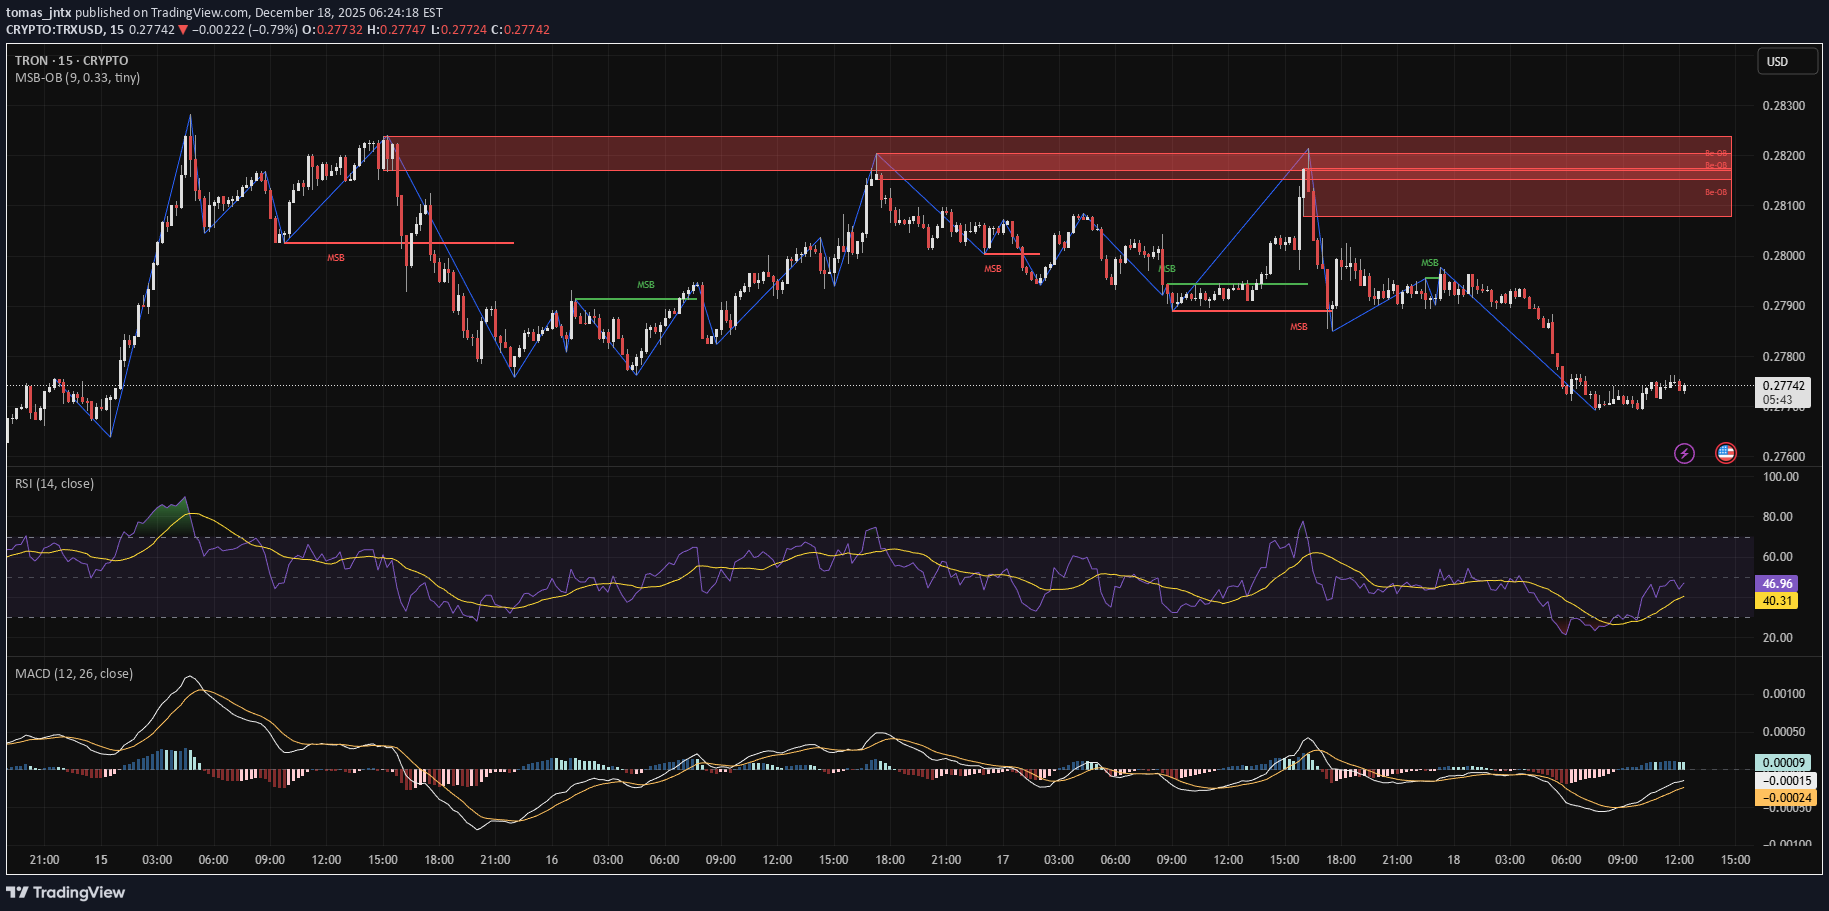
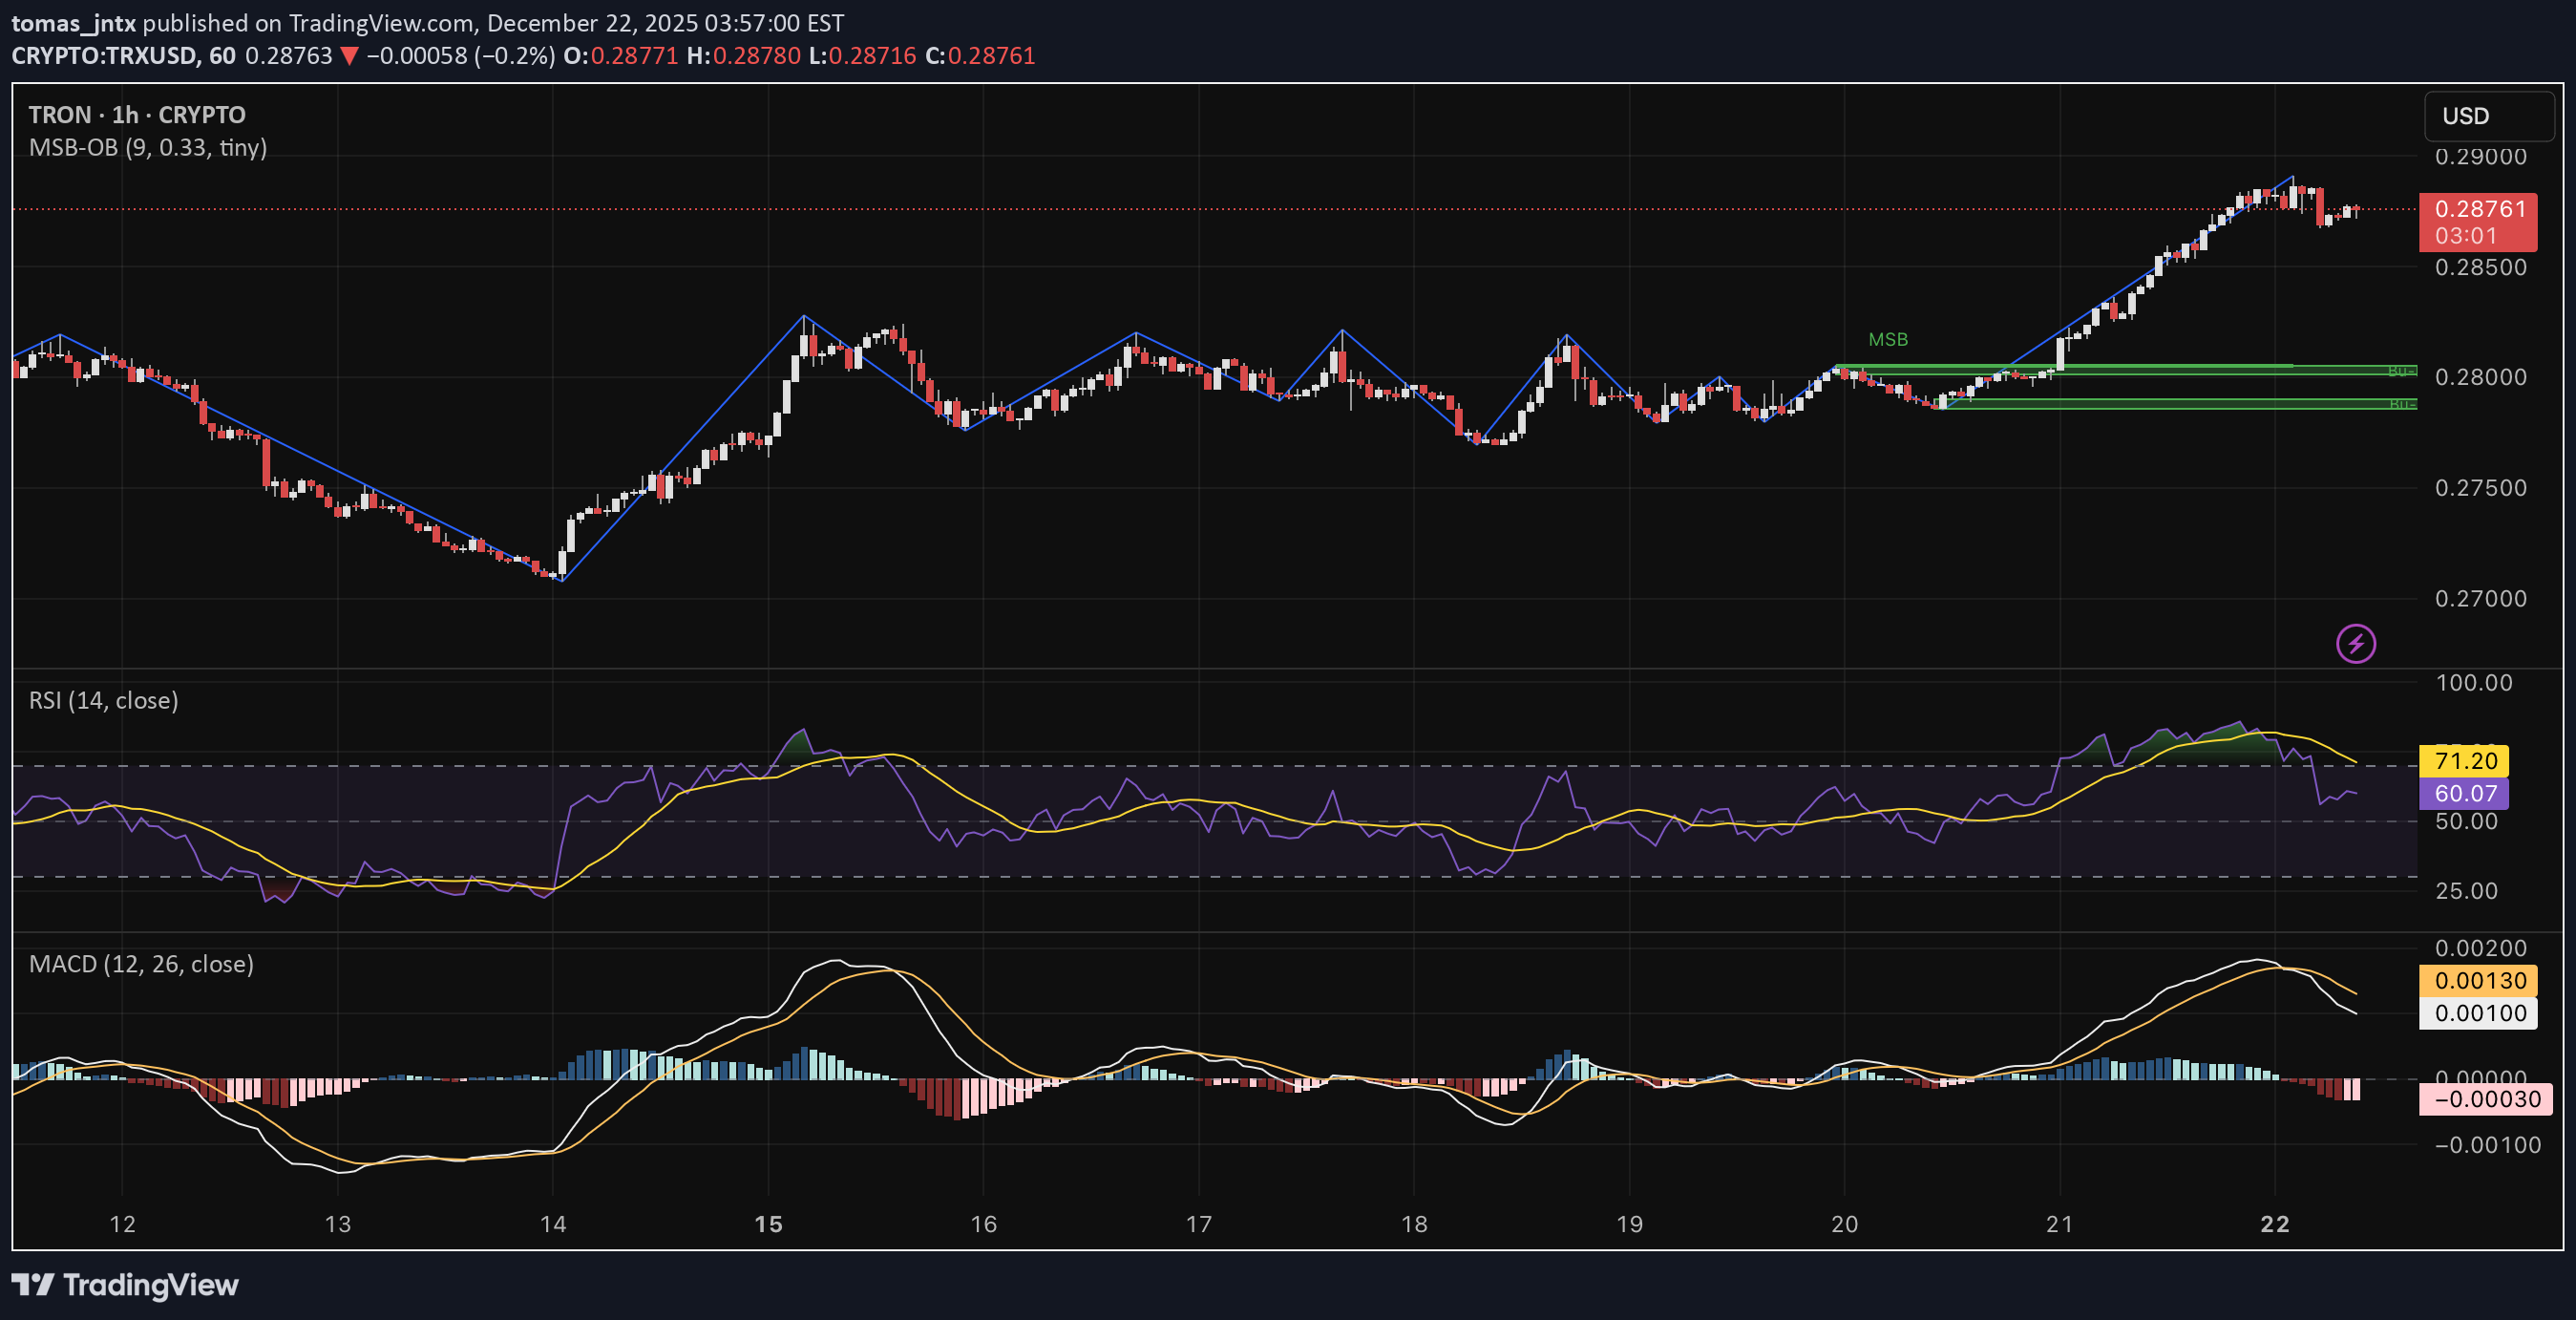
Trend Check: TRX broke multiple bullish MSBs and rejected harshly from 0.282. Current bounce is small and lacks conviction. Indicators: RSI: 38 (bearish bias) MACD: Bearish cross, attempting recovery Structure: After double MSB breaks to the downside, TRX continues pushing lower. Supply is stacked between 0.280–0.283. Position: Short bias Entry Idea: Short if price retests 0.280 Stop: Above 0.283 Targets: 0.274 → 0.269 Reasoning: Structure is broken. Weak relief bounces and strong rejection suggest further downside unless bulls flip key zone.
tomas_jntx
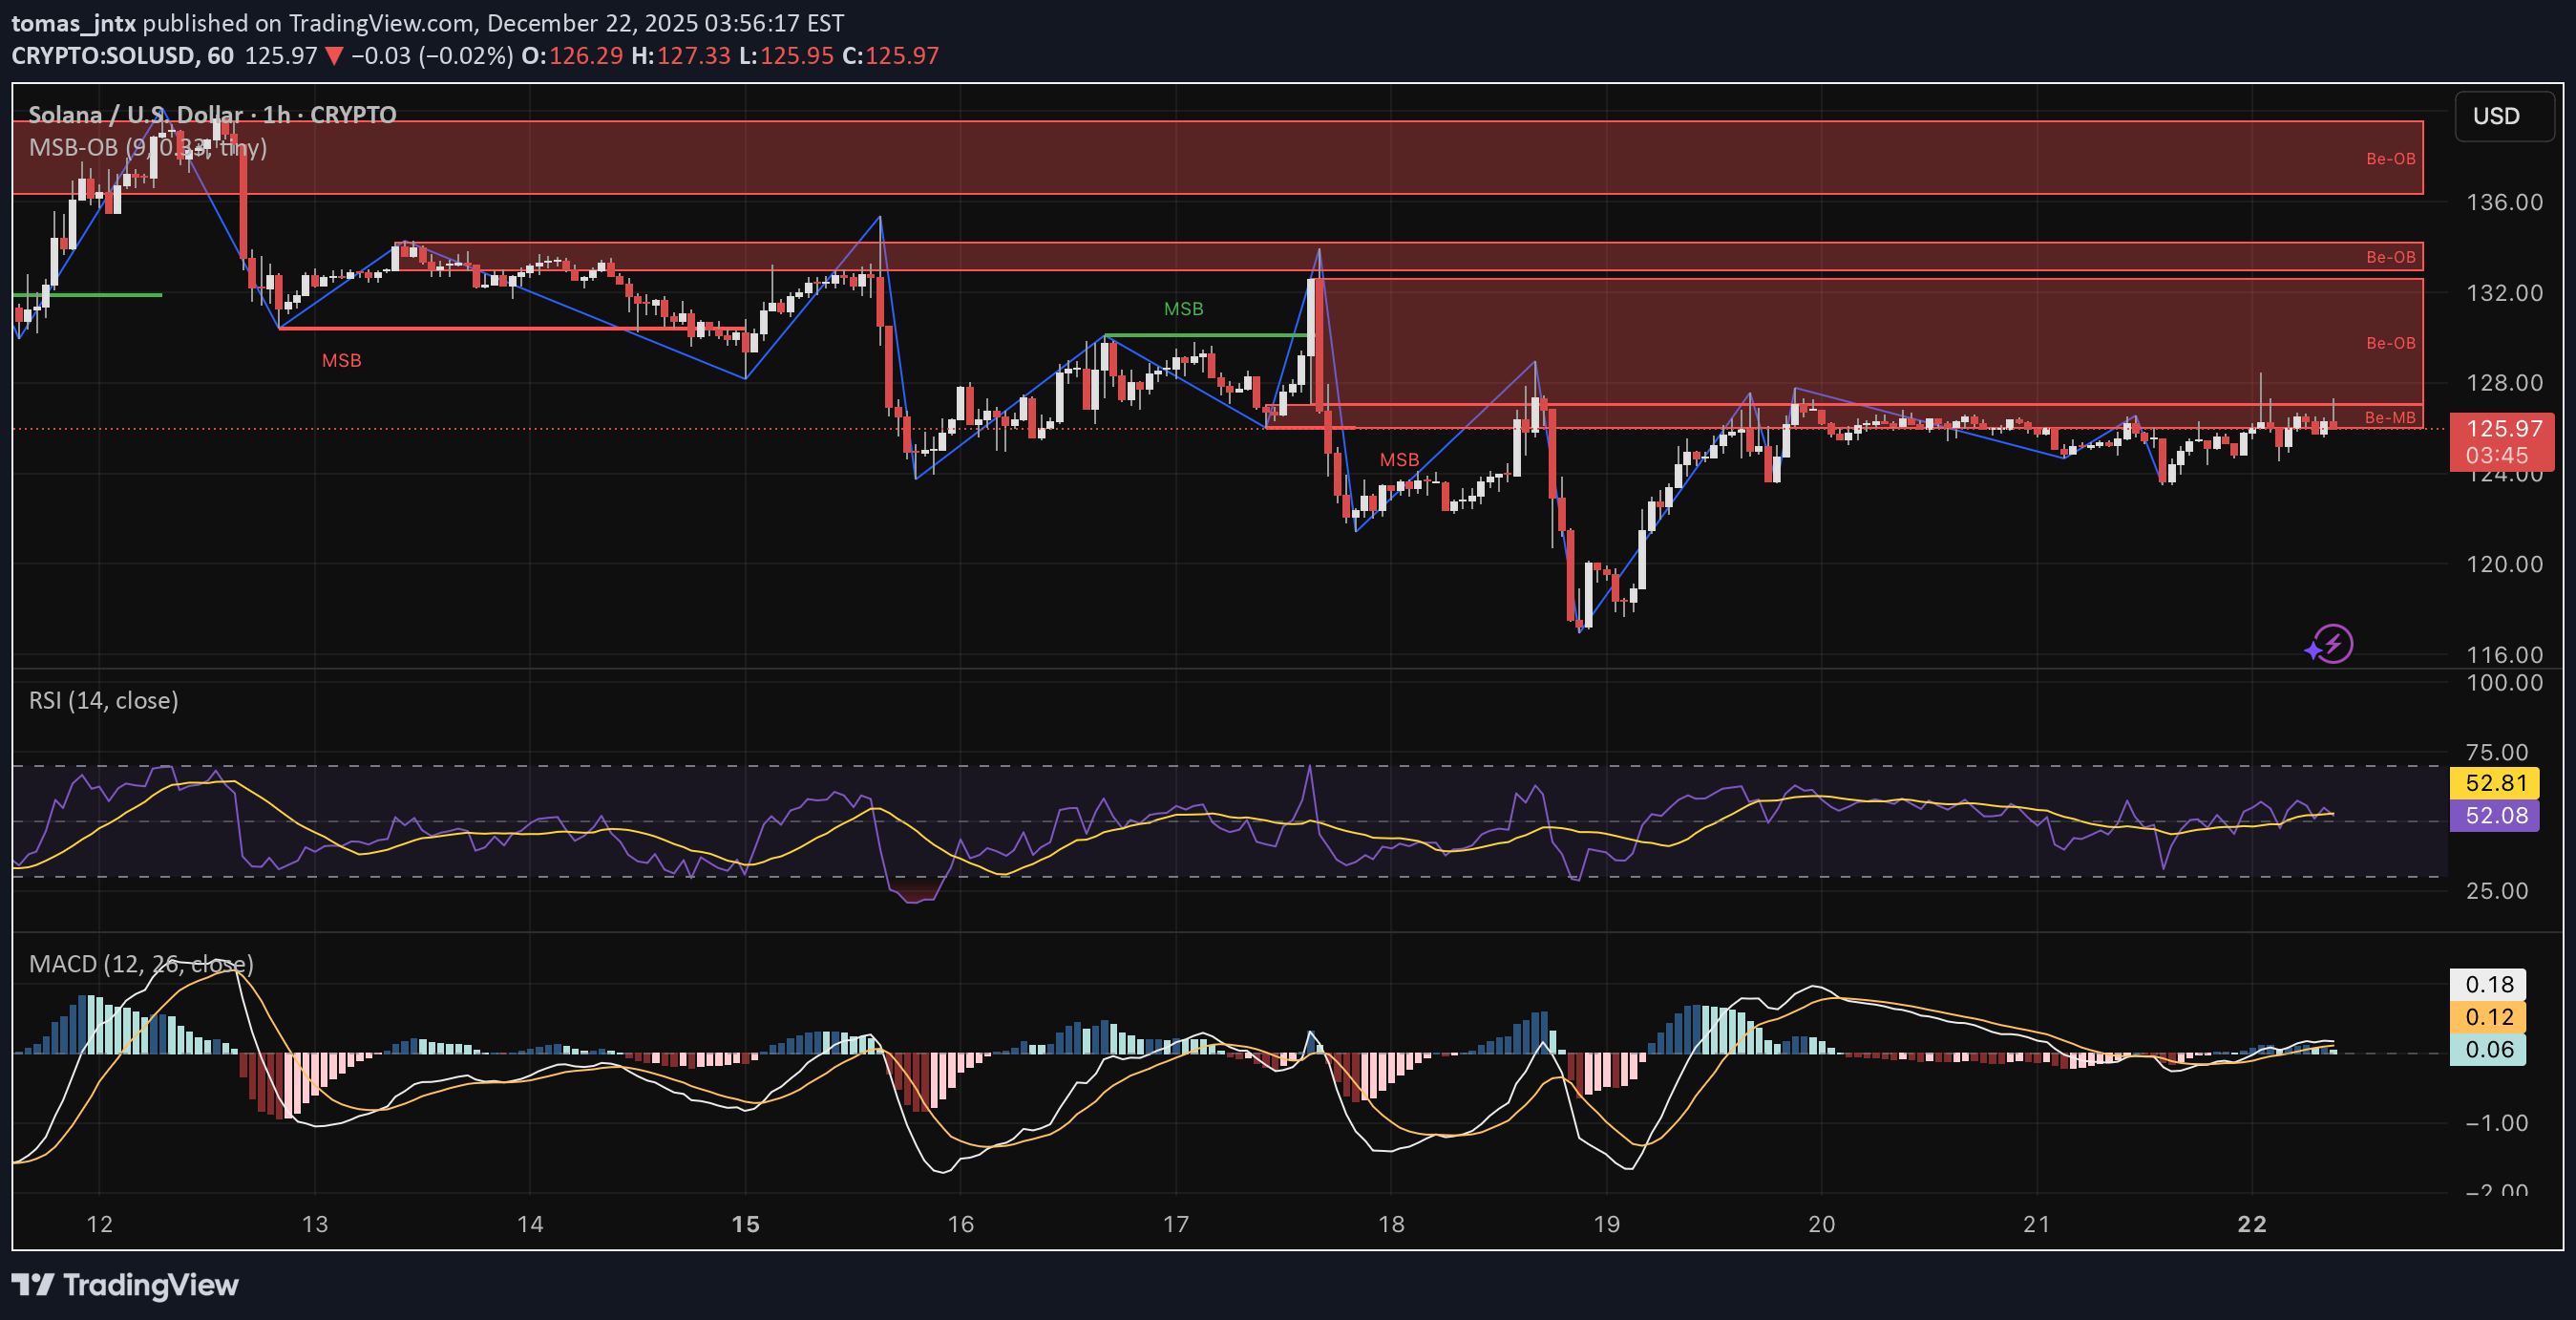
Trend Check: After a sharp move down with an MSB break, SOL retraced back into supply. Price now stabilizes just below key resistance. Indicators: RSI: 58 (slightly bullish) MACD: Bullish cross, weak momentum forming Structure: SOL is bouncing after a dump into lower structure. Supply at $130–$133 remains untouched and dominant. For bulls to flip trend, a reclaim above this zone is needed. Position: Short bias Entry Idea: Short between $128–$130 Stop: Above $133 Targets: $121 → $117.5 Reasoning: Sharp MSB followed by weak rebound into fresh supply. Trend favors short setups until structure changes.
tomas_jntx
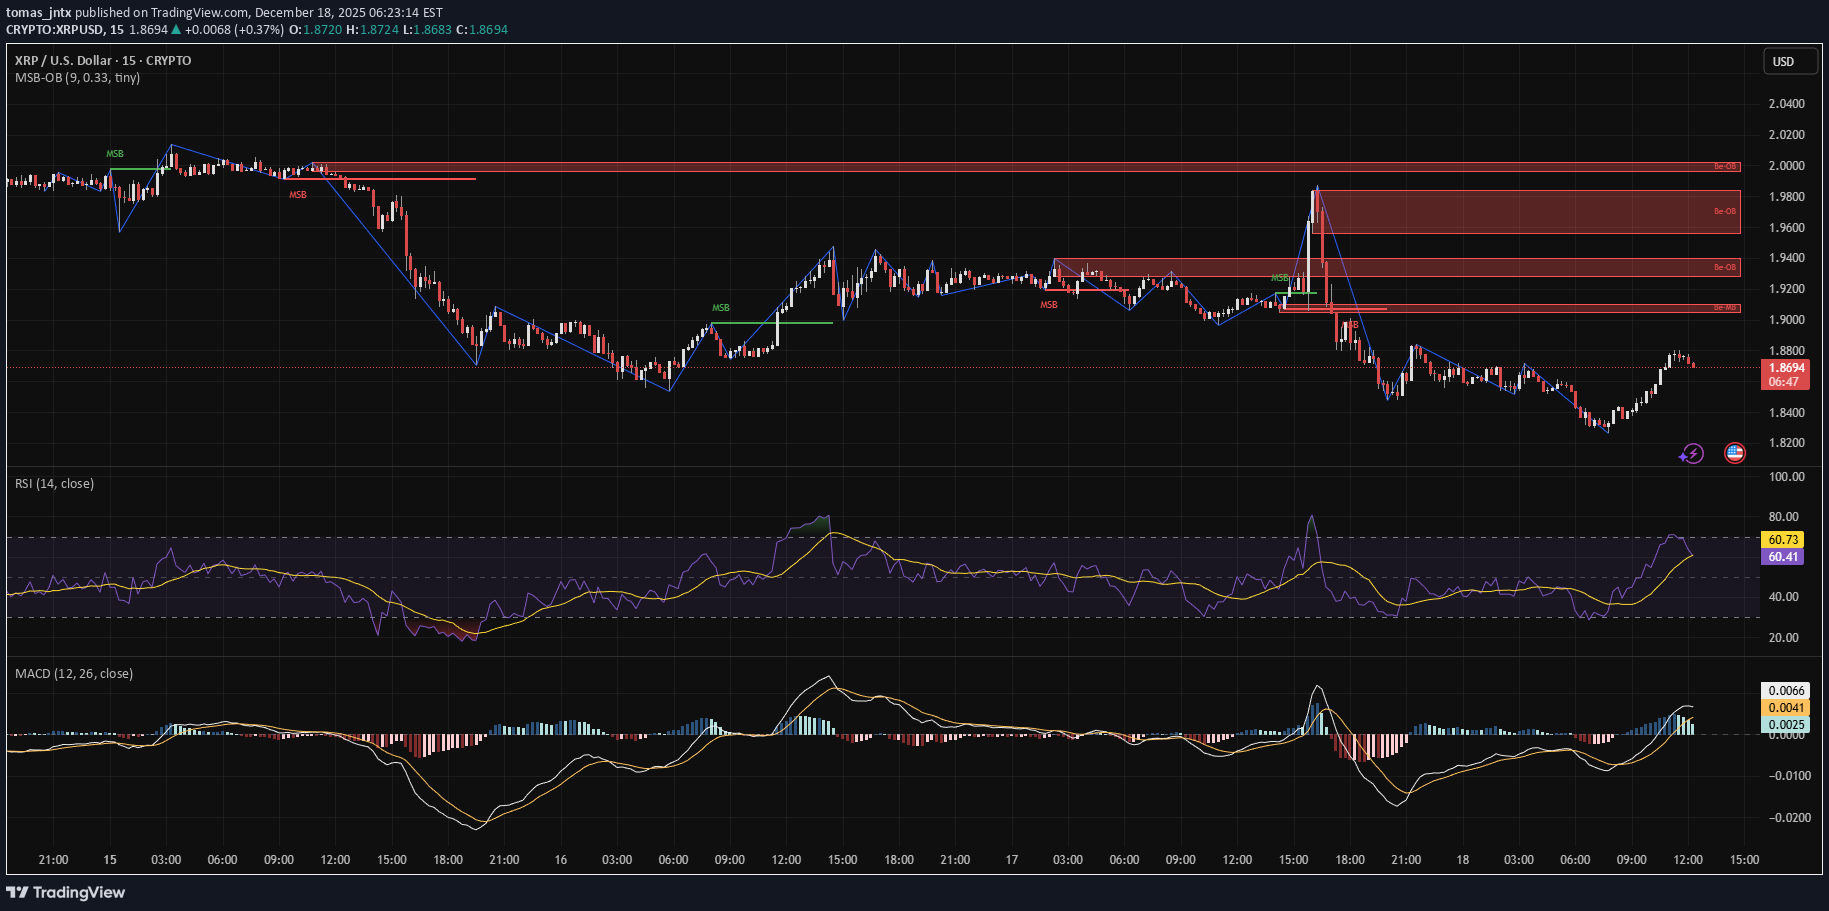
Trend Check: XRP had a fake MSB breakout into massive supply before dumping hard. Price now pulls back into resistance again. Indicators: RSI: 68 (overbought) MACD: Strong bullish cross but stalling Structure: Short-term uptrend shows strength but enters heavy supply. Structure above $1.92 must flip for a clean bullish trend. Position: Short bias Entry Idea: Short $1.89–$1.92 Stop: Above $1.96 Targets: $1.83 → $1.78 Reasoning: RSI nearing overbought. Into supply after a fake MSB run. If rejection follows, lower targets likely.
tomas_jntx
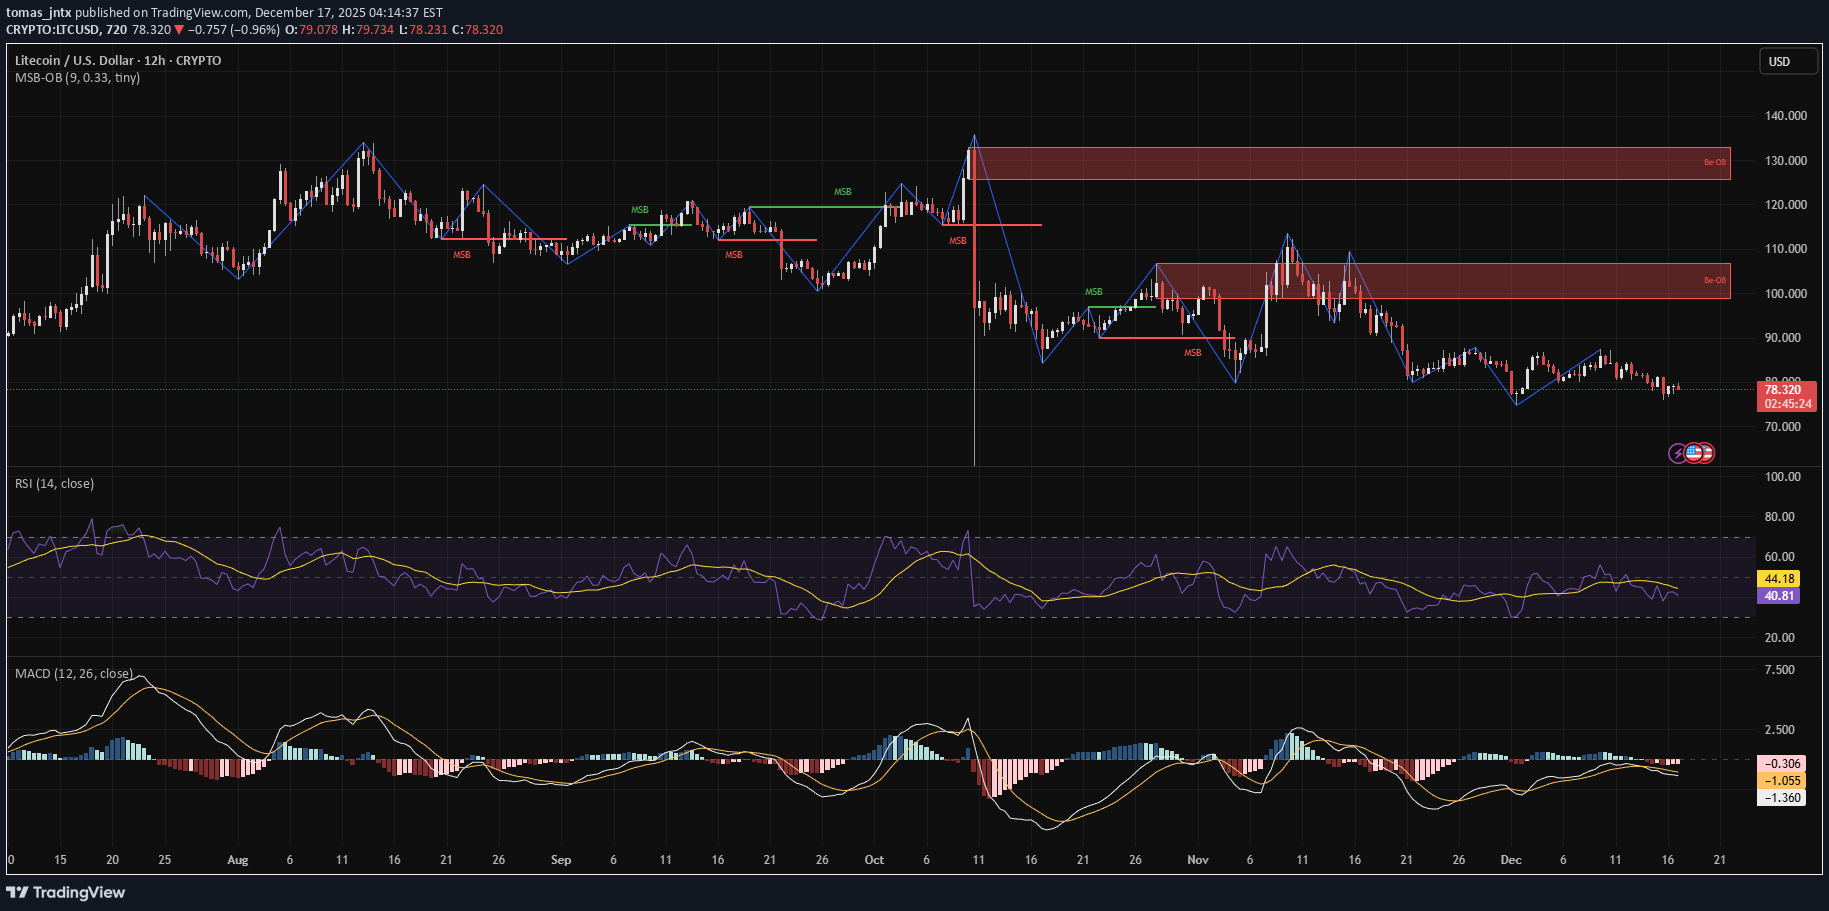
Trend Check: LTC has flipped bearish again with a strong MSB down and no bullish reclaim since. Price is trending lower with failed reactions to resistance. Indicators: RSI: 40 (bearish) MACD: Bearish momentum, widening cross Structure: After multiple bearish MSBs and rejection from the $88–$90 area, LTC looks weak. No demand reaction yet. Position: Short bias Entry Idea: Short below $77.5 Stop: Above $80 Targets: $73 → $68 Reasoning: Structure favors sellers. Indicators show momentum supports the trend — bearish continuation likely unless bulls step in fast.
Disclaimer
Any content and materials included in Finbeet's website and official communication channels are a compilation of personal opinions and analyses and are not binding. They do not constitute any recommendation for buying, selling, entering or exiting the stock market and cryptocurrency market. Also, all news and analyses included in the website and channels are merely republished information from official and unofficial domestic and foreign sources, and it is obvious that users of the said content are responsible for following up and ensuring the authenticity and accuracy of the materials. Therefore, while disclaiming responsibility, it is declared that the responsibility for any decision-making, action, and potential profit and loss in the capital market and cryptocurrency market lies with the trader.