
tradecitypro
@t_tradecitypro

What symbols does the trader recommend buying?
Purchase History
Trader Messages
Filter
Message Type
tradecitypro
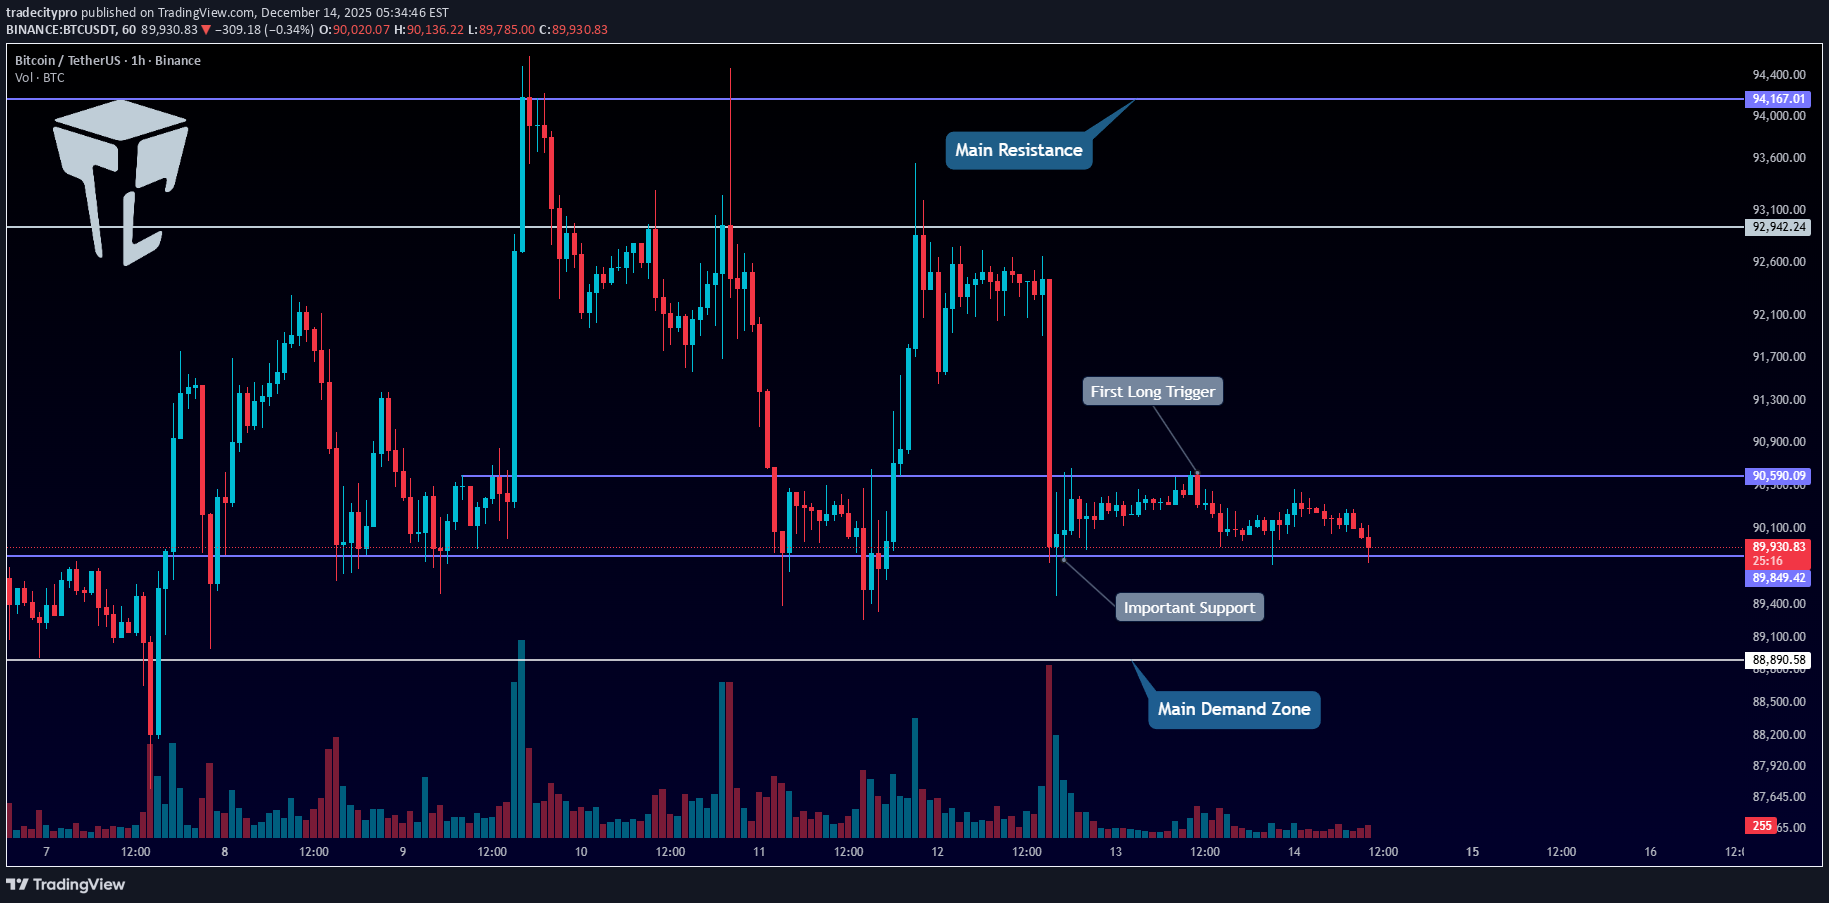
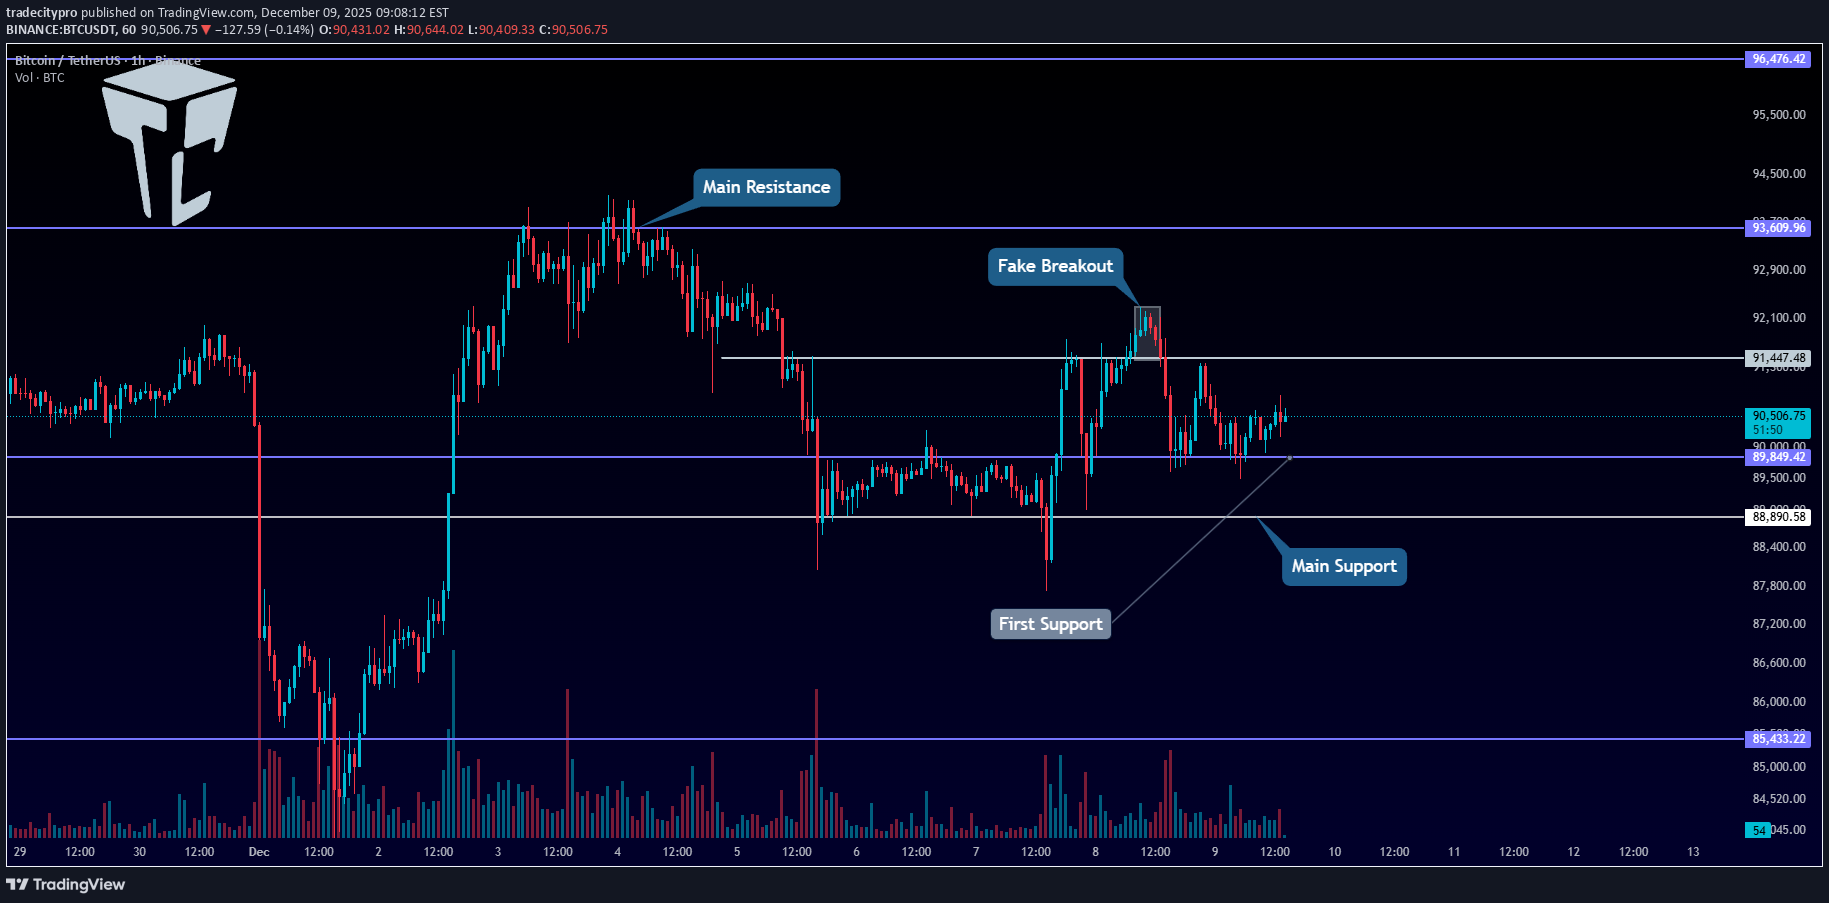
👋 Welcome to TradeCity Pro! Let’s move on to Bitcoin analysis; the market hasn’t changed much since yesterday and is still ranging. ⏳ 1-Hour Timeframe Bitcoin is still in the range box between 89,849 and 90,590, and just like yesterday, it is fluctuating between these two zones today. ✔️ Today, the probability of movement during the New York session is high because Bitcoin is in a very small compression, and breaking this compression from either side can give us a position. 📊 Volume has decreased even further since yesterday, and this is another sign that a move is close. So, if volume enters and triggers are activated, a sharp move in Bitcoin could begin. ⭐ Today, we can open a short position after breaking the 89,849 zone. 🎲 The main short trigger is still 88,890, and breaking 89,849 will be the precursor to that. ↗️ For a long position, breaking 90,590 is a good trigger.We will get the main confirmation of Bitcoin turning bullish after a stabilization above 92,942 and 94,167. 💧 Today, any movement Bitcoin makes in either direction, if accompanied by increased volume, could continue. ✨ But if we see volume divergence, the likelihood of a fakeout increases. ❌ Disclaimer ❌ Trading futures is highly risky and dangerous. If you're not an expert, these triggers may not be suitable for you. You should first learn risk and capital management. You can also use the educational content from this channel. Finally, these triggers reflect my personal opinions on price action, and the market may move completely against this analysis. So, do your own research before opening any position.
tradecitypro
TradeCityPro | FET Testing Key Range, Bears in Control for Now
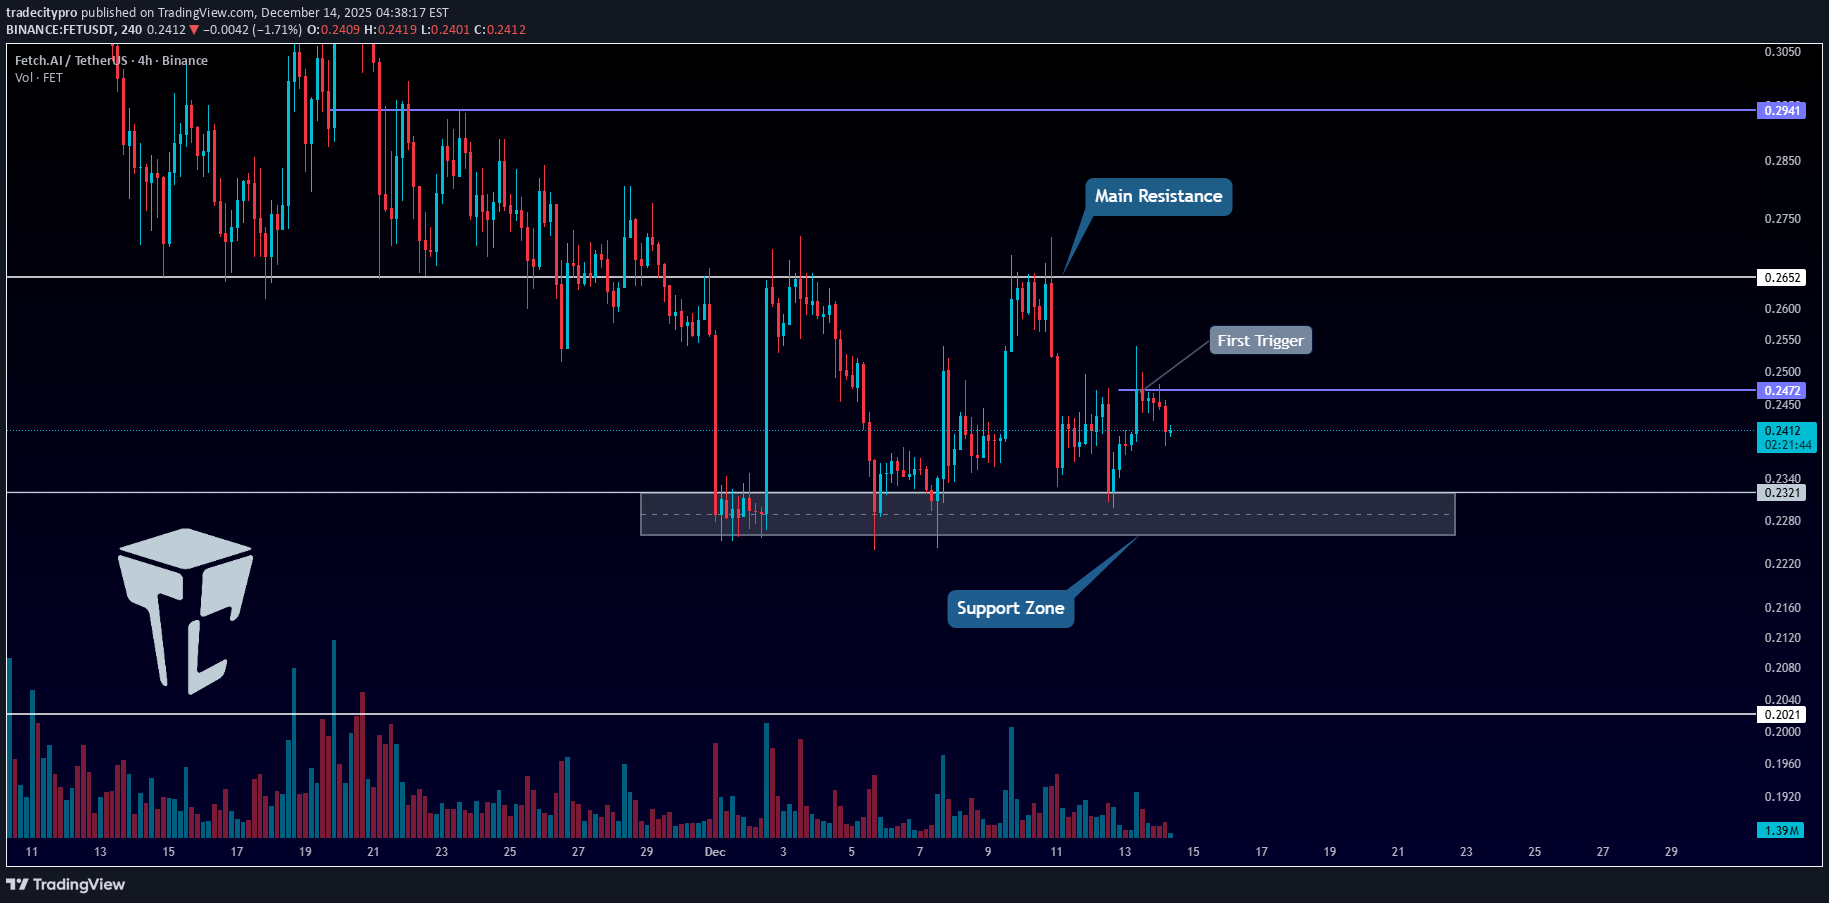
👋 Welcome to TradeCity Pro! In this analysis, I want to review FET, one of the AI projects, which with a market cap of $558 million is ranked 80th on CoinMarketCap. ⏳ 4-hour timeframe On the 4-hour timeframe, this coin is ranging between the zones 0.2321 and 0.2652. 💥 The overall trend for FET is currently bearish, but the price is now ranging between these two zones and forming a new structure. ⚡️ After the last time the price reached 0.2652, it got rejected, and volume started decreasing, and it is still decreasing. ✔️ The bottom of the range can also be considered as a support zone. Breaking this zone would be a very good trigger for a short position, and the price could move towards 0.2021 after breaking this level. 🎲 The middle line of the range is at 0.2472, and breaking this level will give us a early long trigger. ✨ The next level we can open the main long position after breaking is 0.2652. 📝 Final Thoughts Stay calm, trade wisely, and let's capture the market's best opportunities! This analysis reflects our opinions and is not financial advice. Share your thoughts in the comments, and don’t forget to share this analysis with your friends! ❤️
tradecitypro
TradeCityPro | CRVUSDT Altcoin Ready to Move!
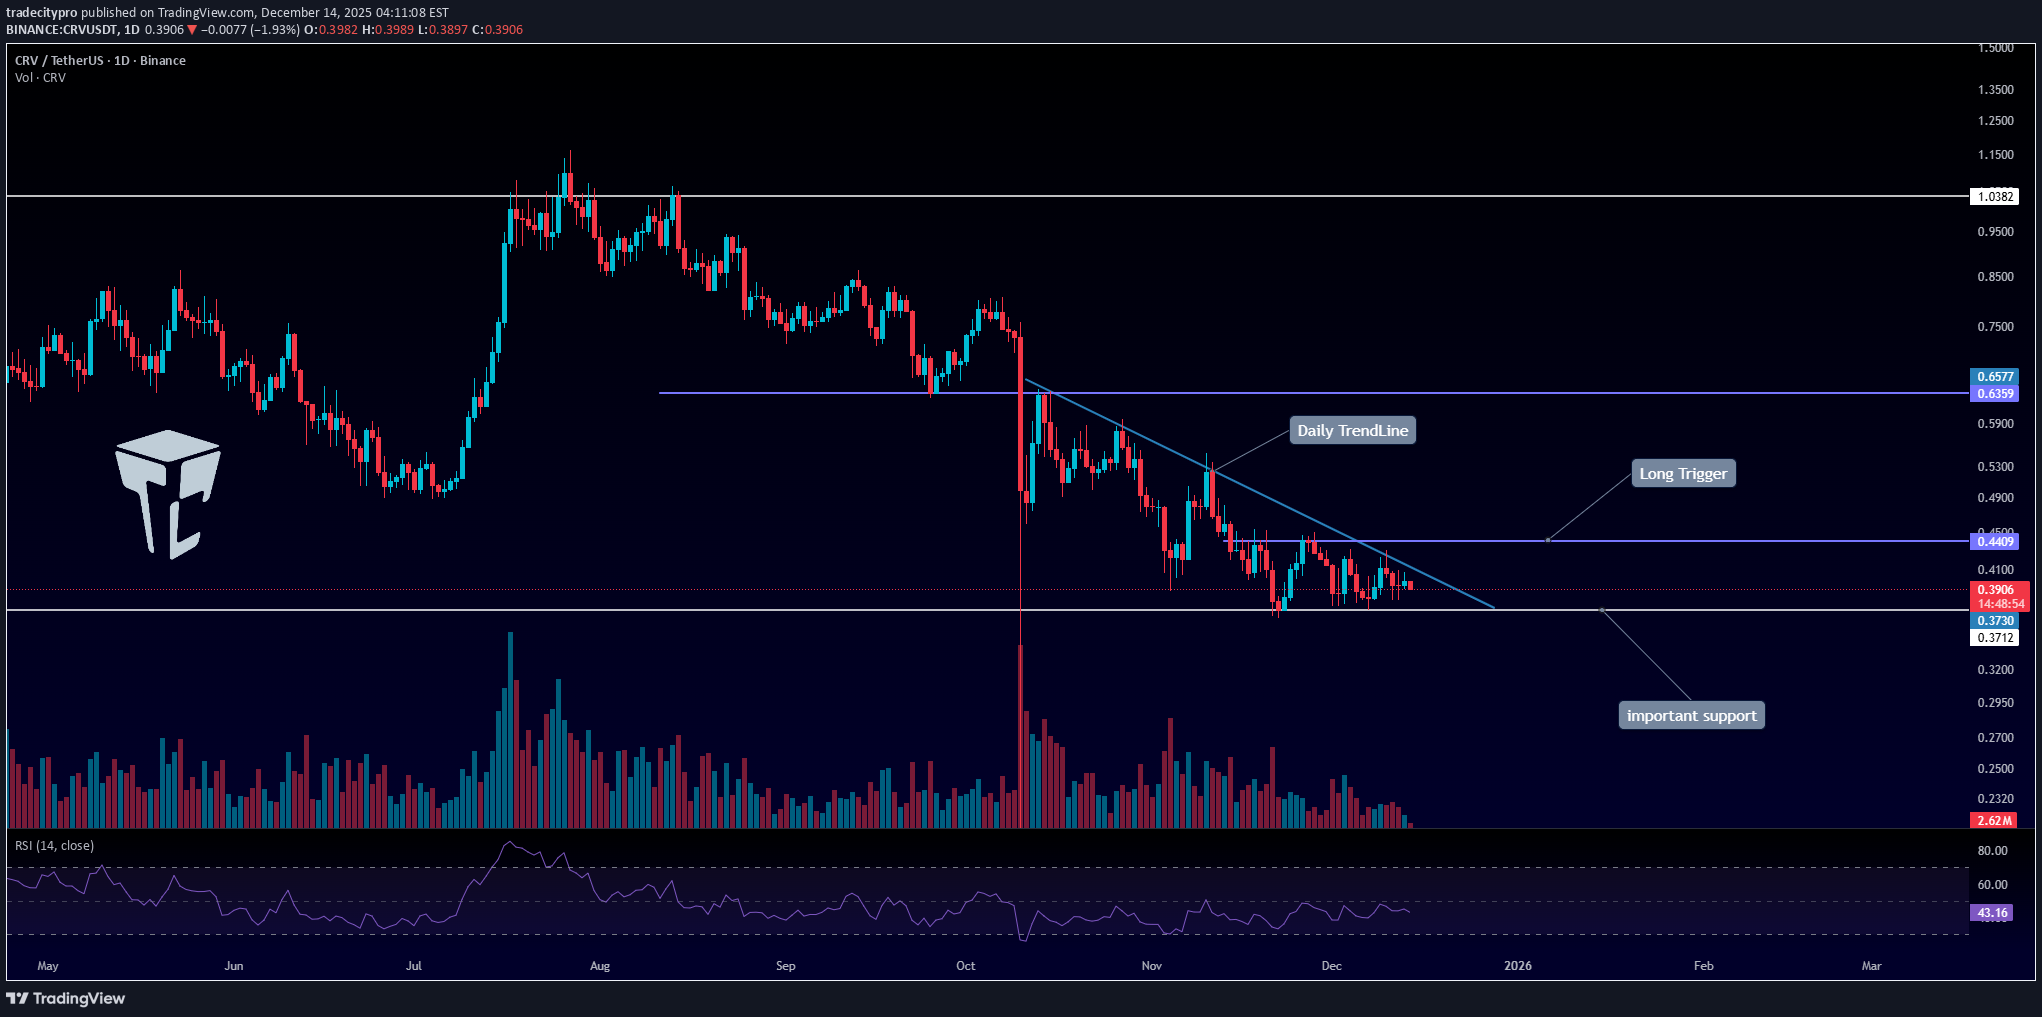
👋 Welcome to TradeCityPro! Let’s move on to today’s whale-favored coin, CRV, which is widely used by Ethereum whales for governance voting and participation in key decision-making processes. 🌐 Bitcoin Overview Before we begin, let me remind you once again that at your request, we’ve moved the Bitcoin analysis section to a dedicated daily report — allowing us to analyze Bitcoin’s trend, dominance, and overall market sentiment in greater depth each day. On the daily timeframe, after getting rejected from $1.03, we saw a corrective move and price settled calmly on the $0.6359 support. After breaking this support, price moved down toward the $0.3712 support, and we are currently forming lower highs, which has resulted in the formation of a reversal-type trendline. For long positions, if the daily trendline is broken and the $0.4409 trigger is activated, we can look to open a long position on the breakout of this level. For short positions, our entry triggers are clearly defined on the chart. With a break below $0.3730, we can open a short position, and a rejection from the trendline can also provide an early short trigger. 📝 Final Thoughts Stay calm, trade wisely, and let's capture the market's best opportunities! This analysis reflects our opinions and is not financial advice. Share your thoughts in the comments, and don’t forget to share this analysis with your friends! ❤️
tradecitypro
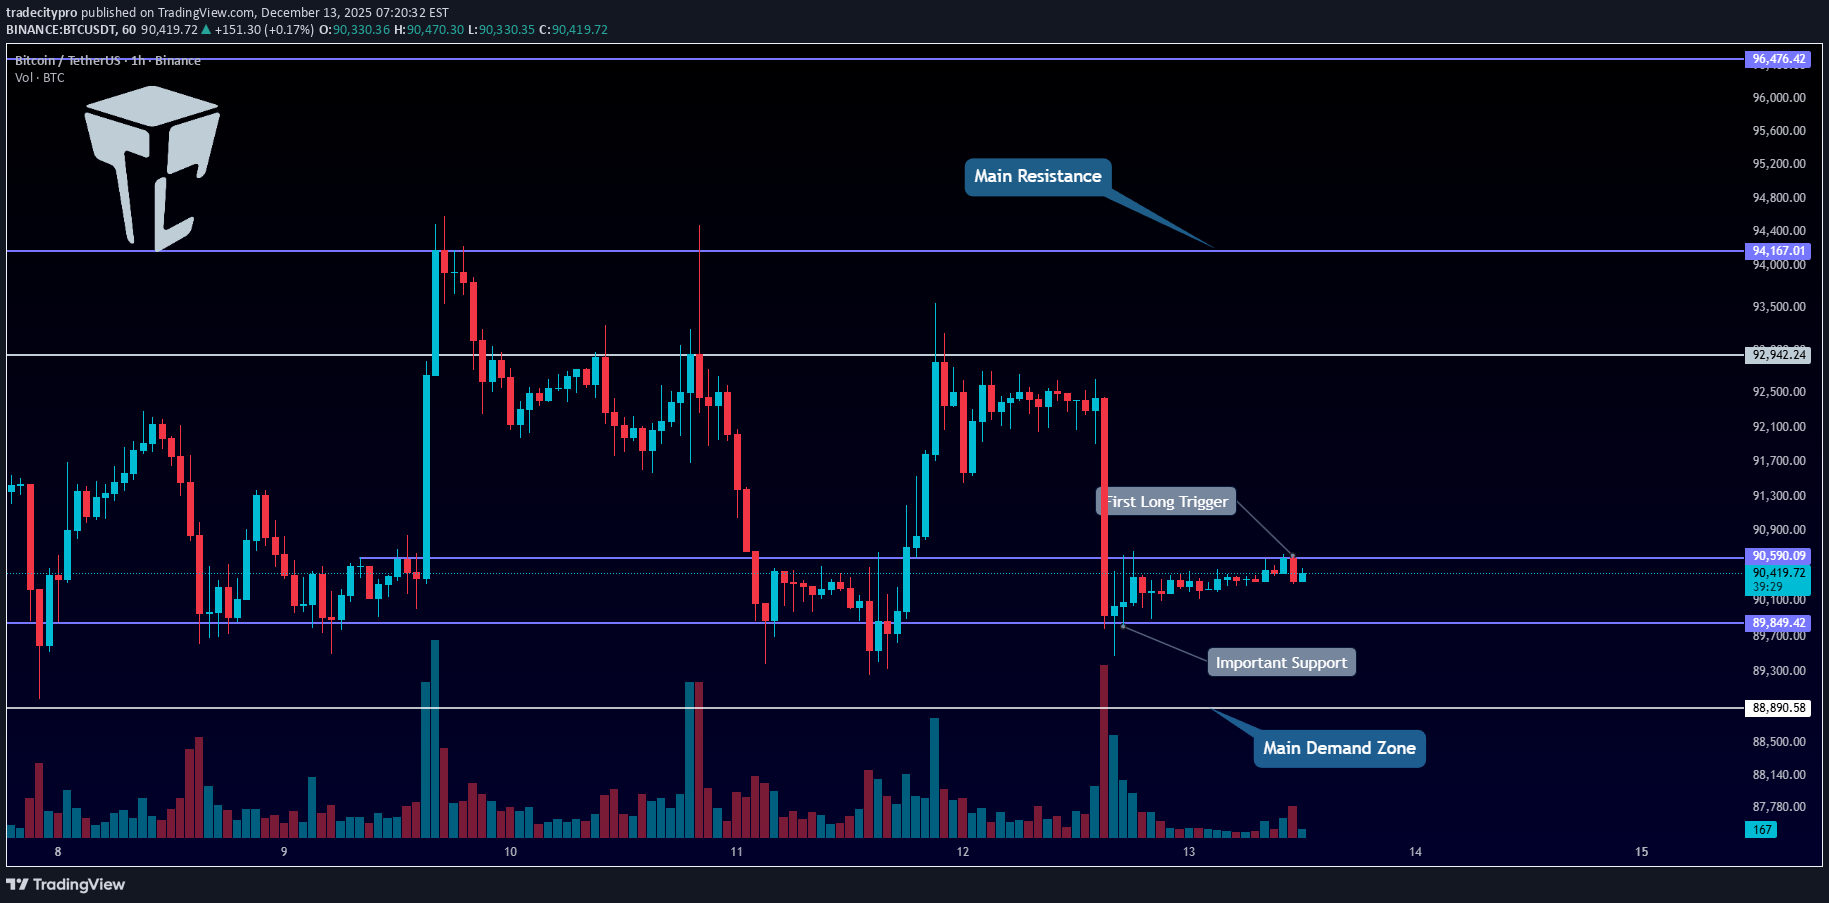
👋 Welcome to TradeCity Pro! Let’s move on to Bitcoin analysis. The market has been ranging for a few days, but it still gives positions, and if we stay behind the chart, we can make profits from the market. ⏳ 1-hour timeframe On the 1-hour timeframe, Bitcoin has formed a range box between the 88890 and 94167 zones, and for several days it has been moving between these two areas. ✔️ Currently, near the bottom of the box, the price has created a smaller range between 89849 and 90590, and since today is Saturday and volume is low, it is ranging between these two zones. 💥 If the price exits this box, the next move can continue toward either the top or the bottom of the main box. 🔔 That means with a break of 89849, the move can continue down toward 88890. 🎲 But if 90590 breaks, I will wait for a higher low and higher high to form above this zone, and then I will enter a long position. ⛏ The next resistance zones for Bitcoin are 92942 and 94167. 🧩 We get confirmation of Bitcoin turning bullish with a break of 94167. In that case, an upward move in higher cycles can begin. ⭐ On the other hand, if the price stabilizes below 88890, it can move again toward the 84000 support. ❌ Disclaimer ❌ Trading futures is highly risky and dangerous. If you're not an expert, these triggers may not be suitable for you. You should first learn risk and capital management. You can also use the educational content from this channel. Finally, these triggers reflect my personal opinions on price action, and the market may move completely against this analysis. So, do your own research before opening any position.
tradecitypro
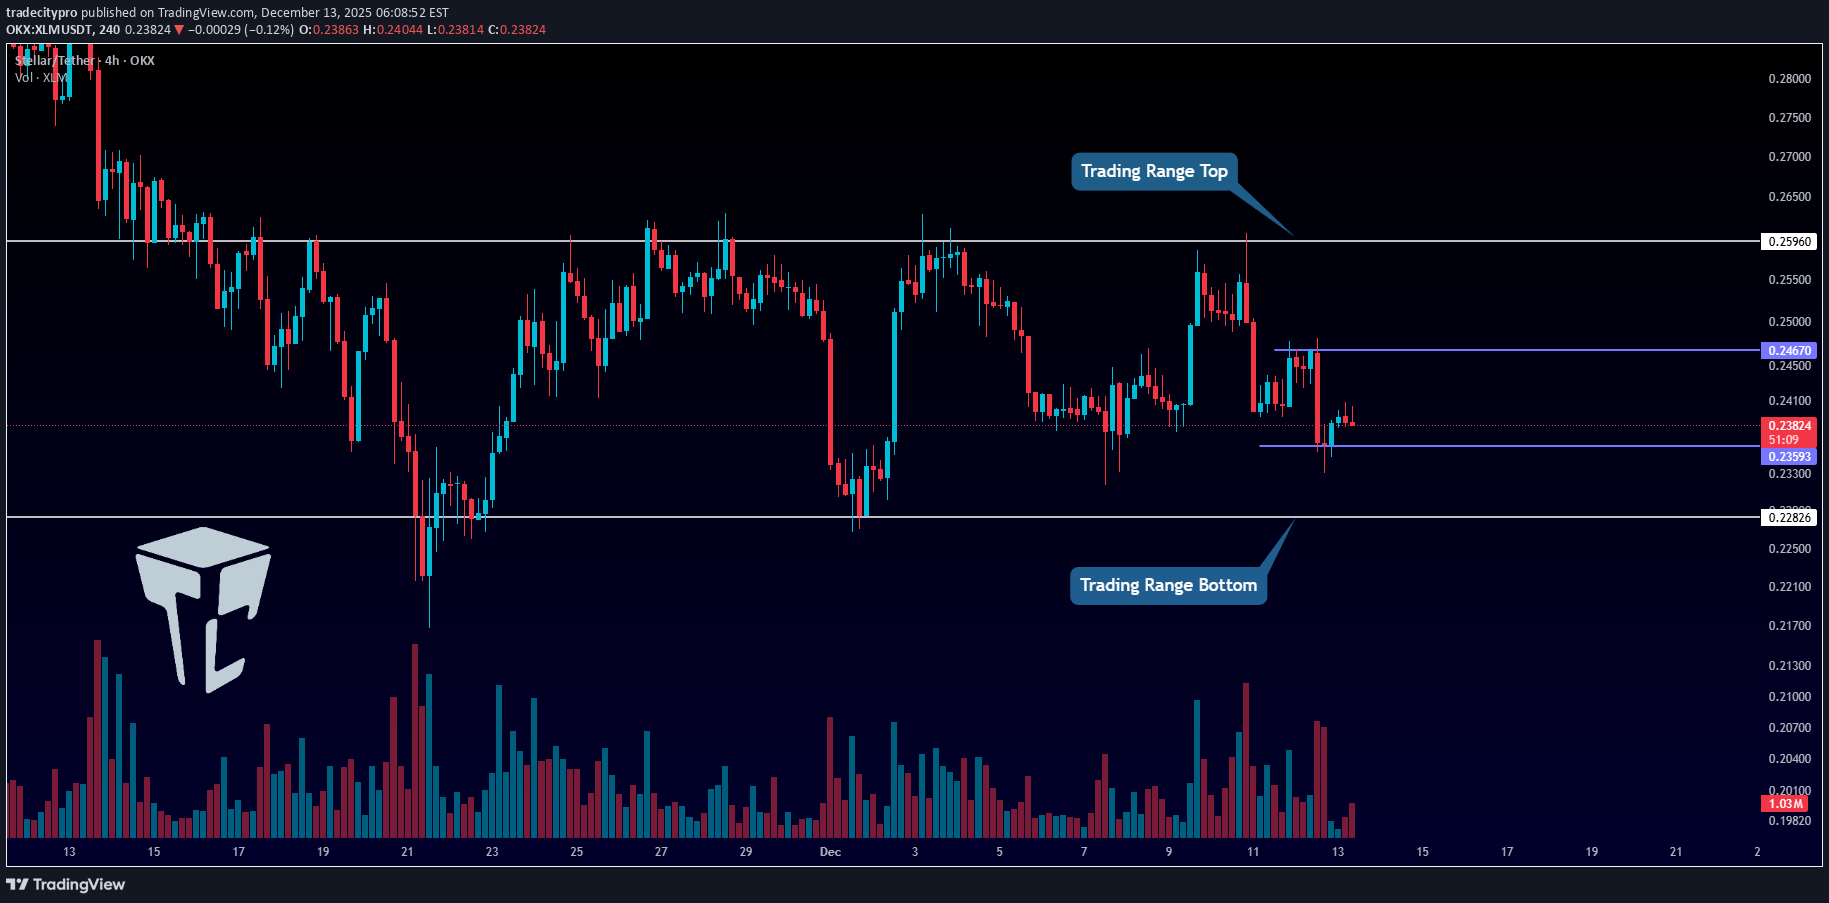
👋 Welcome to TradeCity Pro! In this analysis, I want to review XLM, one of the DeFi and RWA coins, which with a market cap of $7.72 billion is ranked 15th on CoinMarketCap. ⏳ 4-hour timeframe On the 4-hour timeframe, this coin has formed a large range box, and for several weeks it has been moving inside this range. ✔️ The bottom of this box is at 0.22826, and the top of the box is at 0.25960, and currently the price is moving in the middle of this box. 📊 A smaller range box has also formed inside the main box, which is between the zones 0.23593 and 0.2467. ⛏ If either 0.23593 or 0.2467 breaks, we can open a short-term position with low risk. However, the main triggers are the break of the main box’s support and resistance. ⭐ So for a short position, the main trigger is 0.22826, and the early trigger is 0.23593. ⚖️ For a long position, breaking 0.2596 is the main trigger, and breaking 0.2467 is the early trigger. 📝 Final Thoughts Stay calm, trade wisely, and let's capture the market's best opportunities! This analysis reflects our opinions and is not financial advice. Share your thoughts in the comments, and don’t forget to share this analysis with your friends! ❤️
tradecitypro
TradeCityPro | STX Facing Key Resistance, Bears in Control
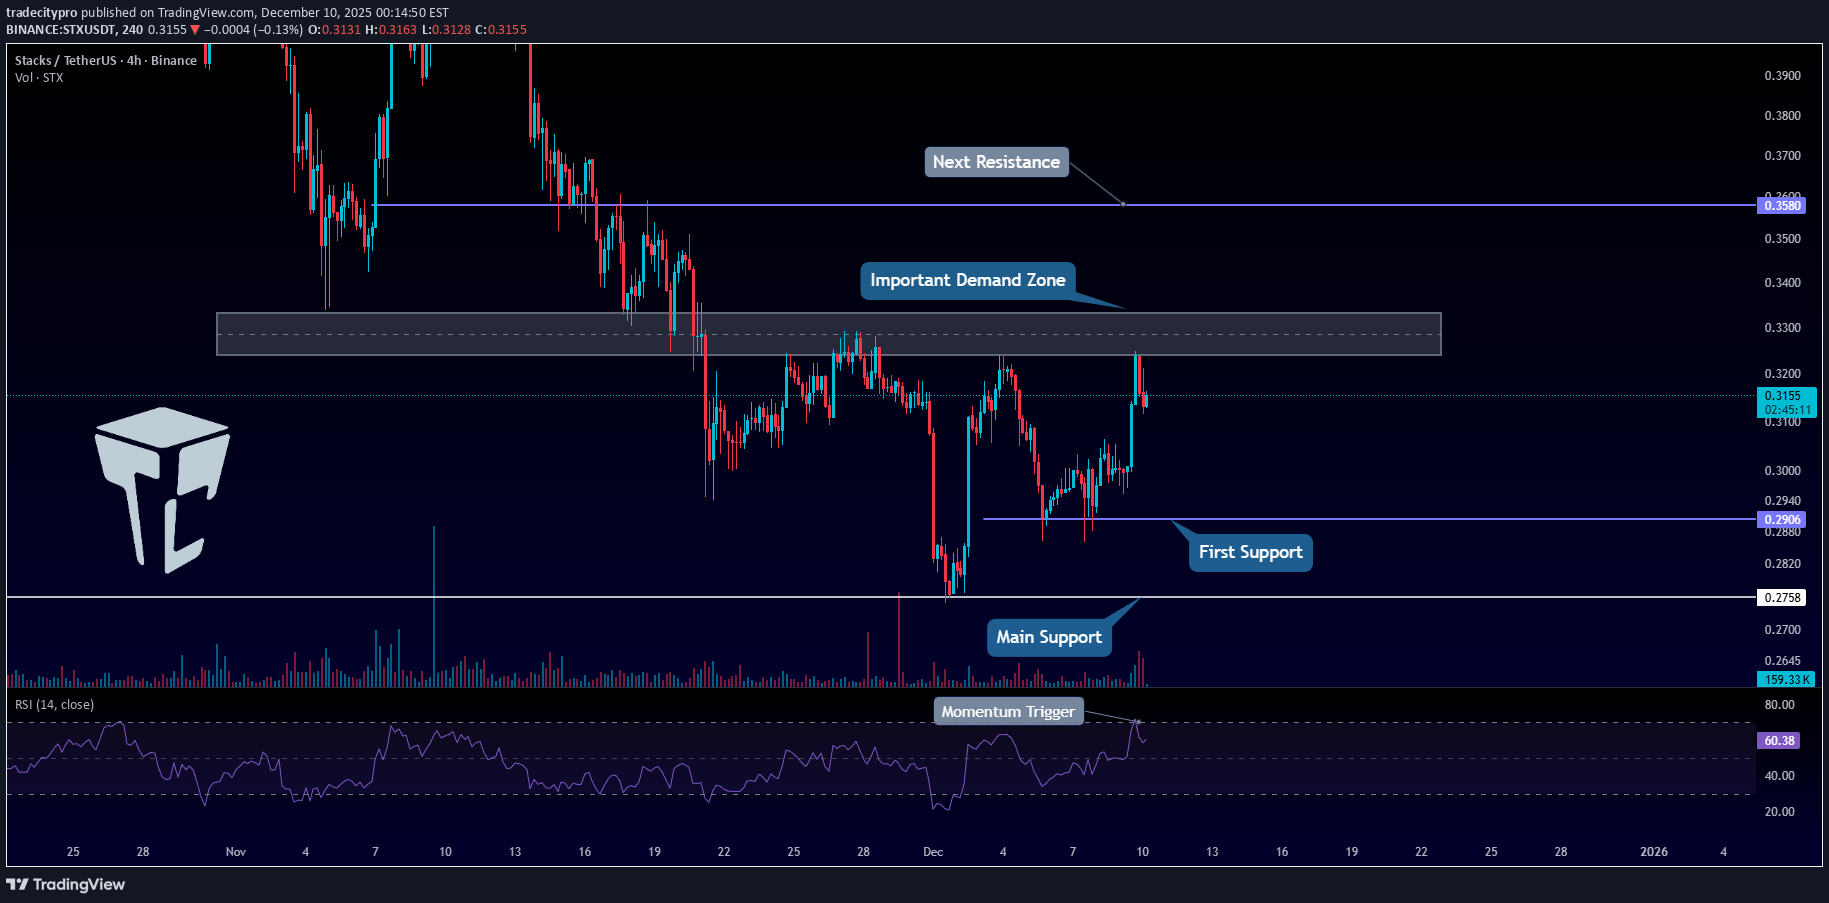
👋 Welcome to TradeCity Pro! In this analysis, I want to review STX, one of the Bitcoin ecosystem projects, currently ranked 87th on CoinMarketCap with a $573 million market cap. ⏳ 4-Hour Timeframe As you can see, on the 4-hour timeframe, STX is dealing with a resistance zone that it has touched several times before, and now it has reached this zone again. ✔️ After reaching this level, the volume of the red candles rejecting from this zone has been increasing, which shows the weakness of buyers and the strength of sellers at this level. 📊 If selling volume continues to increase, there is a possibility of price moving towards the support zones of 0.2906 and 0.2758. 💡 So, we can open a short position either after breaking the structure in lower timeframes or by breaking these zones 0.2906 and 0.2758. 💥 For a long position, breaking the range will be the first long trigger and the first confirmation for the coin turning bullish. 🎲 The next important resistance zones are 0.3580 and 0.4359, and breaking these levels will give us the main confirmations for a bullish trend. 🎯 On the other hand, if RSI enters the overbought zone, we can confirm the entry of bullish momentum into the market, increasing the likelihood of breaking the resistance zone. 📝 Final Thoughts Stay calm, trade wisely, and let's capture the market's best opportunities! This analysis reflects our opinions and is not financial advice. Share your thoughts in the comments, and don’t forget to share this analysis with your friends! ❤️
tradecitypro
👋 Welcome to TradeCity Pro! Let’s move on to the Bitcoin analysis. After the fake move we had yesterday, today Bitcoin has entered a ranging box. ⏳ 1-hour timeframe Yesterday on Bitcoin we had a trigger at the 91447 zone that we could use as a long trigger. 🎯 Before that, we also had a trigger on Bitcoin at 89849 which had been activated, and with the break of 91447 the second trigger was also activated. 🎲 After this trigger was activated, given the trend weakness we had on Bitcoin, the price could not stabilize above 91447, and with that move being faked, it dropped again to 89849. ⛏ The 89849 zone is an important support area on Bitcoin, and the next support we have on Bitcoin is 88890. ✔️ Considering that Bitcoin has faked both the 89849 low and the 91447 high once, we can say currently there is no specific trend in the market, and we can open both short and long positions. 📊 For a long position, again we can enter with the break of 91447 and open our position. ✔️ In case the market drops, we have two short triggers: the first is 89849 and the second is 88890, and by breaking either of them we can have a trigger for a short. ❌ Disclaimer ❌ Trading futures is highly risky and dangerous. If you're not an expert, these triggers may not be suitable for you. You should first learn risk and capital management. You can also use the educational content from this channel. Finally, these triggers reflect my personal opinions on price action, and the market may move completely against this analysis. So, do your own research before opening any position.
tradecitypro
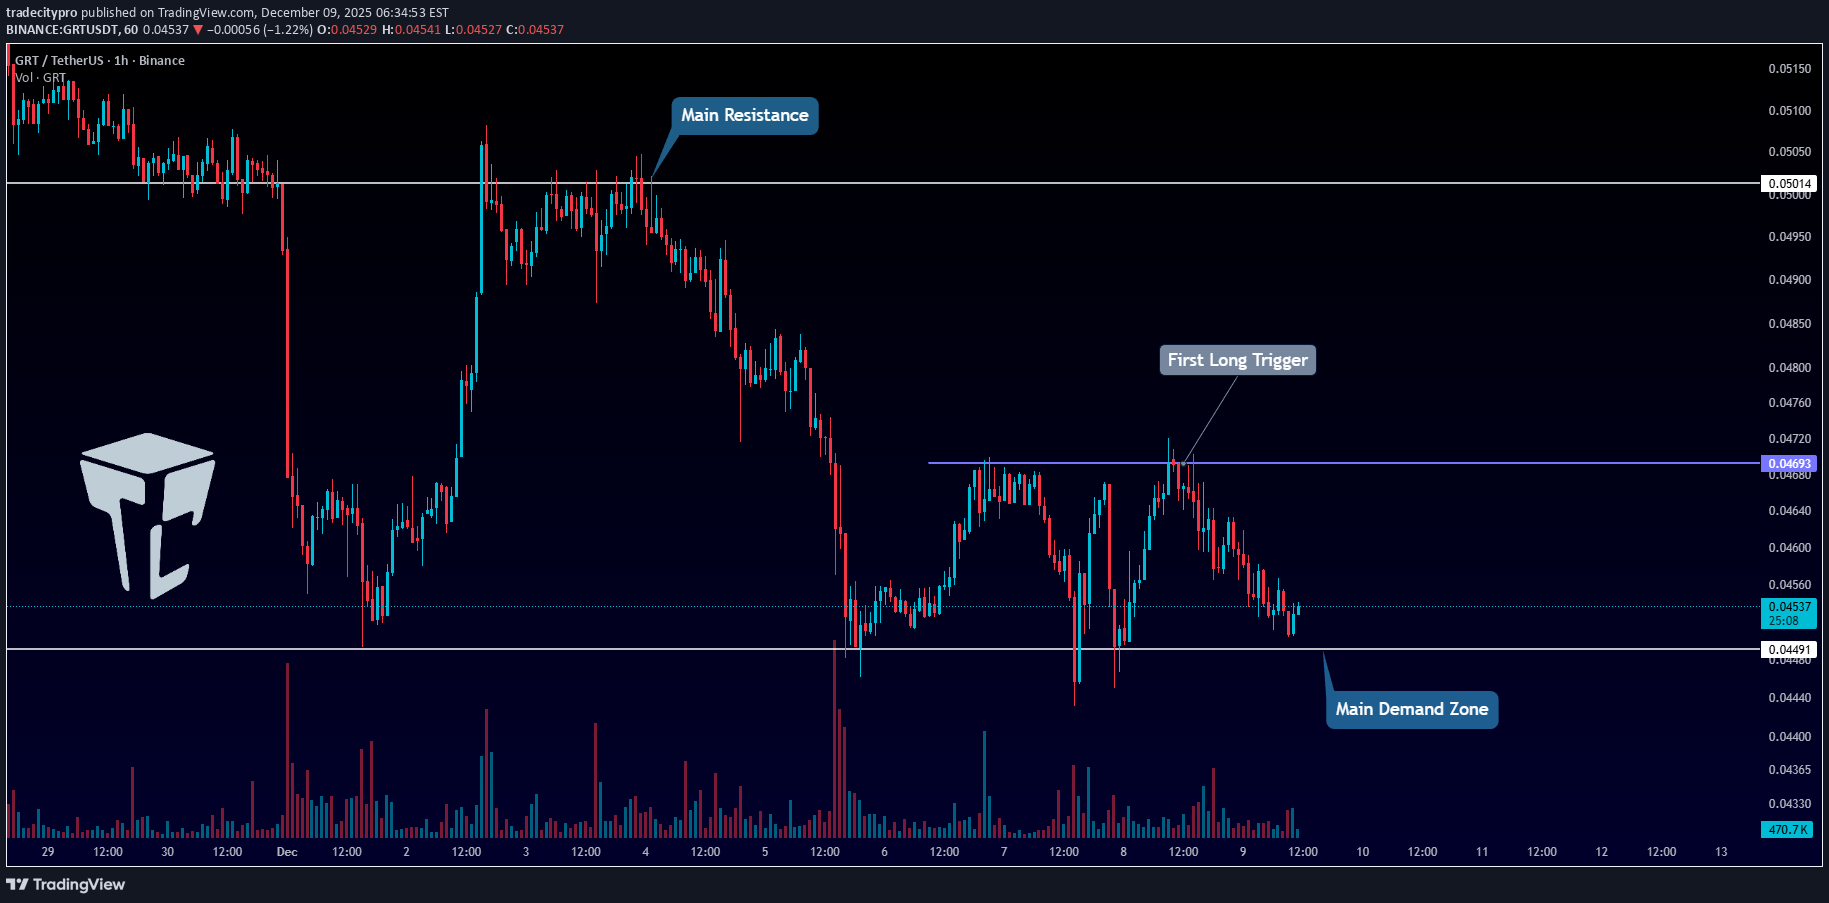
👋 Welcome to TradeCity Pro! In this analysis I want to review the GRT coin for you. One of the DeFi and Solana ecosystem projects that with a market cap of 481 million dollars is ranked 95 on CoinMarketCap. ⏳ 1-hour timeframe In the 1-hour timeframe, a range box has formed between the zones 0.04491 and 0.4693, and the price has been fluctuating between these two zones for several days. 💥 The zone 0.04491 is a very important support for this coin, and breaking it or being supported from it can start the next movement wave on GRT. 🎯 Since in the higher timeframes like daily and weekly its trend is bearish, then with the break of 0.04491 this trend can continue and we can open a short position with it. ⚡️ If the price is supported from this zone and moves toward the 0.4693 top, we can open a long position by breaking 0.4693. ⚖️ This trigger is the first trigger for a long and is considered a risky trigger. I prefer to wait to get more confirmations for this coin turning bullish. 📊 For now, the main trigger for GRT to turn bullish will be the break of its main resistance at 0.05014. ❌ Disclaimer ❌ Trading futures is highly risky and dangerous. If you're not an expert, these triggers may not be suitable for you. You should first learn risk and capital management. You can also use the educational content from this channel. Finally, these triggers reflect my personal opinions on price action, and the market may move completely against this analysis. So, do your own research before opening any position.
tradecitypro
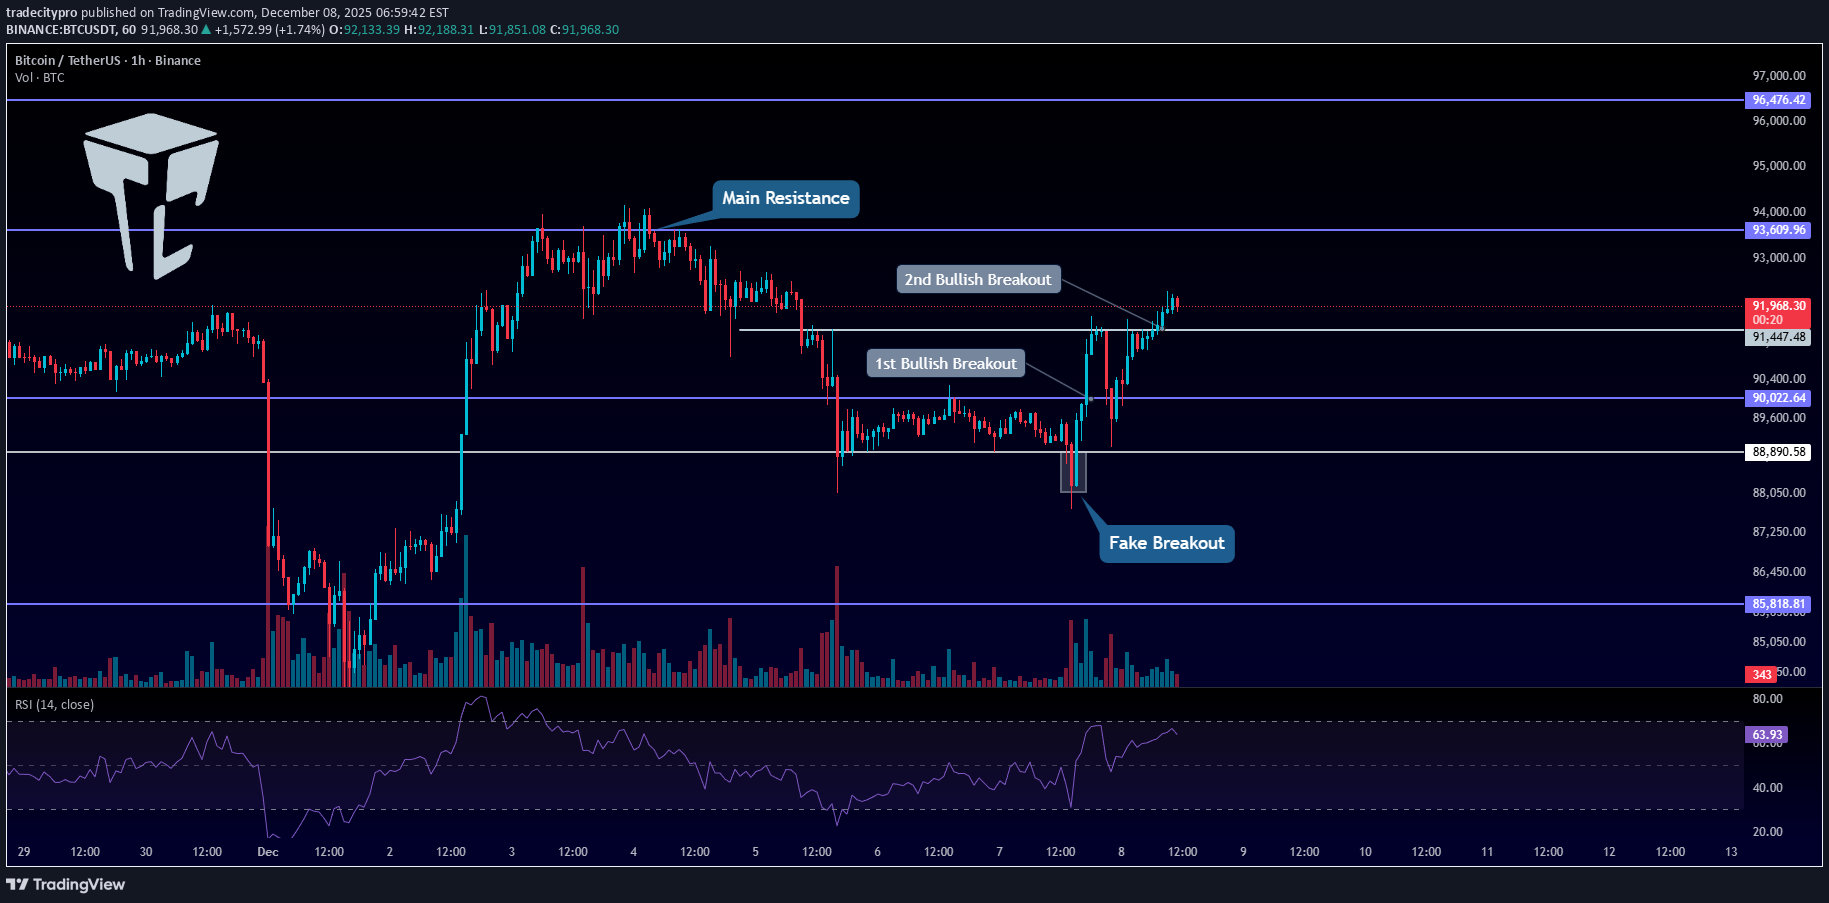
👋 Welcome to TradeCity Pro! Let’s move on to Bitcoin analysis; with the start of the new week, the market has taken a fresh trend. ⏳ 1-hour timeframe Yesterday on Bitcoin, we had two very important levels that the price was fluctuating between. ⭐ The resistance zone 90022 and the support 88890 were the areas where breaking either of them could give us a position. 💥 The first position we could open yesterday was a short, which after breaking 88890 made a sharp move that would reach our target as well, but afterward the price started a bullish move, and after the previous bearish move turned into a fakeout, a lot of bullish momentum entered it. 💧 After this move, the 90022 trigger also activated, and Bitcoin moved upward to the 91447 area. 🧩 Overall, yesterday was a very volatile day, because after reaching 91447, Bitcoin corrected to near 88890, and then again moved upward. 🎲 But today Bitcoin was struggling with the 91447 zone, which it has so far managed to break, and with a bit of momentum and a slight slope, it is moving upward. ⚡️ We can see this trend weakness inside the RSI; the shape of the candles also shows a lot of trend weakness, but volume still doesn’t have a strong divergence with the bullish trend. ✔️ If this weakness continues, the probability of a fake break of 91447 and the start of a new bearish move increases a lot. 🔔 But if Bitcoin keeps its momentum and the move continues, the next zone the price can react to will be 93609. ❌ Disclaimer ❌ Trading futures is highly risky and dangerous. If you're not an expert, these triggers may not be suitable for you. You should first learn risk and capital management. You can also use the educational content from this channel. Finally, these triggers reflect my personal opinions on price action, and the market may move completely against this analysis. So, do your own research before opening any position.
Disclaimer
Any content and materials included in Finbeet's website and official communication channels are a compilation of personal opinions and analyses and are not binding. They do not constitute any recommendation for buying, selling, entering or exiting the stock market and cryptocurrency market. Also, all news and analyses included in the website and channels are merely republished information from official and unofficial domestic and foreign sources, and it is obvious that users of the said content are responsible for following up and ensuring the authenticity and accuracy of the materials. Therefore, while disclaiming responsibility, it is declared that the responsibility for any decision-making, action, and potential profit and loss in the capital market and cryptocurrency market lies with the trader.