
vagada
@t_vagada

What symbols does the trader recommend buying?
Purchase History
Trader Messages
Filter
Message Type
vagada
BTCUSD Daily: Watching for Post-ATH Correction Pattern to Unfold
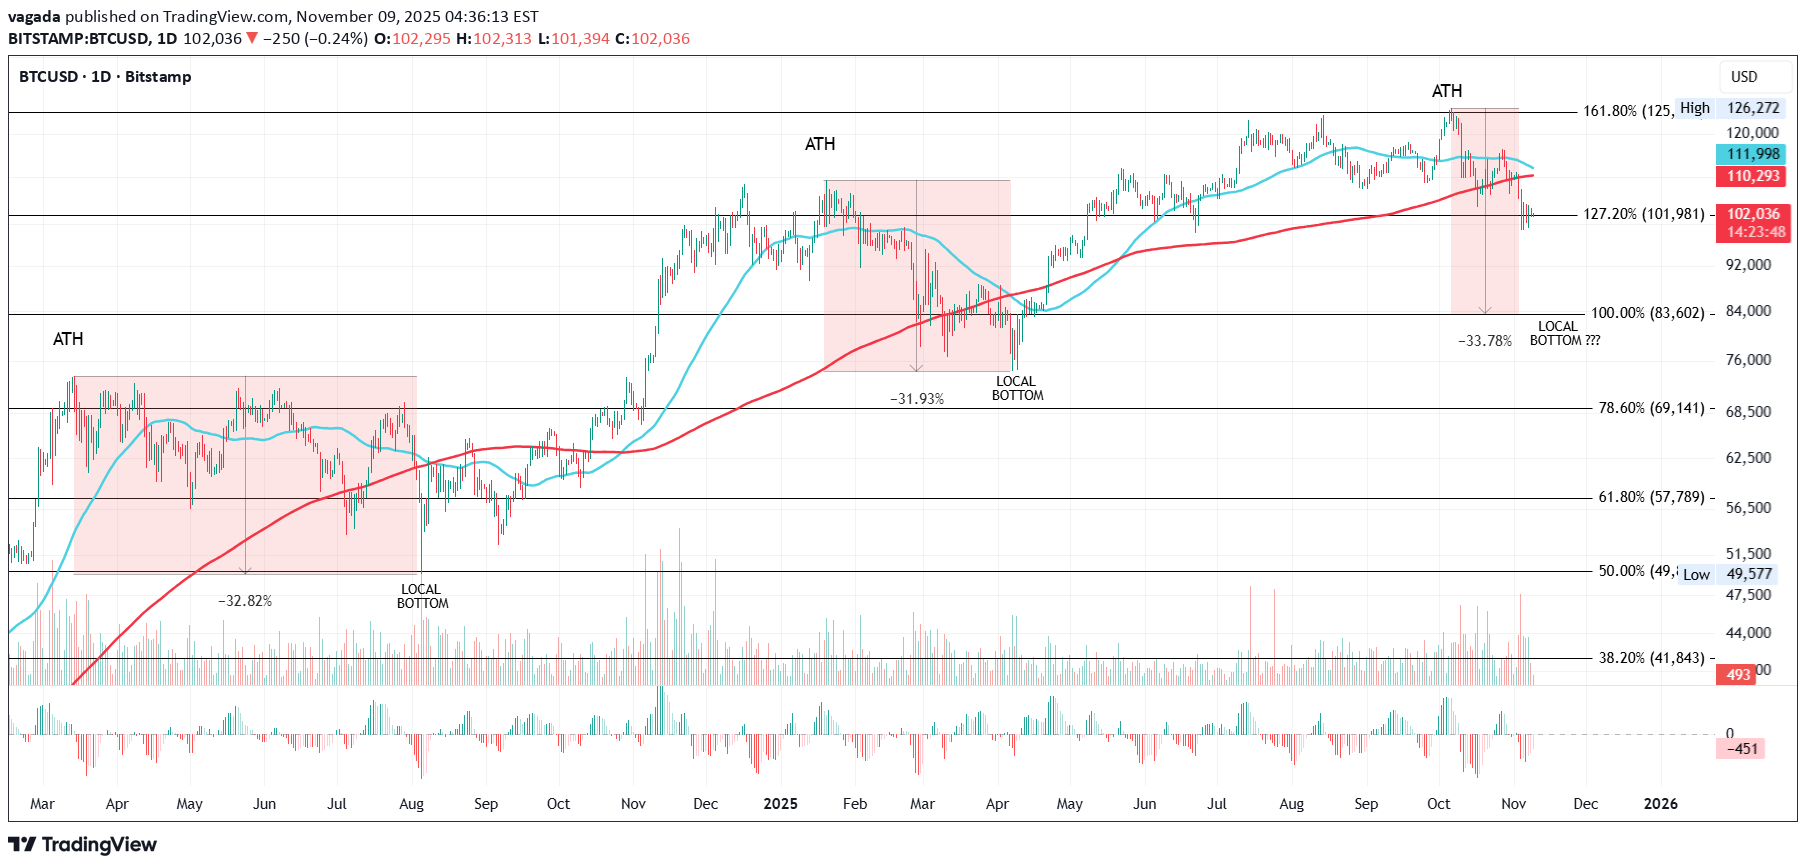
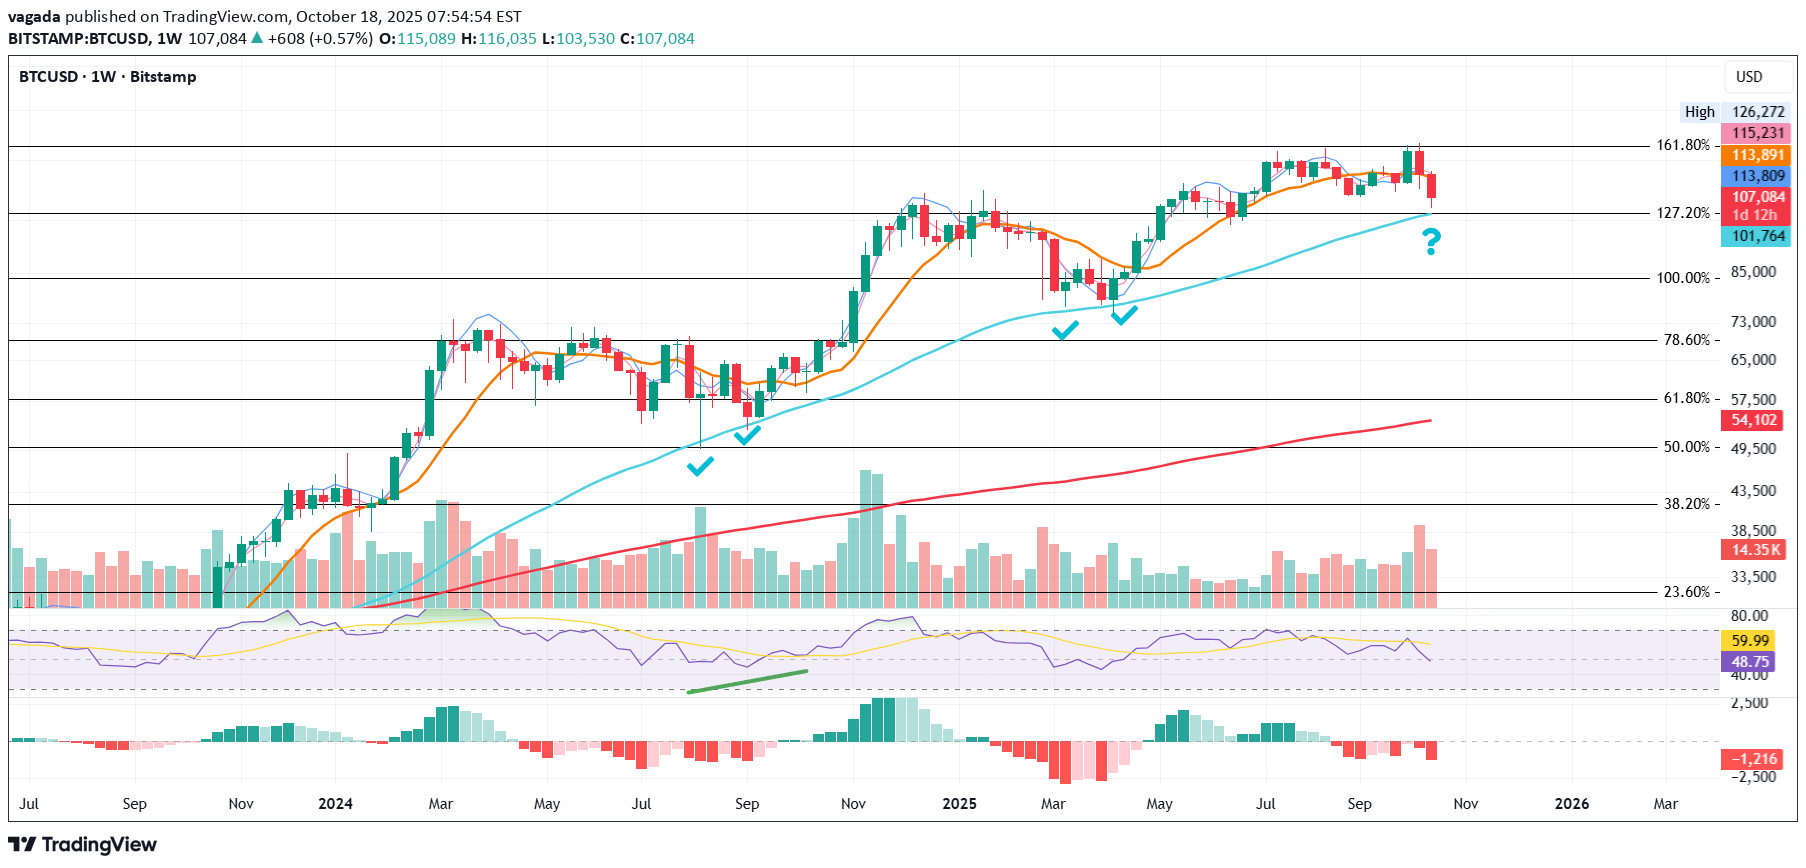
Potential Local Bottom Ahead? Overall Outlook: I'm tracking a recurring pattern in Bitcoin's price action following each all-time high (ATH), involving sharp drops, interactions with the 50-day and 200-day moving averages (MAs), and key Fibonacci levels. This has played out twice before in this cycle, and we're now in the midst of what could be the third iteration. The setup suggests a potential further drop of around 33.78% from the latest ATH, targeting the 100% Fib level for a local bottom, possibly timed near a death cross. If this holds true, it could signal a strong buying opportunity at the bottom, as price has historically reversed and rallied hard afterward. For now, the theory looks promising, but I'll update this idea as events unfold. Key Pattern and Historical Observations: This analysis focuses on a consistent post-ATH correction structure that's emerged in Bitcoin's daily chart over the past couple of years. It typically involves: A new ATH breaking above a key Fib extension level. A subsequent drop of 31-33%, crossing under the 50MA and 200MA. Bottoming near a lower Fib level (often 2 levels below the ATH breakout point), with timing influenced by the death cross (50MA crossing under 200MA). Post-bottom recovery: Choppy ups and downs, reclaiming MAs and Fib levels, leading to the next leg up. Let's break it down by each ATH in the series: First ATH (March 2024): Peaked at $73,794, right above the 78.60% Fib level. This was followed by a 32.82% drop to a local bottom at $49,577. Price action dropped 2 Fib levels to land at the 50% Fib, after crossing under both the 50MA and 200MA. Notably, the local bottom formed just days before the death cross occurred, suggesting the cross could help time reversals. From there, recovery wasn't immediate, price pushed up, hit resistance at the 200MA, dropped, rallied again, and repeated this process. Eventually, it found support at the 50MA and pushed over the 200MA. This consolidation phase lasted from March to August 2024 before the uptrend resumed. Second ATH (January 2025): Hit $109,356, breaking above the 127.20% Fib level. Similar to the first, it dropped 31.93% to a local bottom at $74,434 and again, 2 Fib levels lower, landing close to the 78.60% Fib (which was key in the prior ATH). This time, the bottom came shortly after the death cross, flipping the timing slightly from the previous instance (after vs. before). Post-bottom, price reclaimed the next Fib level and the 50MA, then crossed the 200MA and held strong without looking back, all the way until October 2025. Third ATH (Early October 2025): Reached $126,272, just above the 161.80% Fib level. Following the pattern, but accelerating faster this time, price has already dropped under the 200MA and found at least temporary support at the 127.20% Fib level. Current Setup and Open Questions: Based on the prior two ATHs, this third one raises two key questions that could define the next move: Will price drop to the next lower Fib level? That would mean targeting the 100% Fib, implying a total drop of around 33.78% from the $126,272 ATH (putting the local bottom somewhere near $83,600, give or take based on exact Fib anchoring). Will a death cross mark the bottom? In the first case, the bottom was days before the cross; in the second, shortly after. Watching for an impending death cross could help time the reversal in real time. If the pattern repeats, we're likely in the early stages of the correction, with more downside before the bottom forms. This setup has a good chance to play out given the historical parallels, offering a prime spot to buy the dip once the local bottom confirms. I'll keep this idea updated as price action develops, especially monitoring Fib interactions, MA crosses, and any signs of reversal. Potential Trade Considerations: Watch Zones: Resistance: 161.80% Fib ($126,272, prior ATH) and 200MA for any failed retests. Support Targets: 127.20% Fib (current temp support), then 100% Fib for the potential local bottom (~33.78% drop zone). Entry Idea: No aggressive positions yet, wait for signs of bottoming near the 100% Fib or around a death cross. If confirmed, long entry on reversal signals (e.g., bullish candle above 50MA). Risk Management: Set stops below key Fib supports. Target post-recovery upside to prior ATH or higher Fib extensions. Invalidation: A quick reclaim of the 200MA without further drop could break the pattern, shifting to bullish continuation. External Factors: While the technicals are strong, BTC in late 2025 is heavily influenced by US macros, which could amplify or disrupt this post-ATH drop pattern. For instance: Ongoing Government Shutdown: The US federal government has been shut down since October 1, 2025, making this the longest shutdown in history (now at 39+ days as of Nov 9). It's causing widespread disruptions, including halted SNAP benefits for millions, delays in airport operations due to air traffic controller shortages, increased reliance on food pantries by military families, and broader economic strain like reduced tourism and spending ahead of Thanksgiving. Negotiations are stalled, with Senate Republicans pushing for votes to reopen but Democrats holding out for extensions on ACA tax credits. This uncertainty could weigh on risk assets like BTC, potentially accelerating the expected 33.78% drop if it drags on and hurts consumer confidence or triggers a recessionary vibe. On the flip side, a quick resolution might spark a relief rally, shortening the correction phase. Fed's Stance on Rate Cuts: There's no FOMC meeting in November, so no rate cut then. For December, Fed Chair Powell emphasized after the October 29 quarter-point cut (bringing the fed funds rate to 3.75%-4%) that another reduction is "not a foregone conclusion" and depends on incoming data. Internal divisions are evident: some officials like Beth Hammack and Lorie Logan question further easing, citing a resilient economy and risks of reigniting inflation. The shutdown is complicating this by blocking key data releases (e.g., jobs reports), which Powell likened to "driving in the fog." If no cut happens in December, it could pressure BTC lower in the short term by signalling tighter policy, aligning with a deeper Fib target. But if data softens dramatically (e.g., due to shutdown effects), a surprise cut might catalyze the bottom and reversal. Ending QT and Potential QE Shift: The Fed announced it will end quantitative tightening (QT) on December 1, halting the balance sheet runoff and instead rolling over maturing Treasuries to hold holdings steady at around $6.6 trillion. This addresses tightening money markets and funding strains, but it's not yet quantitative easing (QE), it's more of a pause to maintain ample reserves rather than active expansion. Some analysts speculate this could pave the way for QE resumption if economic conditions worsen (e.g., prolonged shutdown or labour market cooling), potentially starting in December or early 2026. For BTC, ending QT removes a liquidity drain, which is bullish long-term and could support post-bottom rally. If QE kicks in sooner, it might act as rocket fuel, shortening the correction and pushing toward new ATHs faster, but watch for inflation risks that could prompt hawkish pushback. If you like this idea, feel free to leave a comment, boost, or share your thoughts. Remember, this is not financial advice; trade responsibly! Always take profits and manage risk! Interaction is welcome in the comments!
vagada
Gold Daily | The Pause That Defines the Bull
Gold Daily – Support Holds, But the System Still Says Wait Gold has now completed what looks like a classic 10 percent pullback inside a secular bull market: a move that tests conviction, not trend. Price found support exactly at the green line, a level that has defined structure since late summer. From a system perspective, however, the setup remains bearish for now. MLR < SMA < Price < BB Center, and PSAR still above price, confirming that momentum hasn’t flipped yet. The interesting part is how this technical pause meets the macro turning point. The Fed just announced another rate cut, lowering rates by 25 bps and signaling more easing ahead. Historically, rate cuts have had a dual effect on gold. In early cycles, they boost risk appetite, sometimes pulling capital into equities first. Later, when easing becomes structural, gold reclaims dominance as real yields compress. That’s why this zone matters. Gold is sitting right where both technical exhaustion and monetary easing collide. A bounce here would fit the larger bull narrative, a rotation from short-term fear back to long-term trust hedging. A breakdown, on the other hand, would tell us the market’s still digesting the new policy shift. Either way, this is a recalibration phase, not a top. Pullbacks like this are the pauses that let bull markets breathe. Bias Neutral-to-bullish, support confirmed, structure lagging, macro tailwinds building. Always take profits and manage risk. Interaction is welcome.
vagada
Gold & ETH 30-Min – Parallel Structures, Subtle Differences
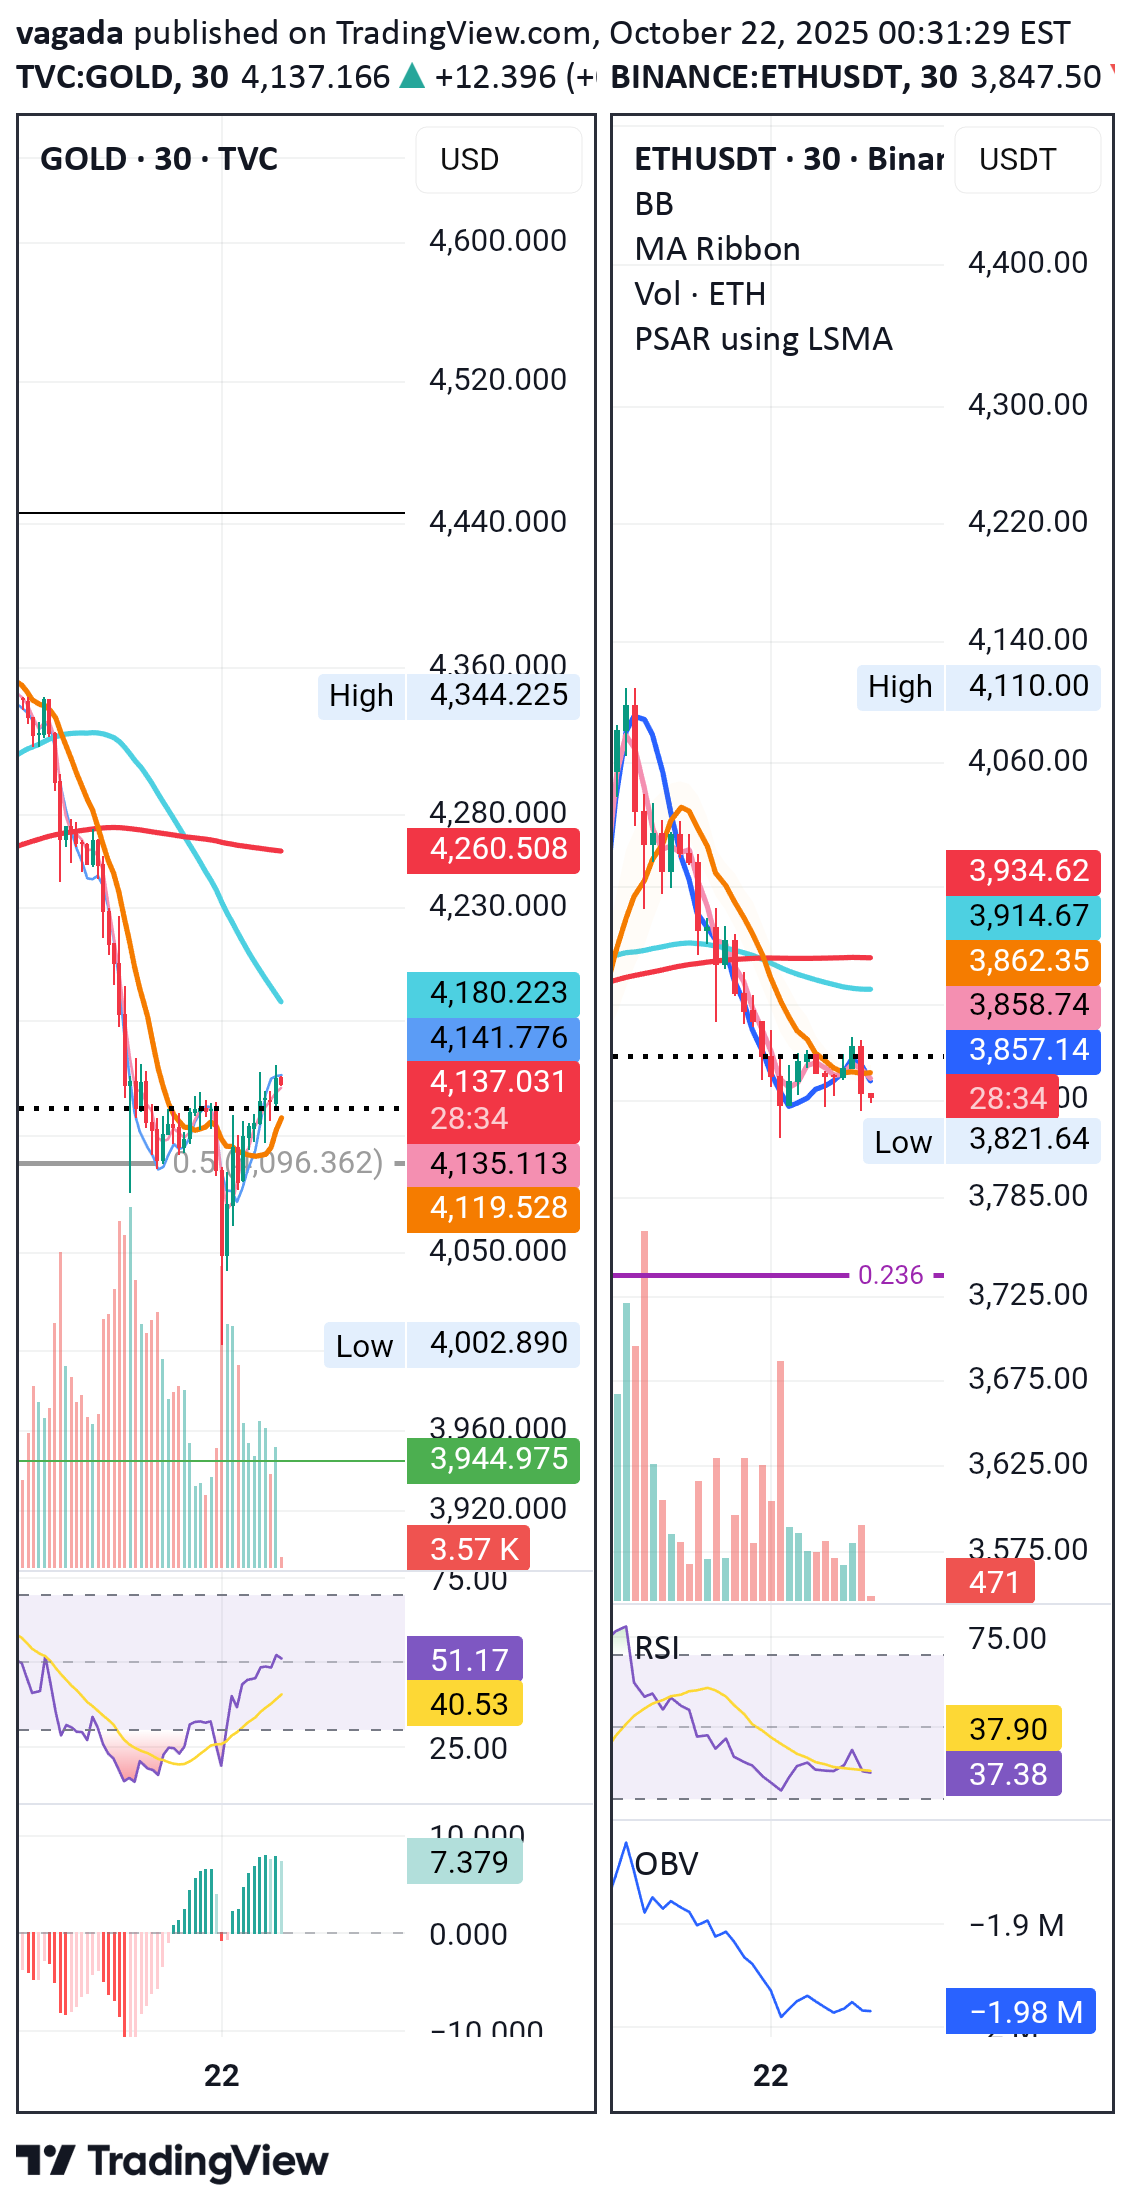
Gold found support right at the 0.5 Fib 4096 $ and is now trading above yesterday’s close, a sign of renewed strength. ETH, meanwhile, is retesting yesterday’s close as support but is now slipping slightly below it, showing early weakness after failing to sustain the bounce. From a system perspective, both charts are aligned: BB Center < SMA < Price < MLR, a constructive setup that still supports potential continuation, if price stabilizes above support. However, Gold continues to show more strength, holding structure more cleanly and staying resilient above key short-term levels. This parallel move between a risk asset (ETH) and a defensive one (Gold) suggests a market in transition: strength rotating, but not breaking. Bias: Short-term neutral-to-bullish, Gold firm, ETH needs confirmation. Always take profits and manage risk. Interaction is welcomed.Gold & ETH 30-Min – Momentum Shift Things have changed since earlier today. Even though Gold was showing strength this morning, price has now slipped below yesterday’s close and the 0.5 Fib at 4,096$ a level attacked twice from below, each time pushing price lower and confirming short-term weakness. Meanwhile, ETH has been holding steady, maintaining roughly the same range throughout the day and now showing more strength than Gold. The upcoming daily close will likely reveal more about where these two assets are heading next, whether Gold can regain footing or ETH continues to take the lead. Bias: Neutral for now, watching the daily close for confirmation.
vagada
ETH Weekly – Tracking the Fib Battle, Week by Week
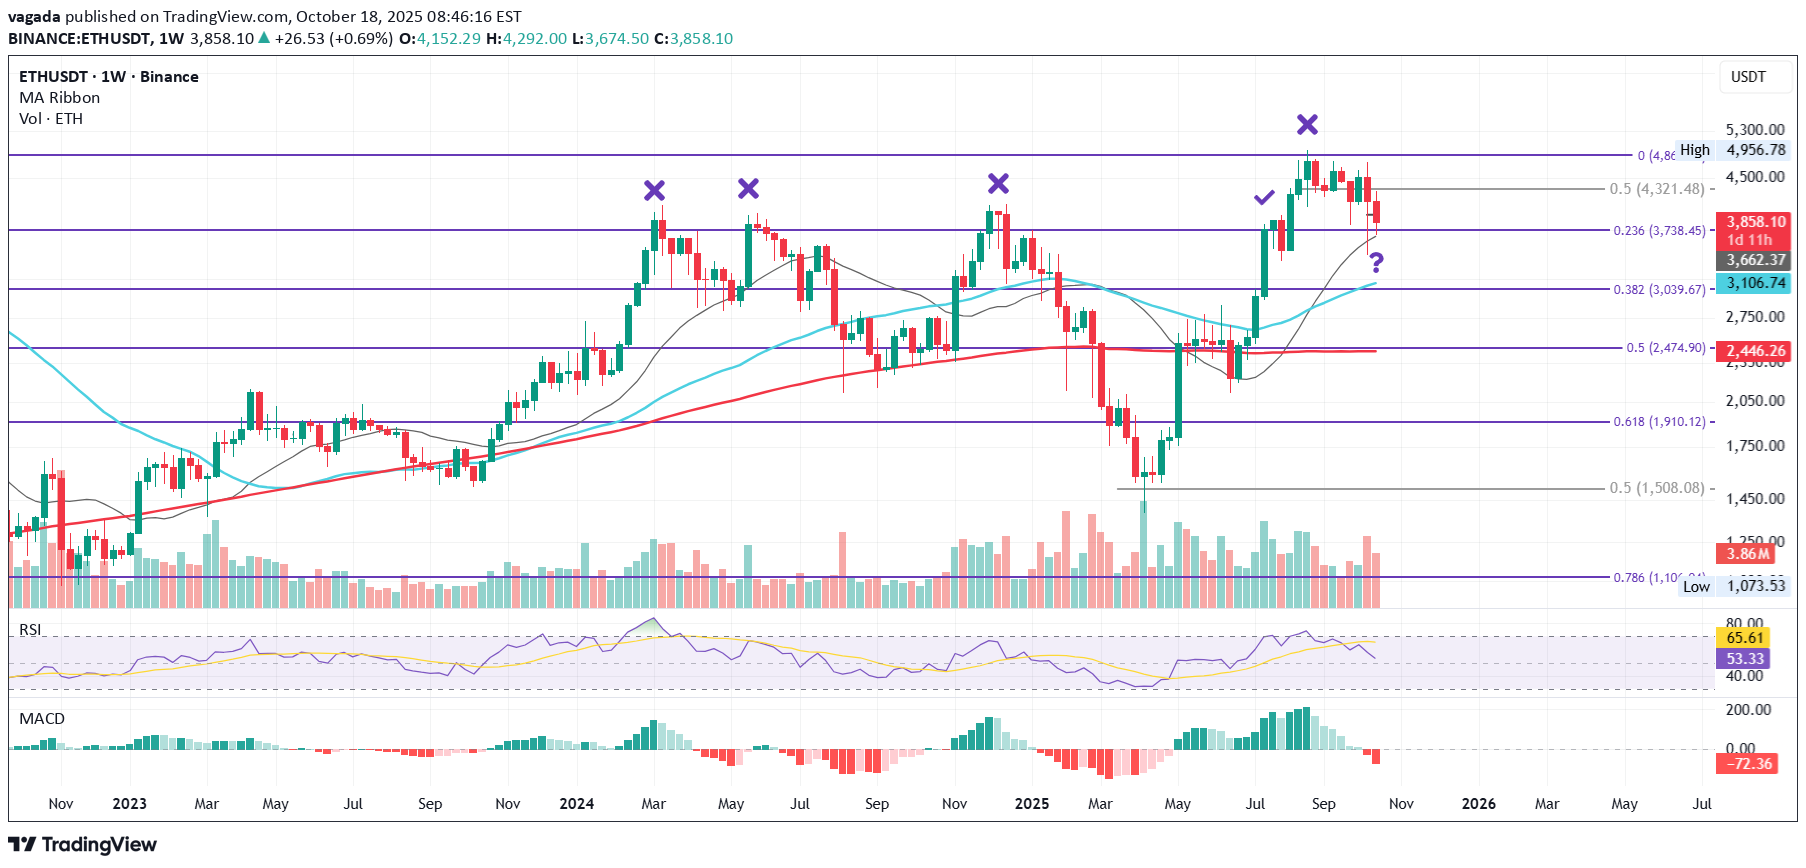
This is ETH on the weekly chart. In this series, the main focus is on Fibonacci levels and the 21, 50, and 200-week moving averages, the key structures shaping ETH’s long-term rhythm. The goal is to maintain clarity when zooming out from lower timeframes and to understand where ETH truly stands in the broader cycle. The story here is one of repeated attempts and liquidity hunts. ETH has tried three times to break through the 0.236 Fib level ($3738) and failed each time, needing deeper pullbacks to reload for another try. After the first rejection (March 2024), ETH found support at the 0.382 Fib ($3039) near the 21-week MA, which helped fuel a second attempt. The second rejection sent price lower to the 0.5 Fib ($2474) and the 200-week MA, from which ETH found strength for the third attempt. The third rejection pushed price all the way to the $1500 zone, but that final deep flush gave enough strength for the fourth attempt, which finally succeeded: ETH broke through the 0.236 Fib. However, after that success came another test, a rejection at the 0 Fib level ($4868), which now acts as major resistance. This week, price is retesting the hard-won 0.236 Fib support ($3738), with the 21-week MA sitting just beneath it, forming a potential support confluence zone. The big question now: Will ETH repeat its own pattern again; holding the 0.236 Fib and 21W MA to attempt another push toward the 0 Fib level, only to face yet another rejection? Weekly closes from here will tell the story, one candle at a time. This chart will be updated each week to track how ETH behaves around these defining levels. Always take profits and manage risk. Interaction is welcome.
vagada
BTC Weekly Series – Tracking the Price, Week by Week
BTC Weekly – The Line That Defines the Cycle On this chart, one line has quietly supported Bitcoin since the March 2024 ATH: the blue cayenne line, the 50-week moving average. It held the dip after the January 2025 ATH, and now we’re about to find out if it can do it again after the September 2025 ATH. Each time price needed that support, it tested the 50-week MA twice before reversing higher. There’s also a recurring pattern with Fibonacci levels: * After the March 2024 ATH, price lost the 61.8 Fib, touched the 50-week MA, and bounced. * After the January 2025 ATH, price lost the 100 Fib, touched the 50-week MA, and bounced. This time, things are different. The 50-week MA now aligns exactly with the 127.2 Fib, meaning there’s no safety net below. If this level fails, there’s nothing technical left beneath it that has caught price since March 2024. That could make any future leg higher more difficult to form. From here, the focus should be on weekly closes. They will tell us whether this structure still holds or if we’re about to enter a deeper correction phase. I’ll continue updating this view at the end of each week or on Mondays, to keep track of how this key level evolves, both for myself and for anyone following the cycle closely. Always take profits and manage risk. Interaction is welcome.
vagada
SNX 30m – Calm Before the Drop?

SNX 30m – Pressure Building at Support SNX is showing early exhaustion after a strong move up. Price is forming lower highs while volume fades — a typical distribution setup. From the system view, price < SMA < MLR, suggesting a possible downtrend forming, which would be confirmed once price closes under the BB Center. RSI shows a bearish divergence, and MACD turning red confirms momentum is fading. Funding is still positive and OI high — meaning too many longs are still stuck, and if support breaks, they’ll be the ones fueling the drop. If the 2.30–2.25$ zone fails, next liquidity sits near 2.20–2.15$. Until funding cools off and OI drops, short setups stay in control. Bias: Neutral–bearish — structure losing strength while leverage builds up. Always take profits and manage risk. Interaction is welcome.
vagada
ETH Daily – High Volume, Rising OI, and a Fight for Structure
ETH Daily – Volume King Leading the Rebound At this moment, ETH shows the highest trading volume across major assets. After the sharp crash that dragged price down to 3435$, under the 0.236 Fib level, ETH found strong support near 3738$,the 0.236Fib level. From that level, price has now reclaimed the 4000$ mark, a psychological and technical milestone. If momentum continues, the next resistance sits at the 0.5 Fib level around 4321$. From a system perspective, structure remains technically bearish for now: SMA < MLR < Price < BB Center, with PSAR still bearish (above price). To flip structure bullish, ETH would need a daily close above the BB Center with PSAR reversal confirmation. OI Analysis: ETH OI +7.70% growth confirms new leveraged exposure entering during this rebound: a positive sign showing traders are adding risk rather than de-risking. This increase in OI, combined with strong spot volume (74.6B in 24h), suggests conviction behind the recovery rather than a mere short-covering bounce. However, elevated OI also means volatility risk is rising: if ETH fails to close above 4000$ or BB Center, liquidations could amplify the next pullback. Bias: Cautiously bullish, short-term momentum improving, structure still lagging. Watching daily close above 4k today and BBcenter for future confirmation. High volume and rising OI often mark the start of a structural shift, but confirmation always comes from the daily close. In moments like this, patience is what separates the trader reacting to price from the one anticipating the next move. Always take profits and manage risk. Interaction is welcome.ETH Daily – Rejection at 0.5 Fib: Searching for Support After the recent rebound, ETH faced a clean rejection from both the 0.5 Fib retracement (≈ 4321 $) and the BB Center, confirming resistance confluence. Price is now retracing toward the 0.236 Fib level (≈ 3738 $), potentially forming a double bottom, though confirmation is still needed. Price Action Structure: MLR < Price < SMA < BB Center, PSAR above price Market bias: short-term bearish. If ETH holds 3738 $, a bounce toward 4000 $ is plausible, but a break below that level opens the door toward 200MA . Futures & Derivatives Data (Coinalyze) Open Interest: 19.2 B dollars (−0.79%), showing a slight contraction and cooling leverage. Funding Rates: neutral to mildly negative (−0.003% to +0.01%), reflecting balanced sentiment across exchanges. Liquidations (24 h): 71 M dollars total — 51 M longs versus 19 M shorts, showing pressure shifted to bulls after rejection. Long/Short Ratio: around 2.8, with nearly 74% longs, indicating excessive optimism and the potential for another flush. Interpretation The data shows a mixed but heavy setup. Funding and open interest cooling suggest reduced leverage and a healthy reset phase. However, the persistent long dominance above 70% suggests that retail sentiment remains overly optimistic, which often precedes one final shakeout before reversal. Bias Short-term bearish, waiting for structural re-alignment. Confirmation for a new long setup would require a daily close above the BB Center with MLR crossing above SMA. For now, ETH remains in a correction phase rather than accumulation. Patience remains the advantage.
vagada
Gold Daily – Holding the Line Before the Next Move

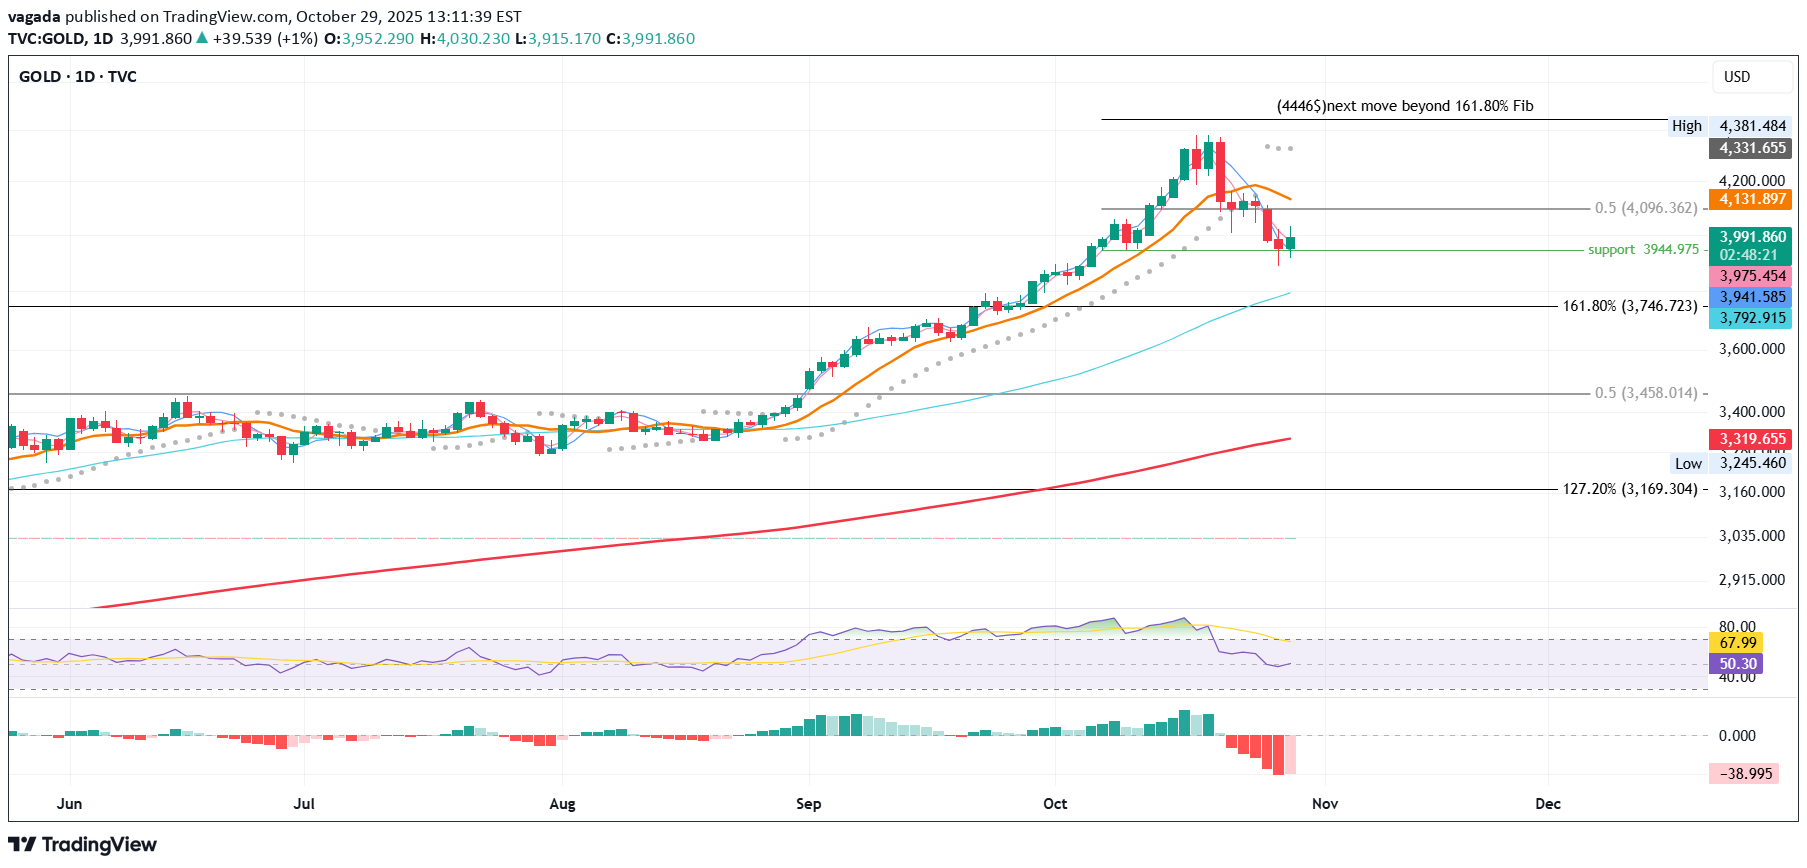
Gold Daily – Holding Support, Eyes on the Next Leg Gold’s run from the 50MA support that started in the second half of August has been nothing short of spectacular. After such a sharp move, it’s natural to look for where price might pause or recharge. Based on historical price action and key Fibonacci levels, several zones stand out. The 0.5 Fib level at $4,096 acted as resistance on October 8, marking the local high of this move. Below, the green support line around $3,945 is now being tested, a zone that also aligns closely with the BBcenter, creating a confluence of potential support. So far, this level has held for two sessions, but confirmation will depend on today’s daily close, roughly 12 hours from now. With inflation concerns resurfacing and central banks showing renewed interest in gold reserves, the macro backdrop still favours strength in the long term. Many are calling for a top in gold after this explosive rally, but as history shows, tops are rarely that obvious. If this support zone, defined by the BBcenter and green line, manages to hold, price could push again toward $4,096, and possibly even extend to the projected “Next Move Beyond 161.8%” level around $4,446. Bias: Cautiously bullish, support cluster holding, watching daily close for confirmation of continuation. Always take profits and manage risk. Interaction is welcome.GOLD Daily – Green Line Holds, Momentum Returns The green support line held firm as price reclaimed the 0.5 Fibonacci retracement level and is now targeting the next resistance around 4446 $. Technical Overview Structure remains bullish short-term A daily close above 4446 $ would confirm a breakout and open the path toward 5000 $. Failing to hold above 4446$ would reintroduce downside risk toward the 0.5Fib level support near 4100 $ or 3900$. Macro Context The renewed rush for physical gold, with queues forming at bullion dealers, often signals a late-cycle sentiment peak rather than the start of a new wave. When retail investors rush to secure metal at record prices, it’s less about strategic hedging and more about FOMO driven demand, which historically appears near market tops. The **U.S. government shutdown** debate has amplified this sentiment. When fiscal policy credibility is questioned, the instinctive move is toward assets outside the system, gold being the oldest and most trusted of them. At the same time, slowing Treasury issuance and elevated real yields are creating a tug-of-war: institutional money trims paper exposure while retail flows into physical. Interpretation The macro backdrop supports sustained demand as confidence in traditional governance weakens. While short-term traders eye technical resistance at 4446 $, long-term participants see gold’s rise as a reflection of deeper structural unease, a mirror of declining trust, not just price momentum. Bias: Bullish while above 0.5 Fib. Watching the 4446 $ resistance for continuation confirmation.Gold Daily – Exhaustion at 4381$, Healthy Pullback in Progress Gold approached the 4446$ resistance and printed a new ATH at 4381$, before momentum began to fade. RSI has rolled over, and volume divergence confirms exhaustion after one of the strongest rallies since August. From a technical perspective, this rejection isn’t a top, it’s a reset. Gold often experiences sharp pullbacks, even within strong bull trends. A 10% retrace into the 3944$ support zone fits perfectly within a healthy, long-term structure. That level, the green support line, that has defined the trend since late summer. If price holds there, buyers could regain control and attempt another move toward 4446$. If not, the next key support sits around 3746$ (161.8% Fib) still within the larger uptrend channel. From a macro standpoint, this is what strength consolidation looks like: Physical demand remains high, fiscal uncertainty persists, and gold’s long-term bid as a trust hedge stays intact. Bias: Neutral-to-bullish, a cooling phase inside a secular uptrend. Watching $3944 for stabilization.
vagada
XRP Daily – Can the 0.236 Fib Hold Again?

XRP Daily – Testing Support at the 0.236 Fib Level XRP is once again trading in the green support area that has held since the beginning of August. This zone aligns with the 0.236 Fibonacci level and forms the base of a descending triangle, with the series of lower highs creating its upper boundary. Price has also lost the 50MA, and from a system perspective, the structure confirms a short-term downtrend, with Price < MLR < SMA < BBcenter. If this triangle breaks to the downside, the next significant support sits at the 200MA at $2.60. Momentum indicators remain weak: RSI is below its moving average and trending downward, while MACD has already turned red, showing fading strength. With the broader market showing signs of consolidation after BTC ATH, XRP reaction here could reveal how altcoins handle pressure at key supports. For now, this support zone remains key; losing it would confirm a bearish breakout from the triangle pattern. Bias: Short-term bearish, watching the 0.236 Fib and 200MA as critical levels for reaction. Always take profits and manage risk. Interaction is welcome.
vagada
BNB Daily – Between Resistance and Continuation

BNB Daily – After the Run, Testing Its Range Since July, BNB has delivered an impressive rally. Back then, price was sitting near the 61.8% Fibonacci level, and from there it climbed all the way to a new all-time high at the 161.8% Fib extension, which is now acting as resistance. On October 7 and 8, intraday moves briefly pushed above this level, but both sessions failed to close above it, leading to a clear rejection on October 9, confirmed by a large downside volume bar. From a system perspective, the structure remains in an uptrend, with MLR > SMA > Price > BBc indicating that despite the pullback, the broader bullish structure is still valid. Key levels to watch: Resistance: 161.8% Fib at $1310 Support: BB Center (orange) at $1198 If BNB can hold above the BB Center, it keeps the upper hand and could attempt another move toward its ATH. However, a daily close below the BB Center would shift the short-term momentum bearish, opening room for further downside. Periods like this often decide whether a move becomes continuation or distribution: patience around key levels pays off. Bias: Neutral-bullish — uptrend intact, but watching the BB Center closely for confirmation. Always take profits and manage risk. Interaction is welcome.
Disclaimer
Any content and materials included in Finbeet's website and official communication channels are a compilation of personal opinions and analyses and are not binding. They do not constitute any recommendation for buying, selling, entering or exiting the stock market and cryptocurrency market. Also, all news and analyses included in the website and channels are merely republished information from official and unofficial domestic and foreign sources, and it is obvious that users of the said content are responsible for following up and ensuring the authenticity and accuracy of the materials. Therefore, while disclaiming responsibility, it is declared that the responsibility for any decision-making, action, and potential profit and loss in the capital market and cryptocurrency market lies with the trader.