
LTC
Litecoin
| Trader | Signal Type | Profit Price/Stop Loss Price | Publish Time | View Message |
|---|---|---|---|---|
 XTrendSpeedRank: 10 | BUY | Profit Price: Not specified Stop Loss Price: Not specified | 12/8/2025 | |
 catalytsRank: 1921 | BUY | Profit Price: Not specified Stop Loss Price: Not specified | 12/9/2025 | |
 CryptoSanders9563Rank: 2928 | BUY | Profit Price: Not specified Stop Loss Price: Not specified | 12/13/2025 | |
 OzgunDashdanRank: 2906 | BUY | Profit Price: Not specified Stop Loss Price: Not specified | 12/9/2025 | |
 etherking69420Rank: 16353 | BUY | Profit Price: Not specified Stop Loss Price: Not specified | 12/9/2025 |
Price Chart of Litecoin
Profit 3 Months :
Signals of Litecoin
Filter
Sort messages by
Message Type
Trader Type
Time Frame

karwanbk
LTC can break this falling wedge
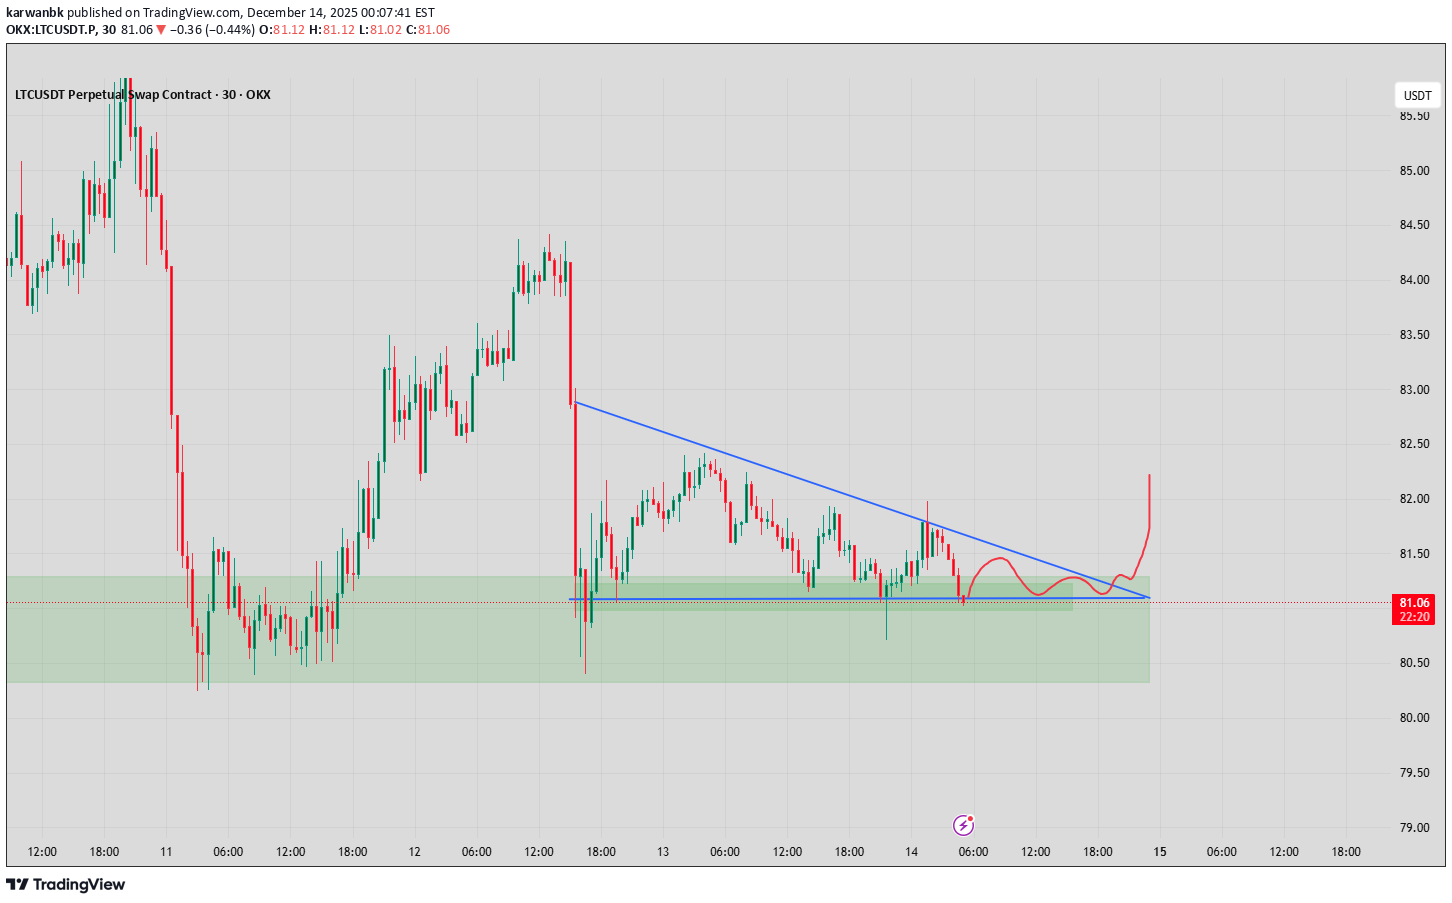
we may see bullish push after breaking that falling wedge structure

ArmanShabanTrading
LTC/USDT | LTC Drops Hard but the Real Opportunity Might Be Ahea
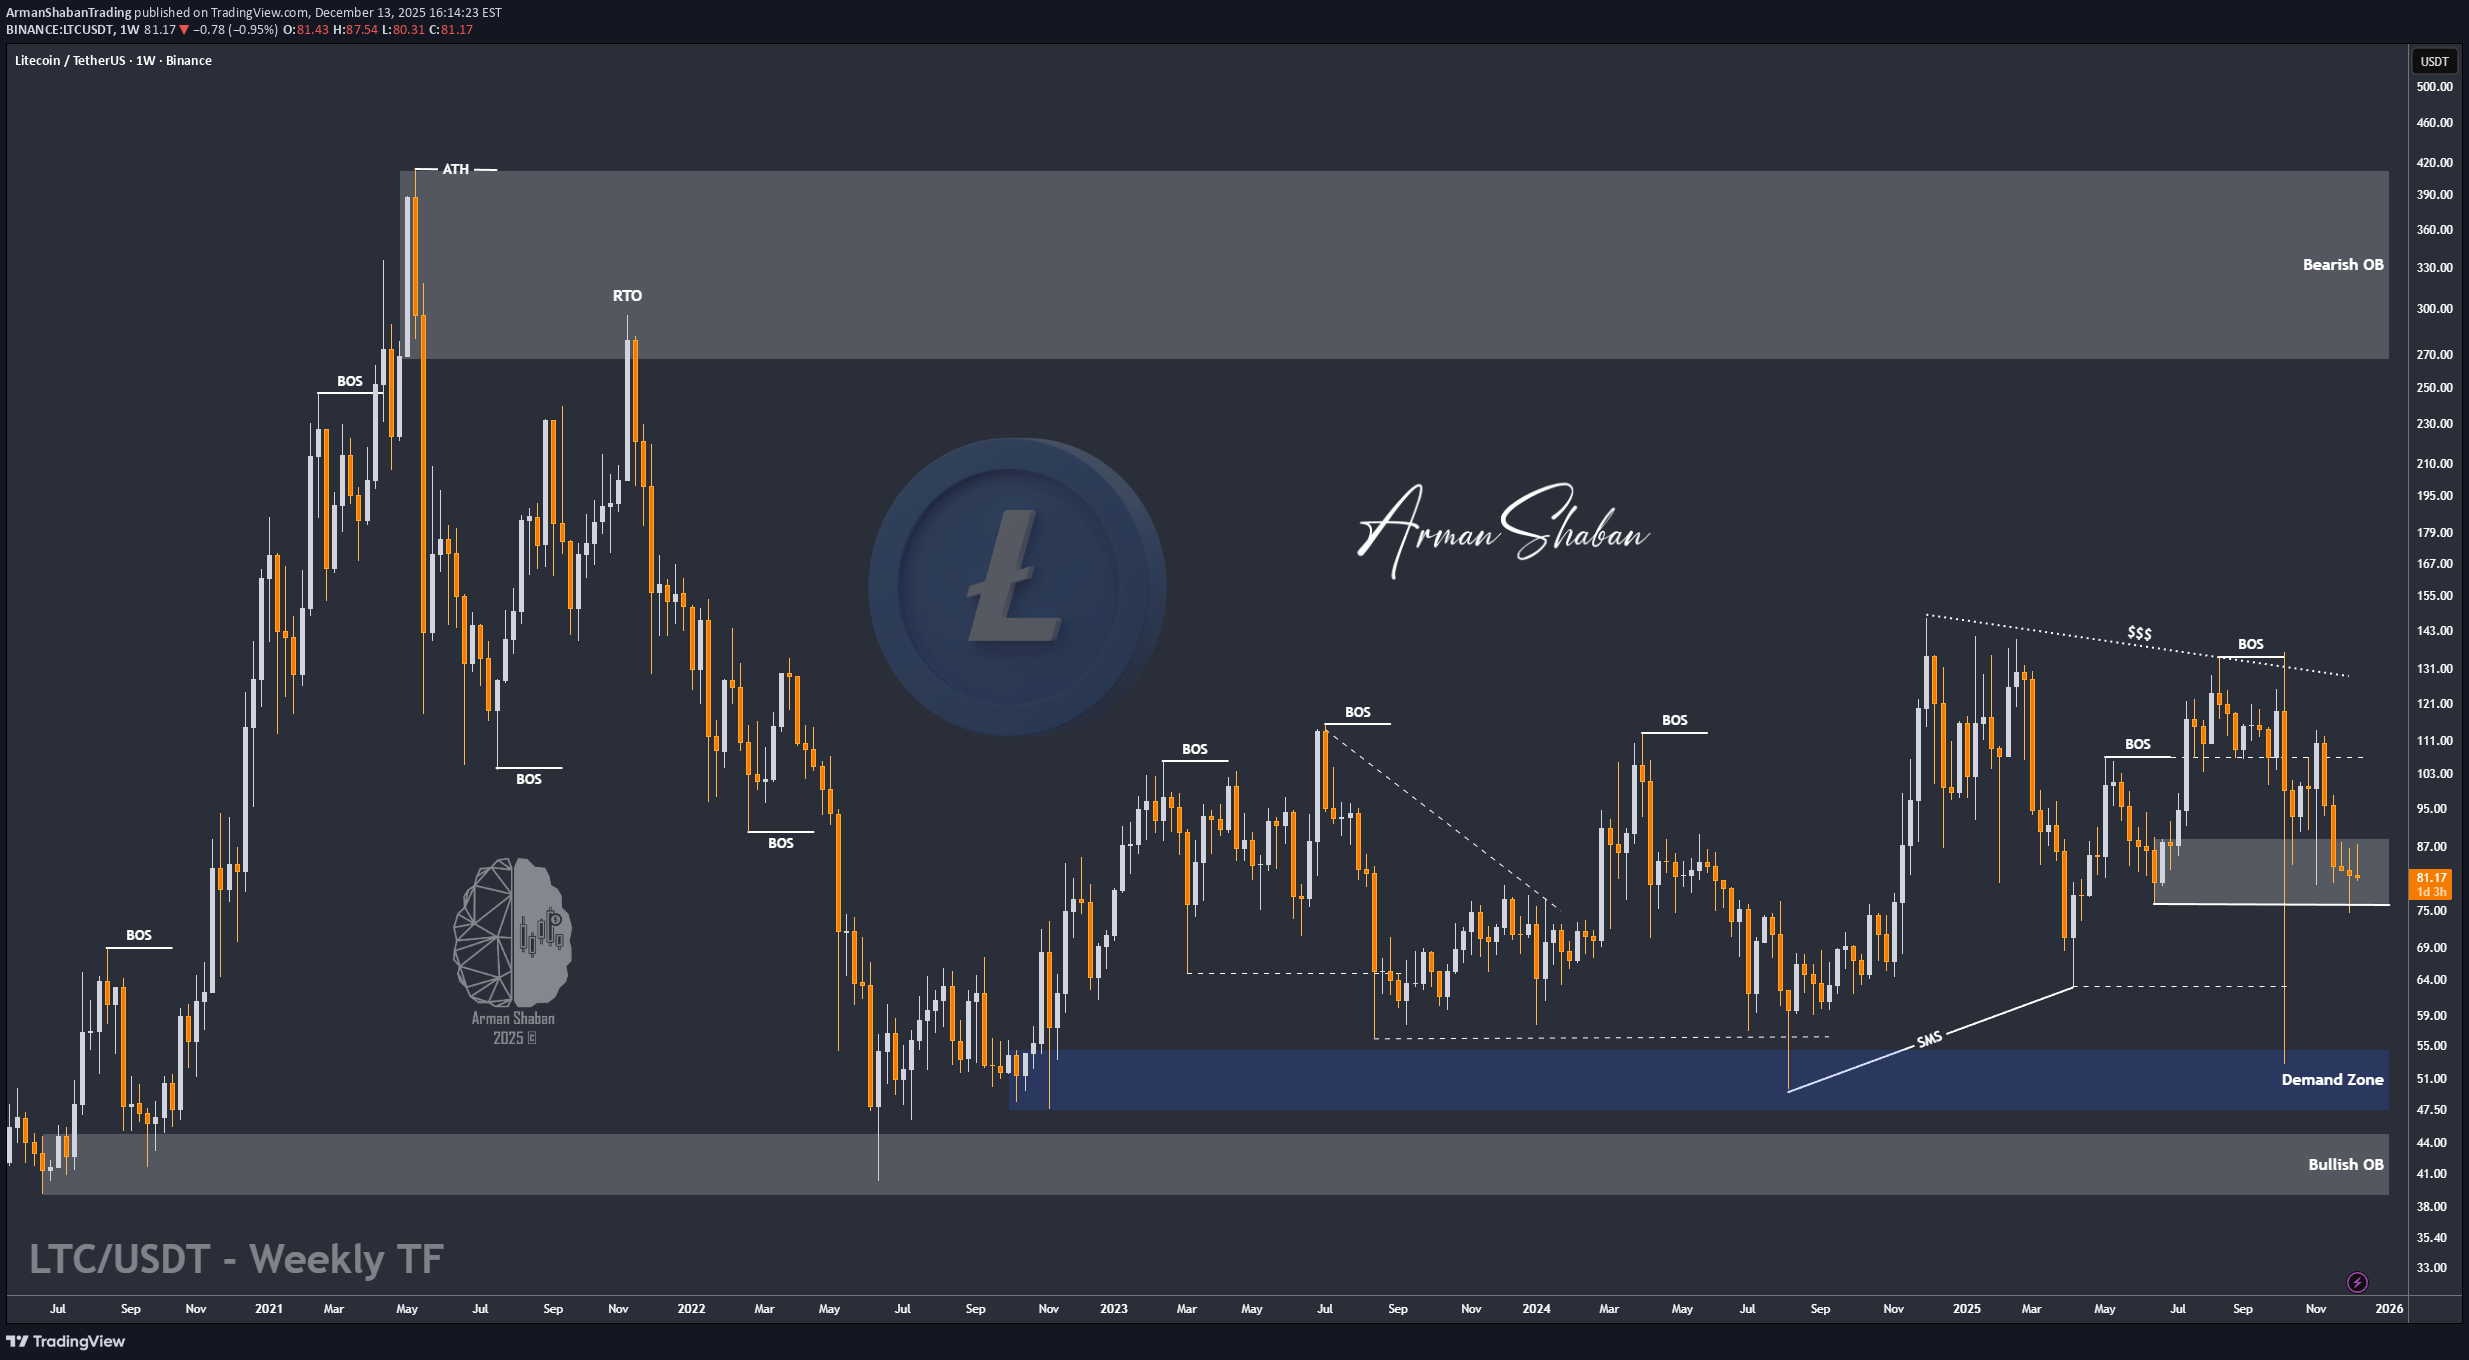
LTC rallied all the way to $113 before getting slammed with a heavy correction, dropping more than 34% down to $75. Right now Litecoin is trading near $81 and the momentum is still clearly bearish. As long as this pressure continues, I expect a deeper correction toward the $63 to $70 demand zone. This is the area that really matters for the next major move. If Litecoin reaches this zone and shows a clean bullish reaction, it becomes a high-interest region for a strong mid-term reversal. A proper reaction here can easily trigger a 100%+ upside move in the coming weeks or months. For now I’m watching to see how price behaves as it approaches $63 to $70 because that’s where the next big opportunity is likely to form. Please support me with your likes and comments to motivate me to share more analysis with you and share your opinion about the possible trend of this chart with me ! Best Regards , Arman Shaban

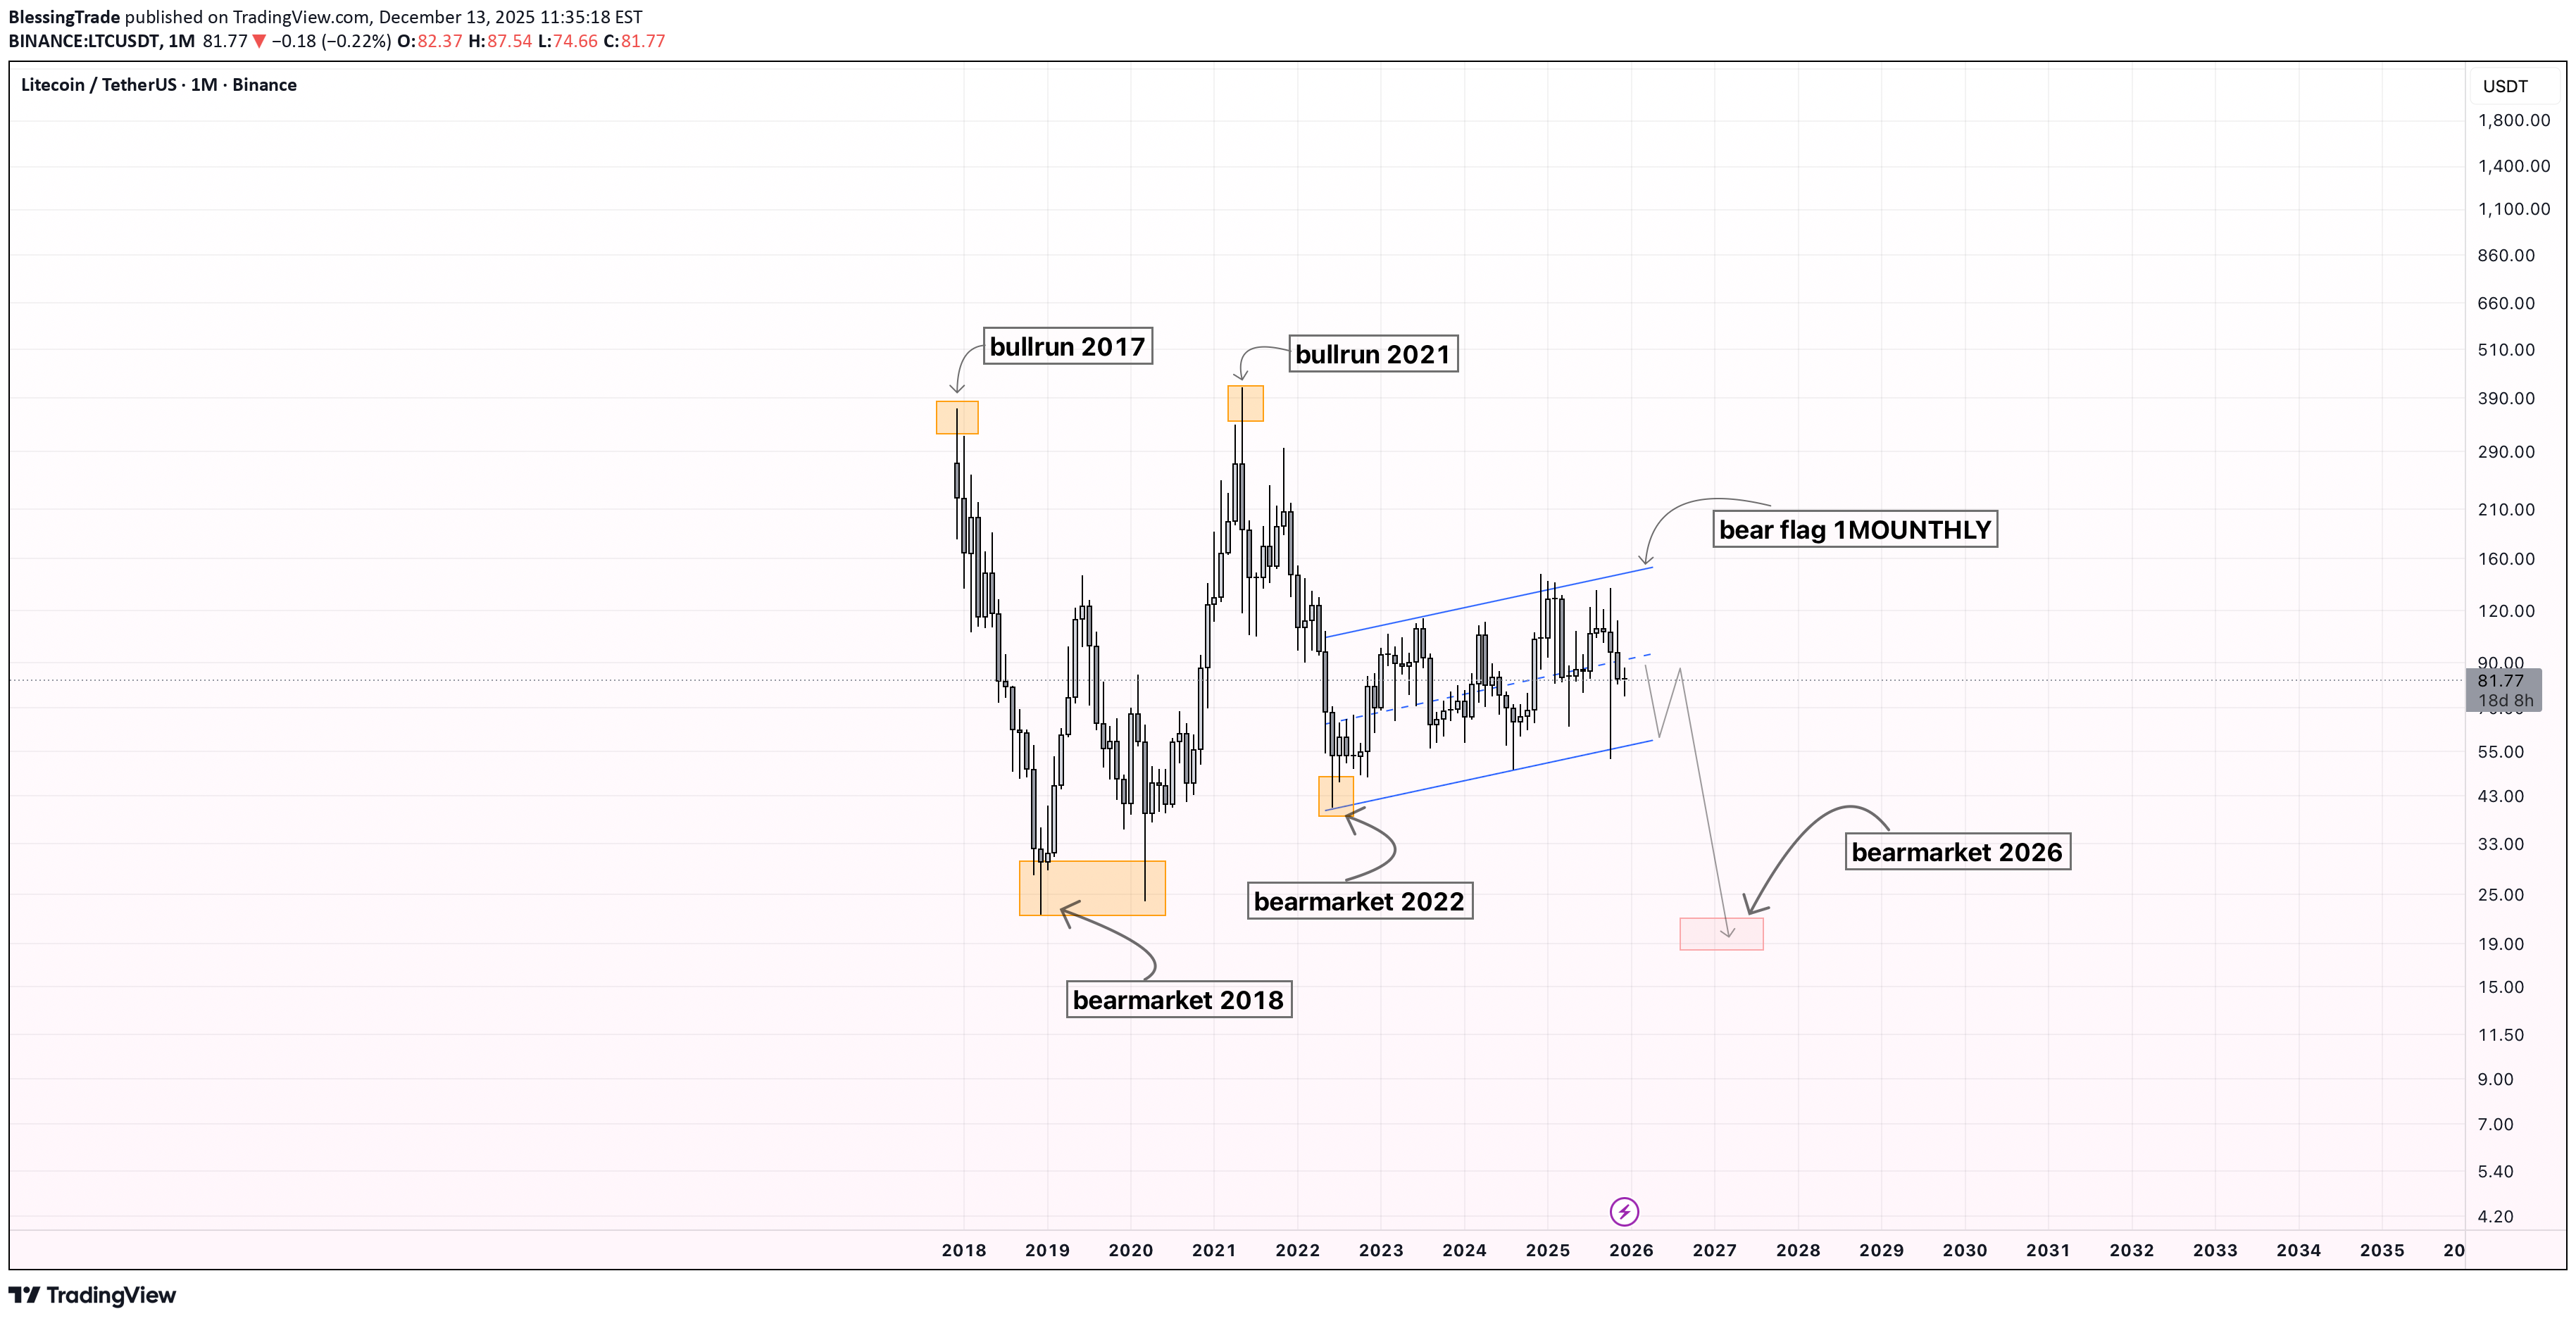
During previous bull runs (2017 and 2021) , Litecoin consistently made new all-time highs , breaking above prior peaks. However, an important historical pattern stands out: each bear market formed higher lows , suggesting long-term range compression. At the current stage, this structure appears to be changing. Price remains in a prolonged consolidation phase, and a bear flag has formed on the monthly timeframe, which is a classic bearish continuation pattern following a strong downside impulse. Based on the overall market cycle structure and historical behavior, I expect a breakdown below previous bear market lows, with a new cycle bottom forming in the $24–20 range. Key factors: Clear bear flag on the 1M timeframe Lack of a sustained uptrend since the 2021 peak Weak bullish momentum and distribution structure Market cycle dynamics Cycle outlook: 2026 is expected to be a bearish year, potentially marking the final phase of this downtrend and the establishment of a macro bottom. Invalidation: A sustained breakout and hold above the upper boundary of the monthly bear flag would invalidate this bearish scenario. This idea is designed for long-term traders and investors who analyze the market through cycle behavior and macro structure, rather than short-term price fluctuations.
CryptoSanders9563
LTCUSDT (4H) chart update !!
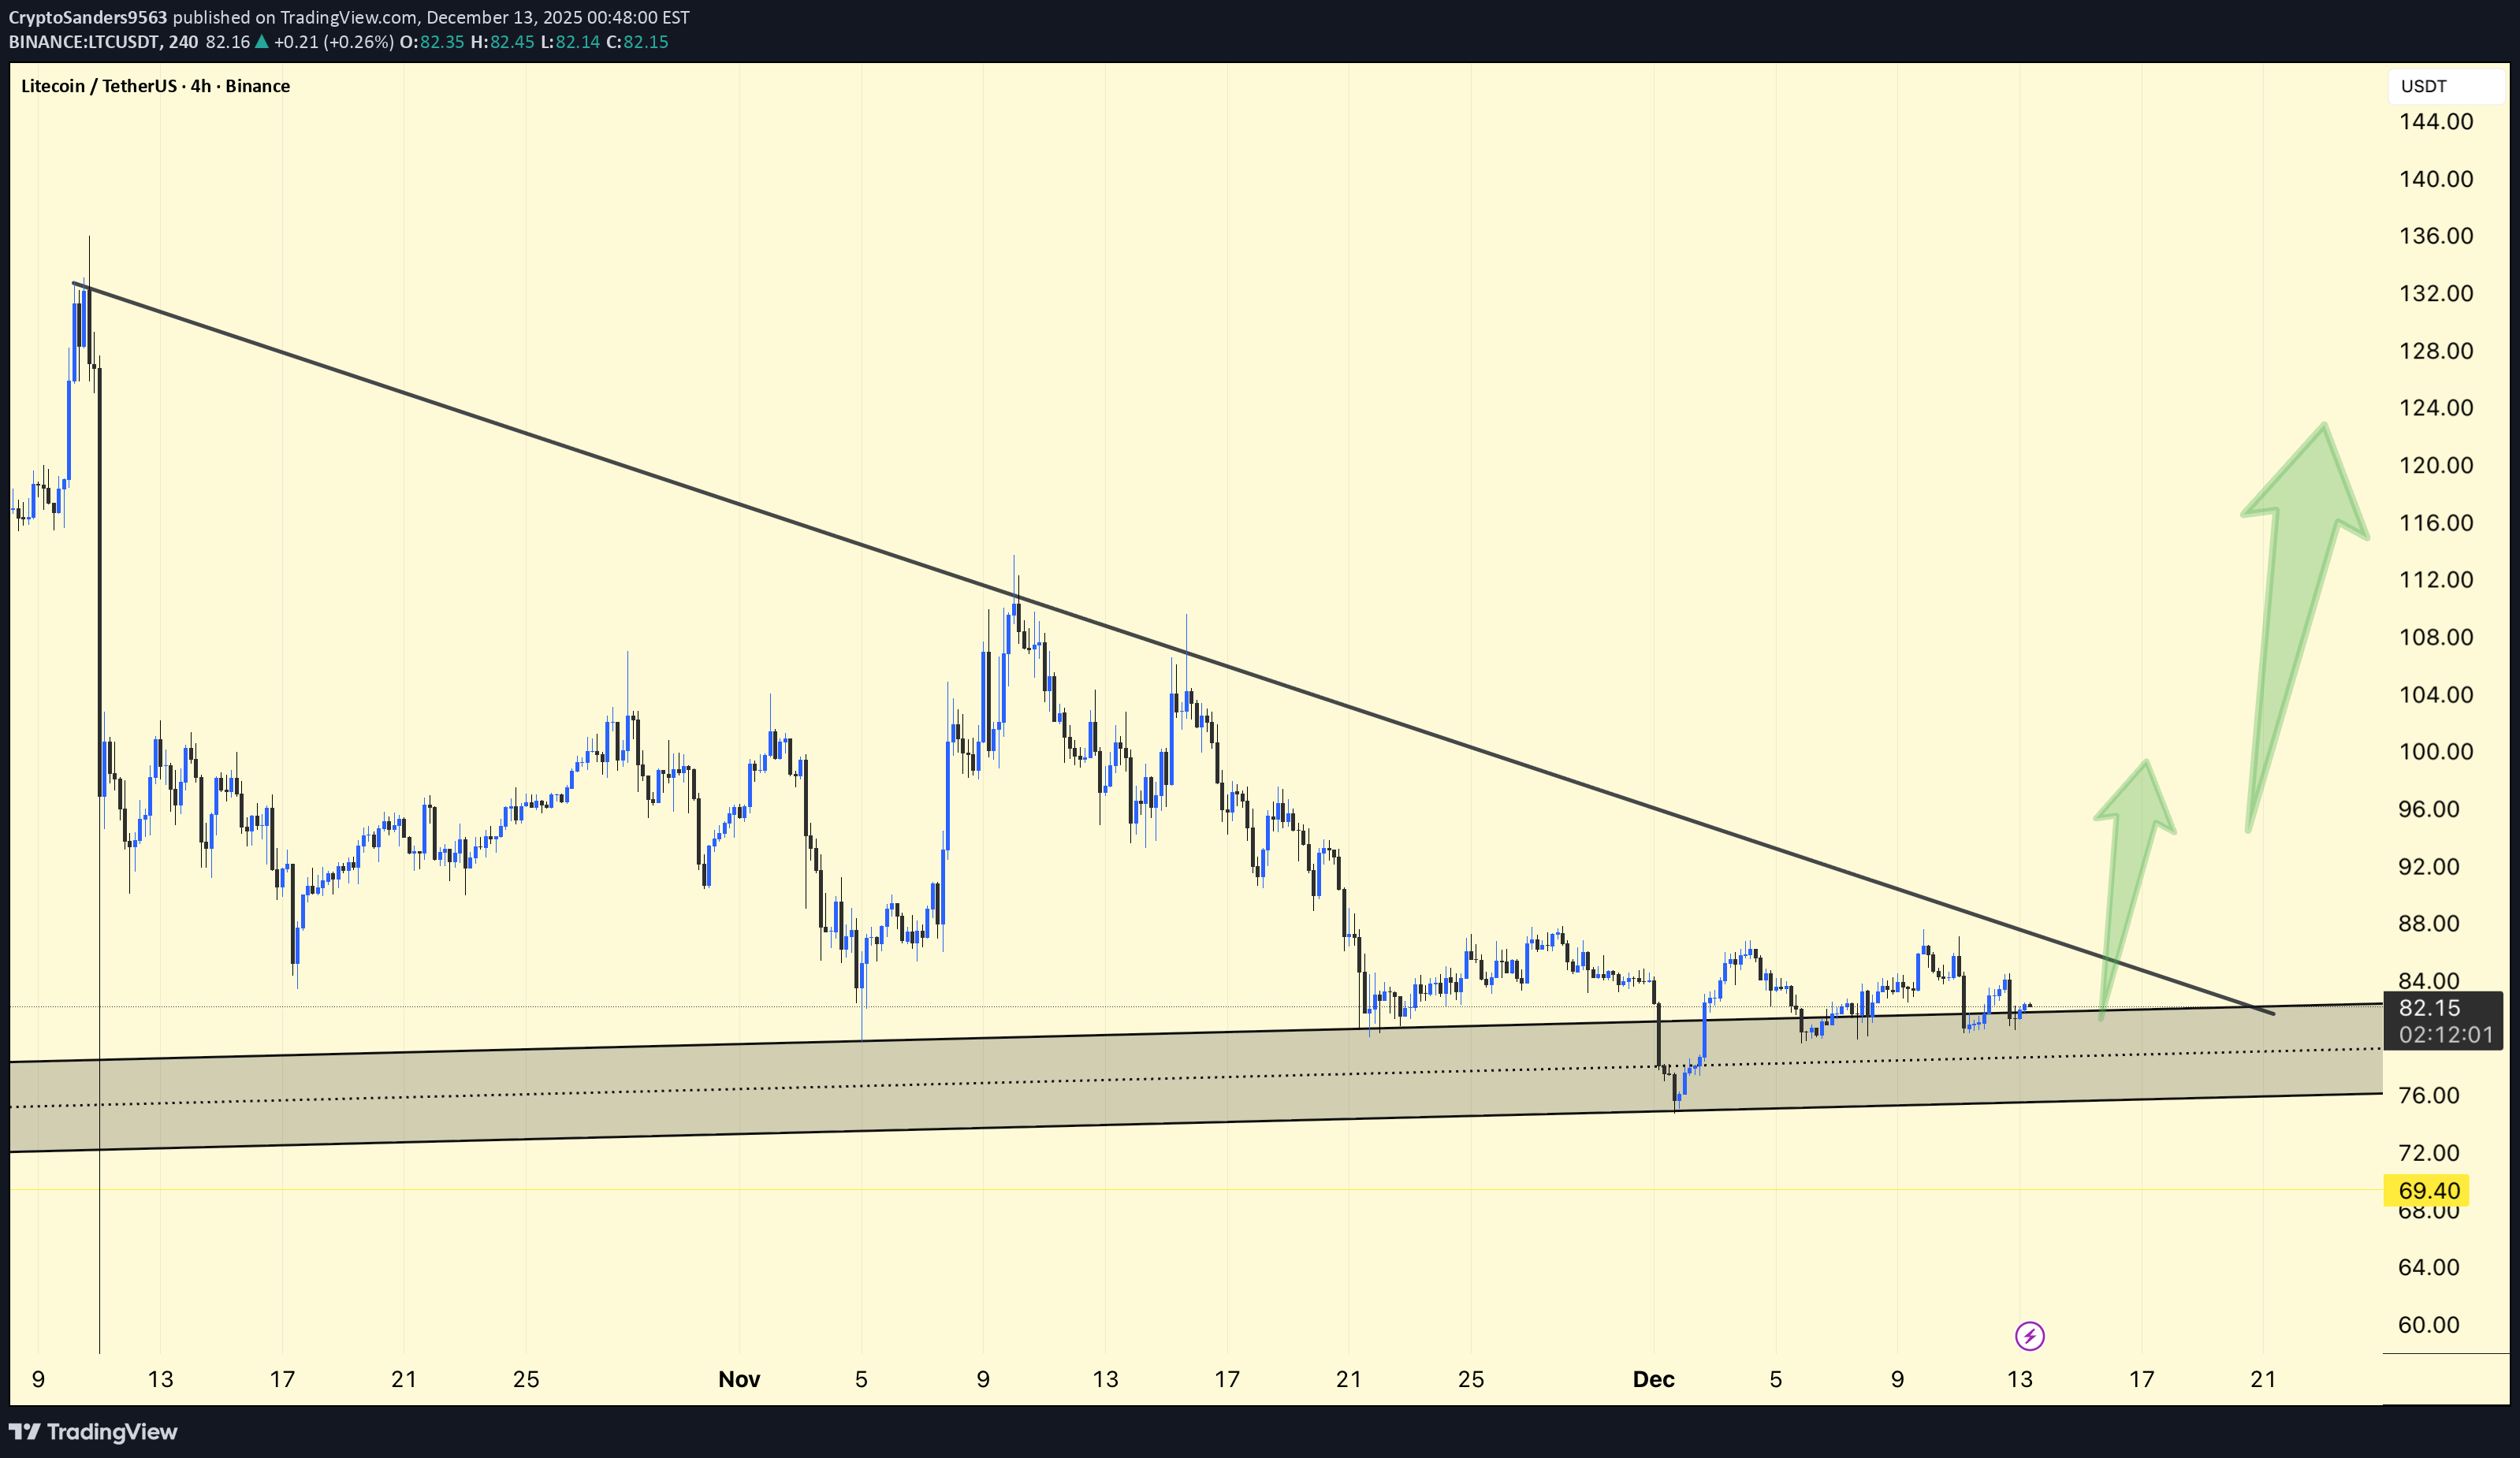
Litecoin is holding a strong demand zone around 76–80 and moving sideways under a long-term descending trendline. A confirmed breakout above the trendline (~84) could trigger a bullish move toward 92, then 100, and ultimately 120. If the price falls below the 76 support, the downside risk remains toward 69. Bias: Neutral → Bullish on breakout. DYOR | NFA.

Crypto-by-PRIME
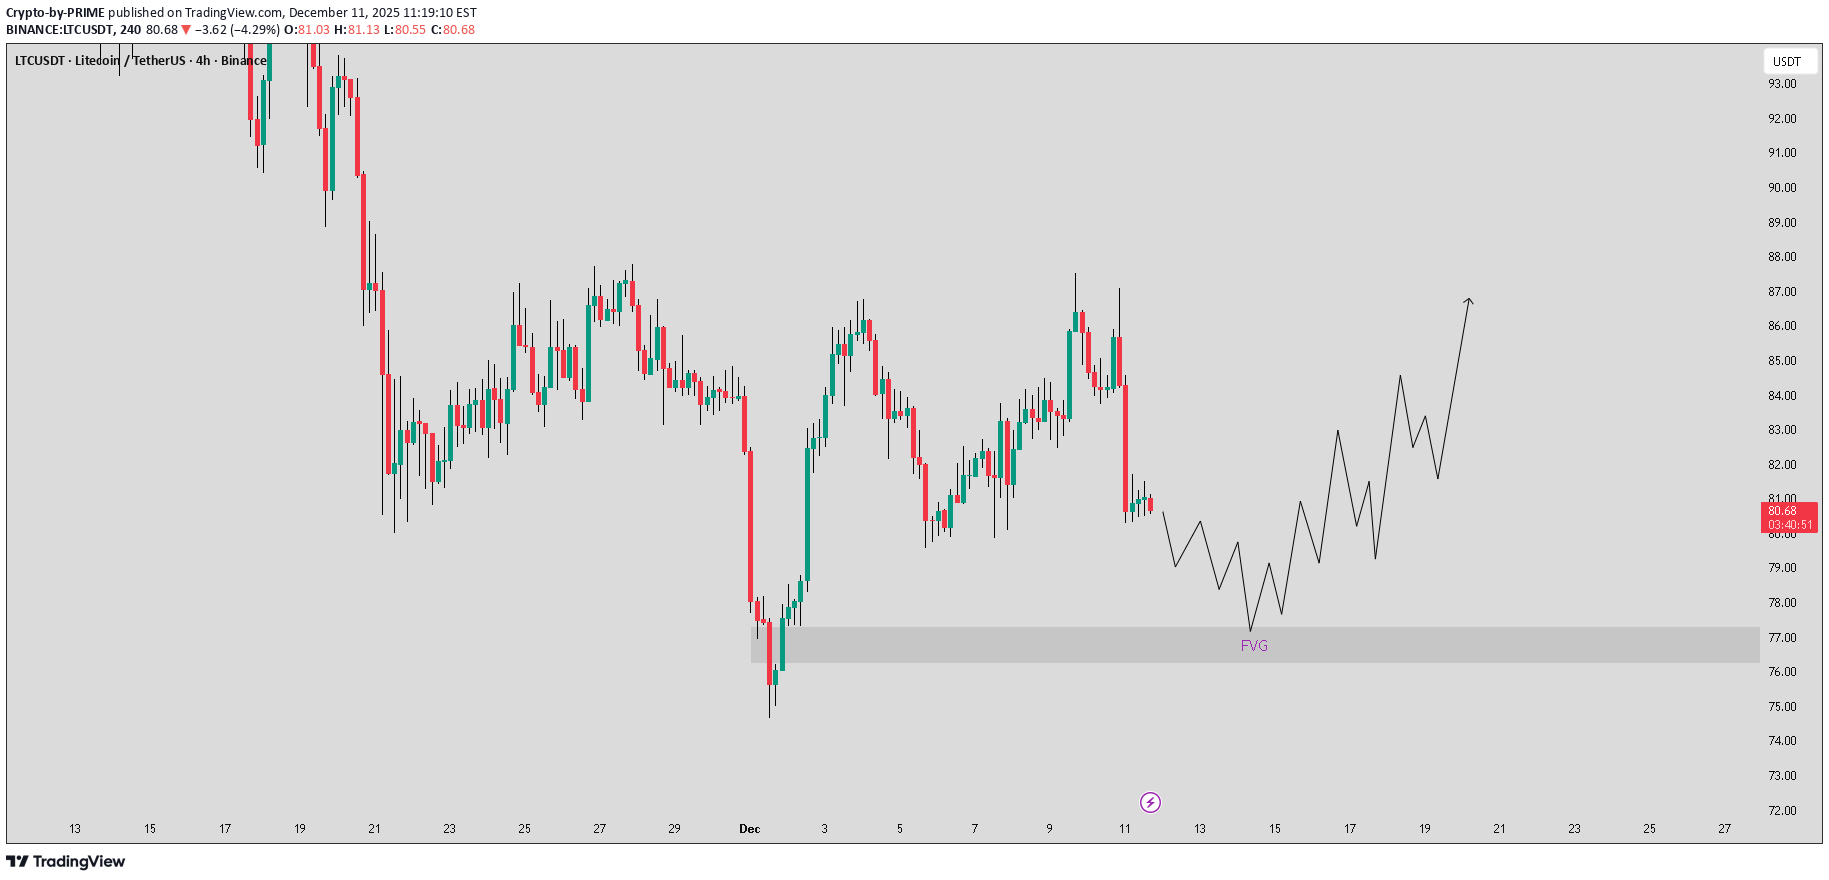
LTC is showing clear weakness and continues to drift lower, likely heading toward the 4H FVG zone at $76.2–$77.3. This area will be key for a potential reversal. If price reacts strongly from this zone, a clean recovery move toward the EQH liquidity level at $87.5 is expected. Manage risk wisely and wait for confirmation.
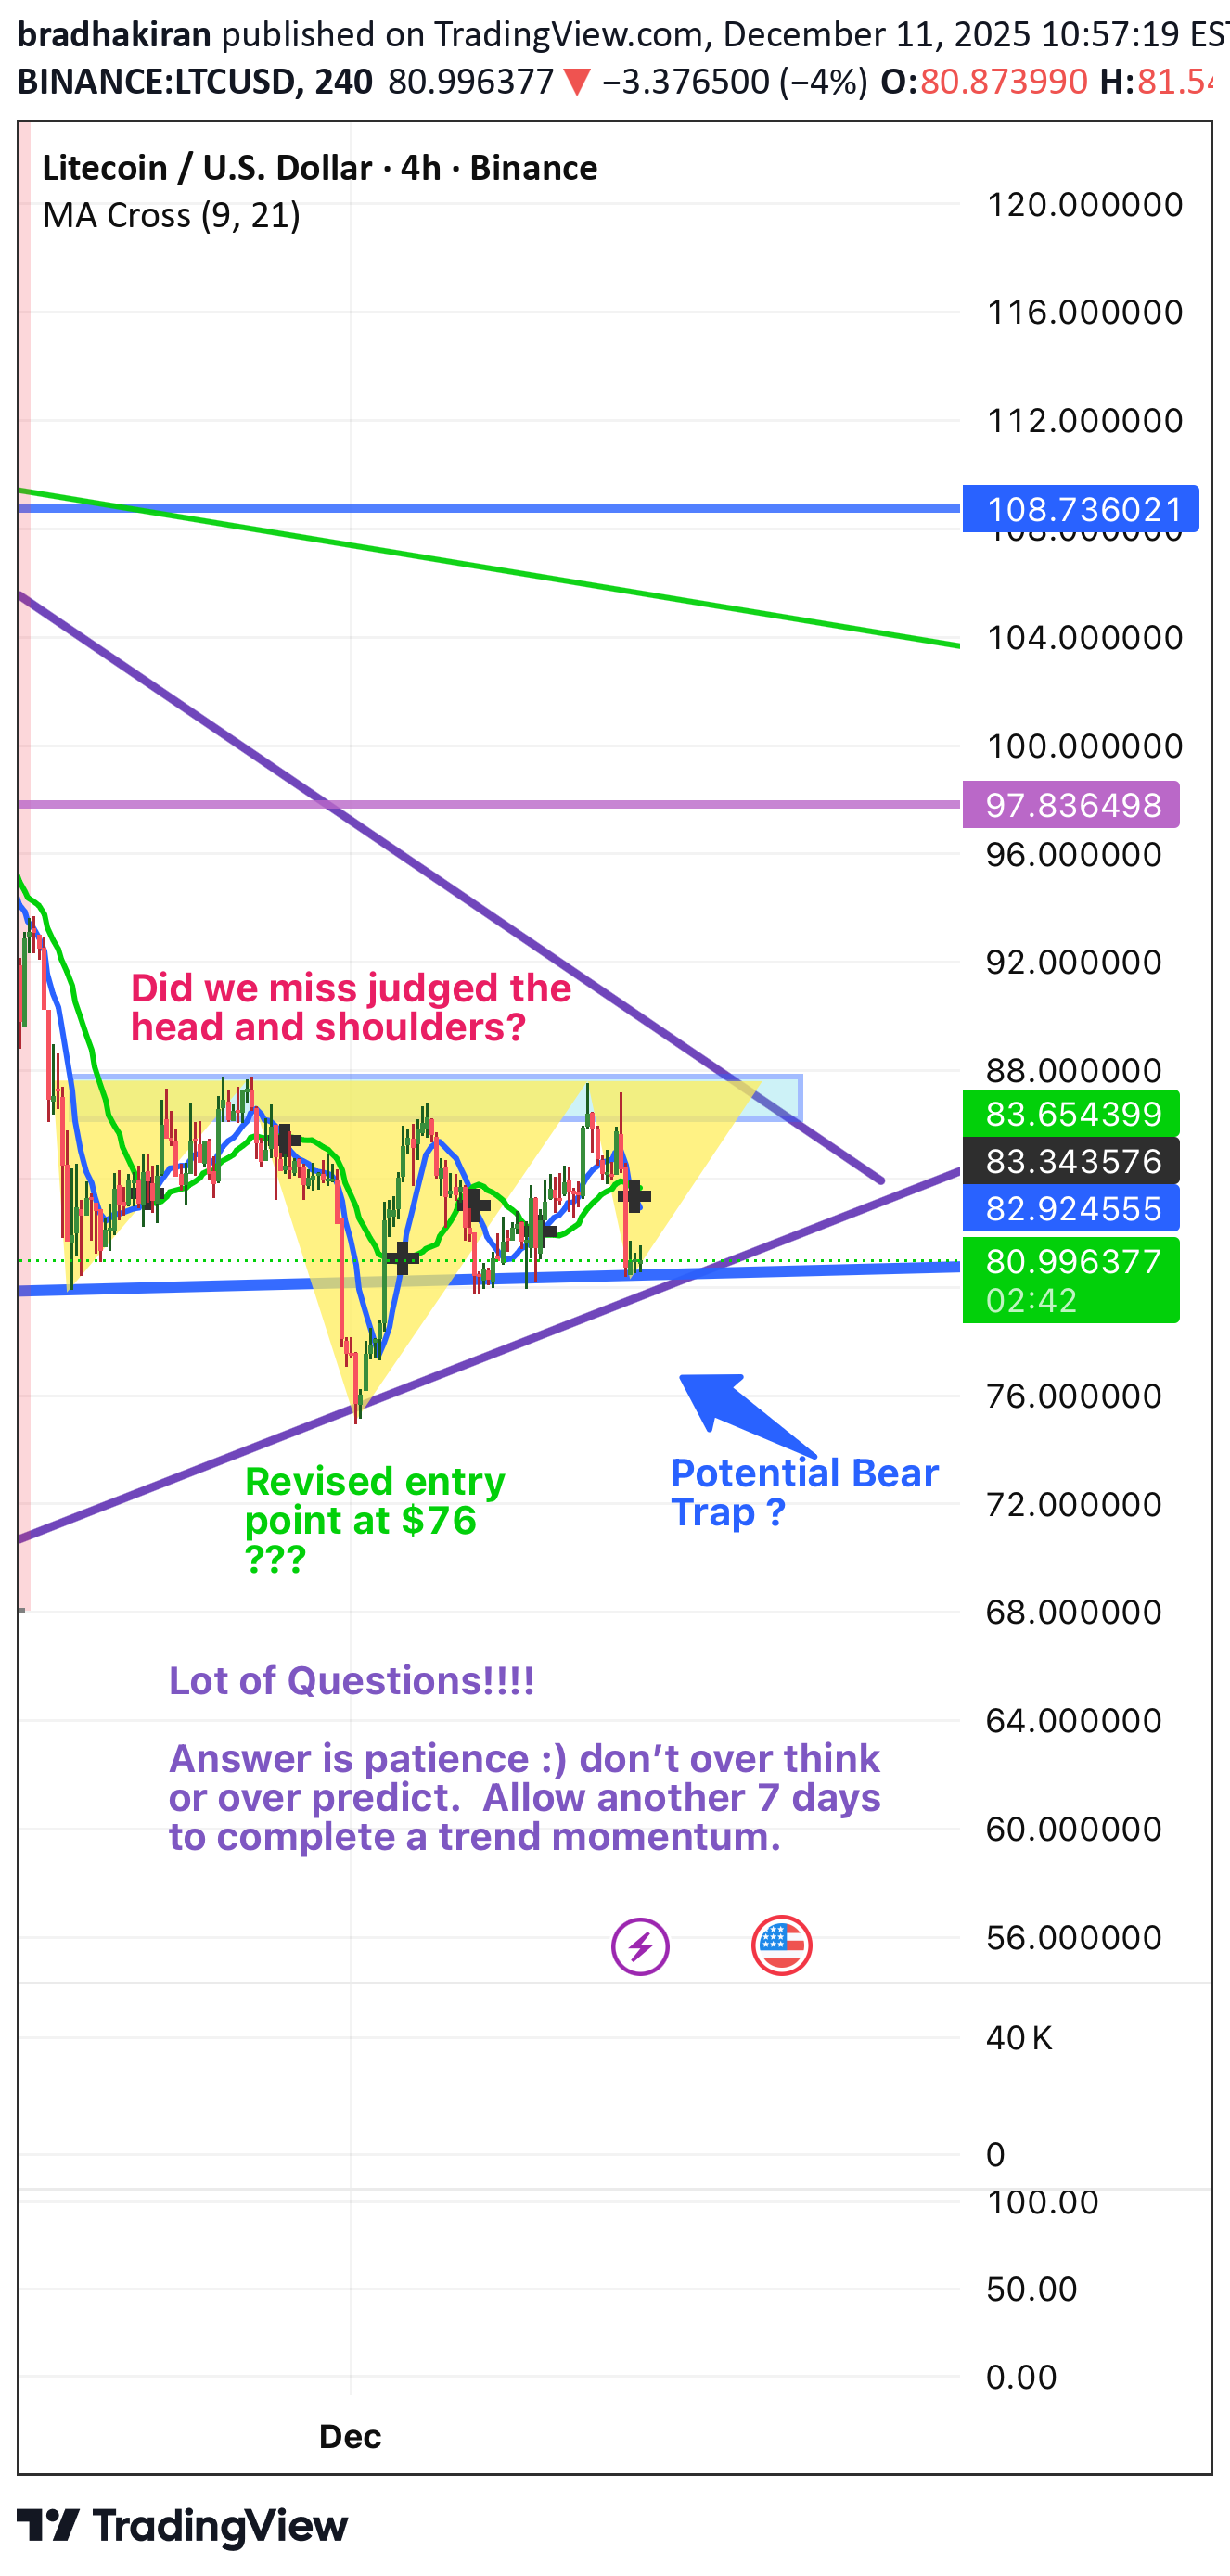
I still consider the LTC a Buy, for a potential of good returns and growth by 2027. At present it looks like many manipulators raising the fear index and making price fail under low volatility conditions. If we have to not fall in trap the only way is to stay patience even it shows a sharp fall to 65. Don’t make panic selling and account losses on your ledger. Let the market stable. Consider your 2x to 4x returns only by 2027 and stay quiet for now. Just my opinion, be cautious on your investment strategy decisions.

skainn
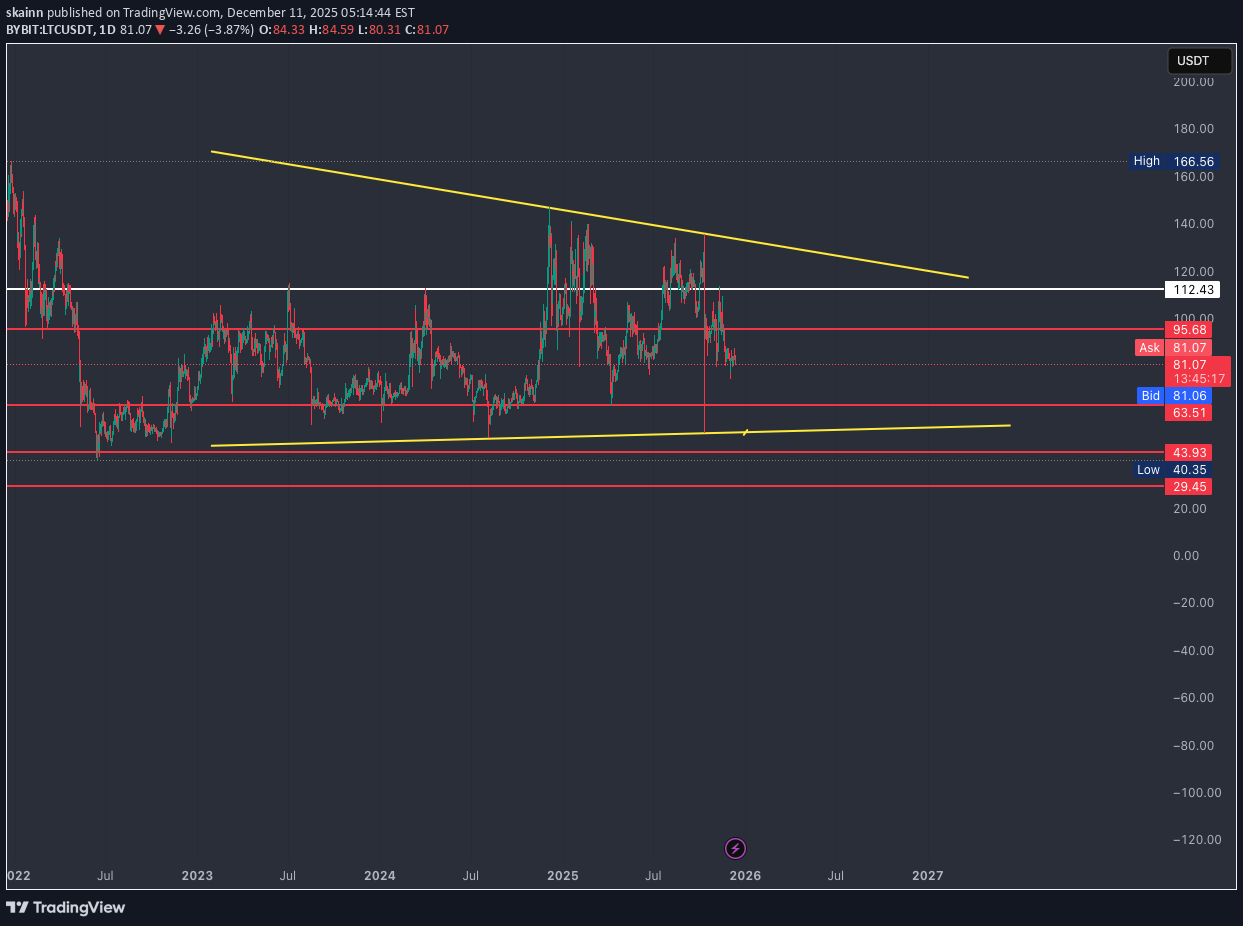
Dear Traders heres the path of ltc on weekly lets see if this can play out

CryptoAnalystSignal
#LTC/USDT analysis.Give me some energy !!!
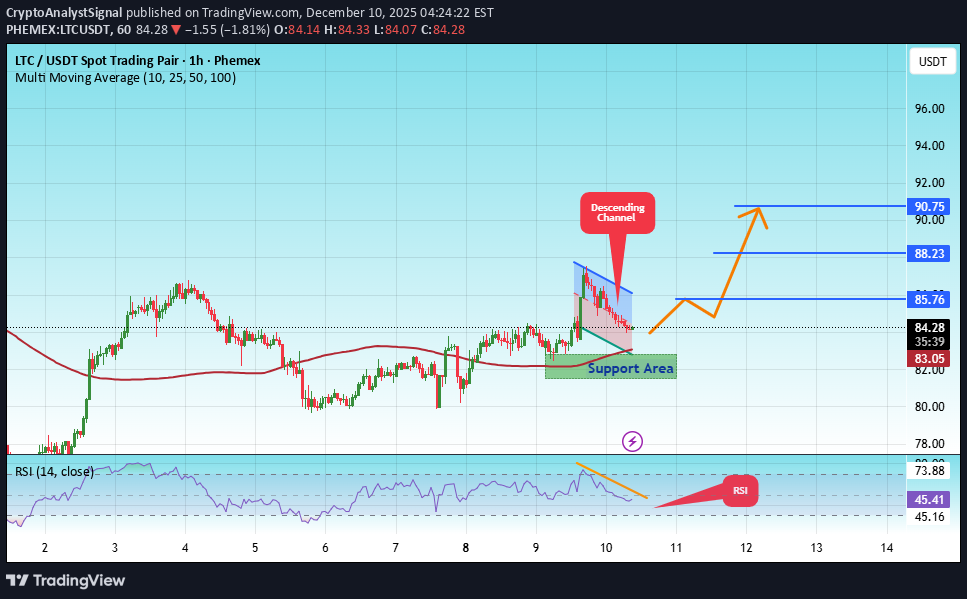
#LTC The price is moving in a descending channel on the 1-hour timeframe. It has reached the lower boundary and is heading towards breaking above it, with a retest of the upper boundary expected. We have a downtrend on the RSI indicator, which has reached near the lower boundary, and an upward rebound is expected. There is a key support zone in green at 82.00. The price has bounced from this level multiple times and is expected to bounce again. We have a trend towards stability above the 100-period moving average, as we are moving close to it, which supports the upward movement. Entry price: 84.29 First target: 85.76 Second target: 88.23 Third target: 90.75 Don't forget a simple principle: money management. Place your stop-loss below the support zone in green. For any questions, please leave a comment. Thank you.

Cryptollica
LITECOIN / NEW AGE LTC Target: +$500 (more)
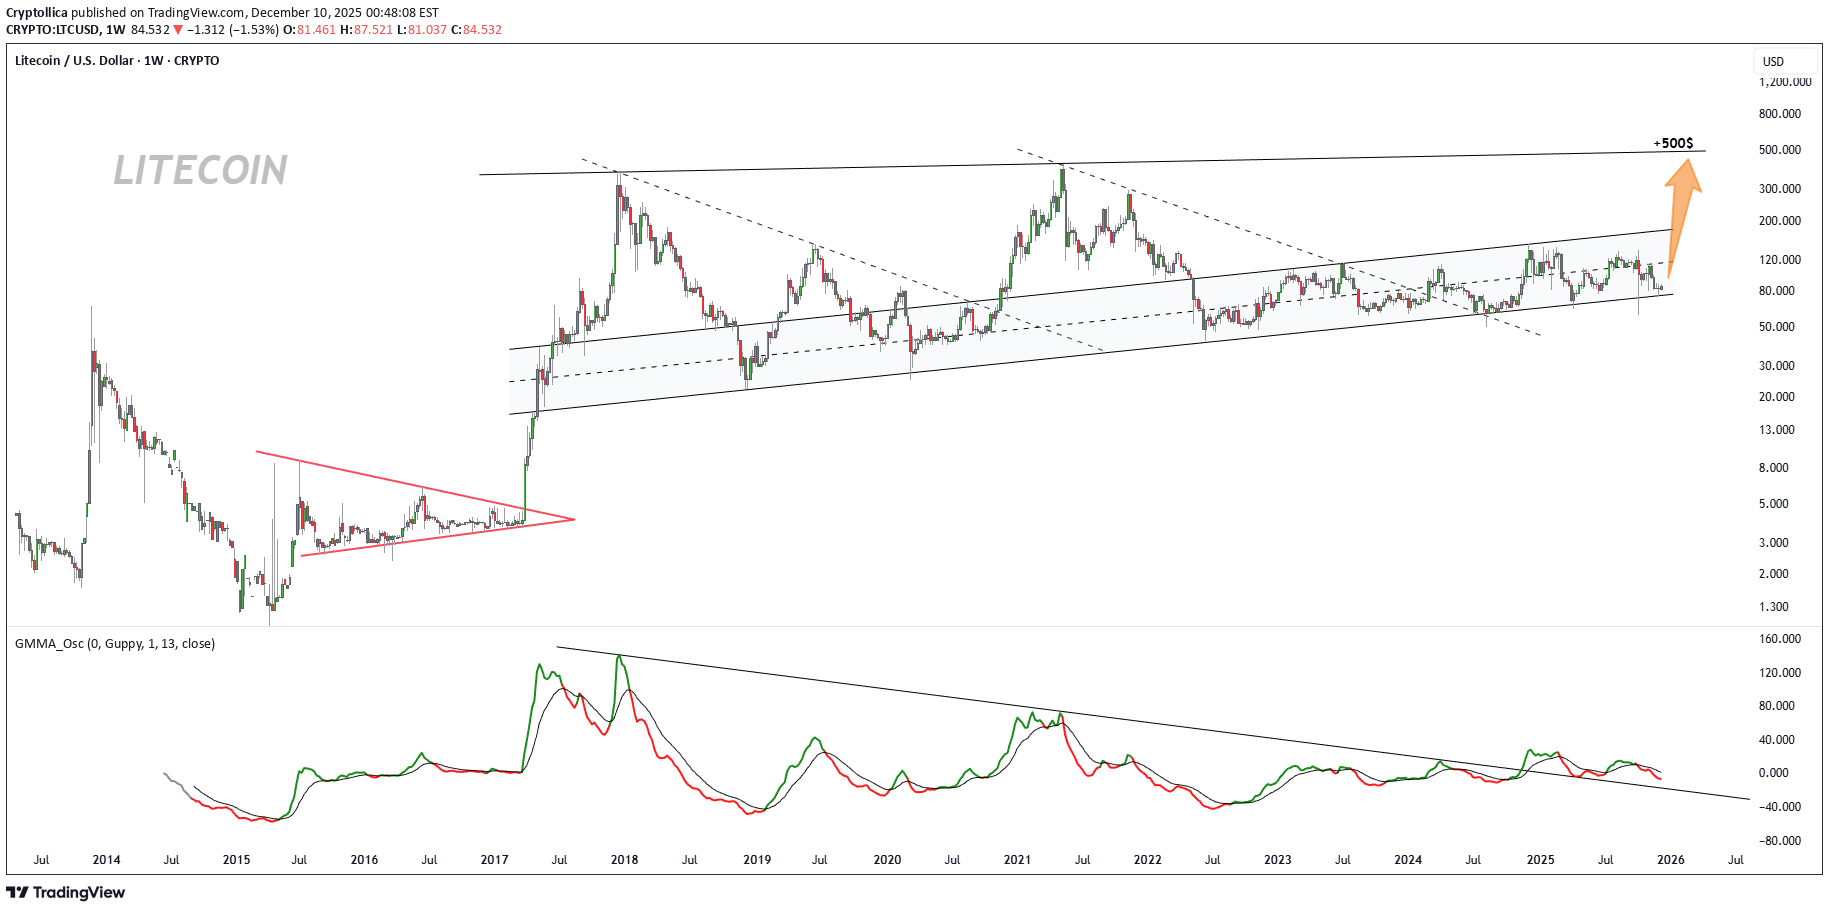
LTC is loading... ⏳ Target: $500+ Timeframe: 2026 🚨 LITECOIN (LTC) MACRO UPDATE: The Sleeping Giant Wakes 🚨 Ladies and gentlemen, the chart speaks for itself. We are looking at one of the most pristine Ascending Parallel Channels in crypto history. We are currently sitting at a "make or break" generational entry point. 1. The Macro Structure: Perfection 📐 Look at the boundaries. The algorithm is respecting the lines perfectly. The Floor (Support): We have just tapped the lower support trendline of a channel that has held since 2013. Every single time LTC touches this bottom rail (2015, 2017, 2020, 2022), it marks the absolute bottom before a parabolic run. Current Status (Dec 2025): Price is ~$84.55. We are hugging the support line. The risk/reward ratio here is mathematically asymmetric. 2. The Fractal: History Rhymes 🔄 Notice the Red Triangle structure from 2015-2016? That was pure accumulation. Boring, sideways, "LTC is dead" sentiment. Result: It preceded the legendary 2017 run to $370. Now: We have just completed a similar multi-year accumulation phase (2022-2025). The weak hands have been shaken out. The compression is done. 3. The Target: $500+ Programmed 🚀 The Orange Arrow isn't hope; it's geometry. A bounce from the bottom of the channel historically targets the top of the channel. The upper trendline for 2026 sits comfortably above $500. This implies a vertical expansion phase is imminent. LTC is loading... ⏳ Target: $500+ Timeframe: 2026
catalyts
LTCUSD--LONG
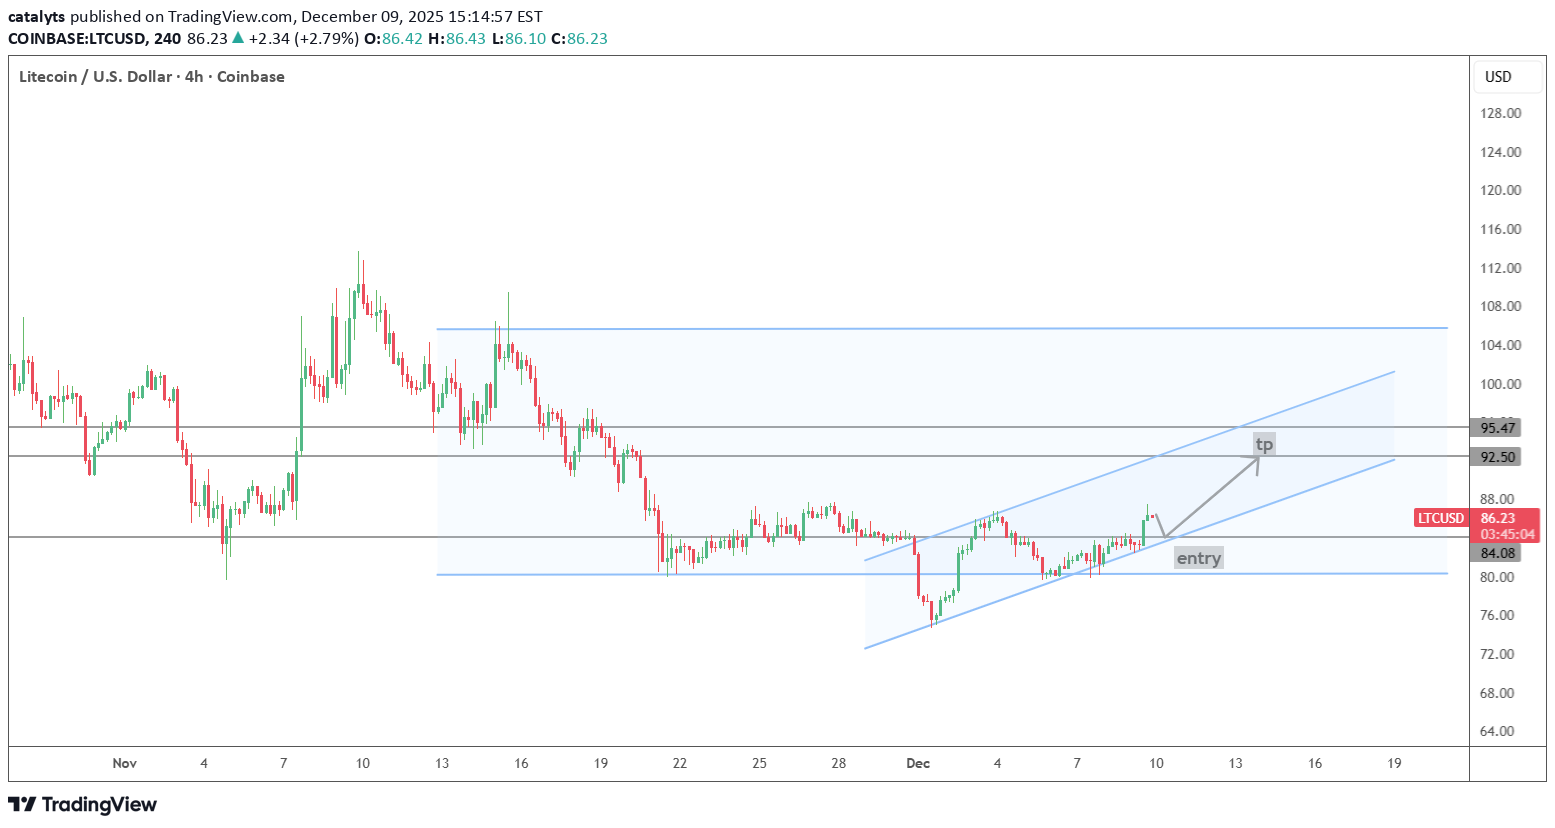
--Long bias --entry and tp levels are as shown on the chart
Disclaimer
Any content and materials included in Finbeet's website and official communication channels are a compilation of personal opinions and analyses and are not binding. They do not constitute any recommendation for buying, selling, entering or exiting the stock market and cryptocurrency market. Also, all news and analyses included in the website and channels are merely republished information from official and unofficial domestic and foreign sources, and it is obvious that users of the said content are responsible for following up and ensuring the authenticity and accuracy of the materials. Therefore, while disclaiming responsibility, it is declared that the responsibility for any decision-making, action, and potential profit and loss in the capital market and cryptocurrency market lies with the trader.