Technical analysis by ManiMarkets about Symbol PAXG on 10/29/2025

ManiMarkets
XAUUSD: Gold Battles the Key 4000 Zone

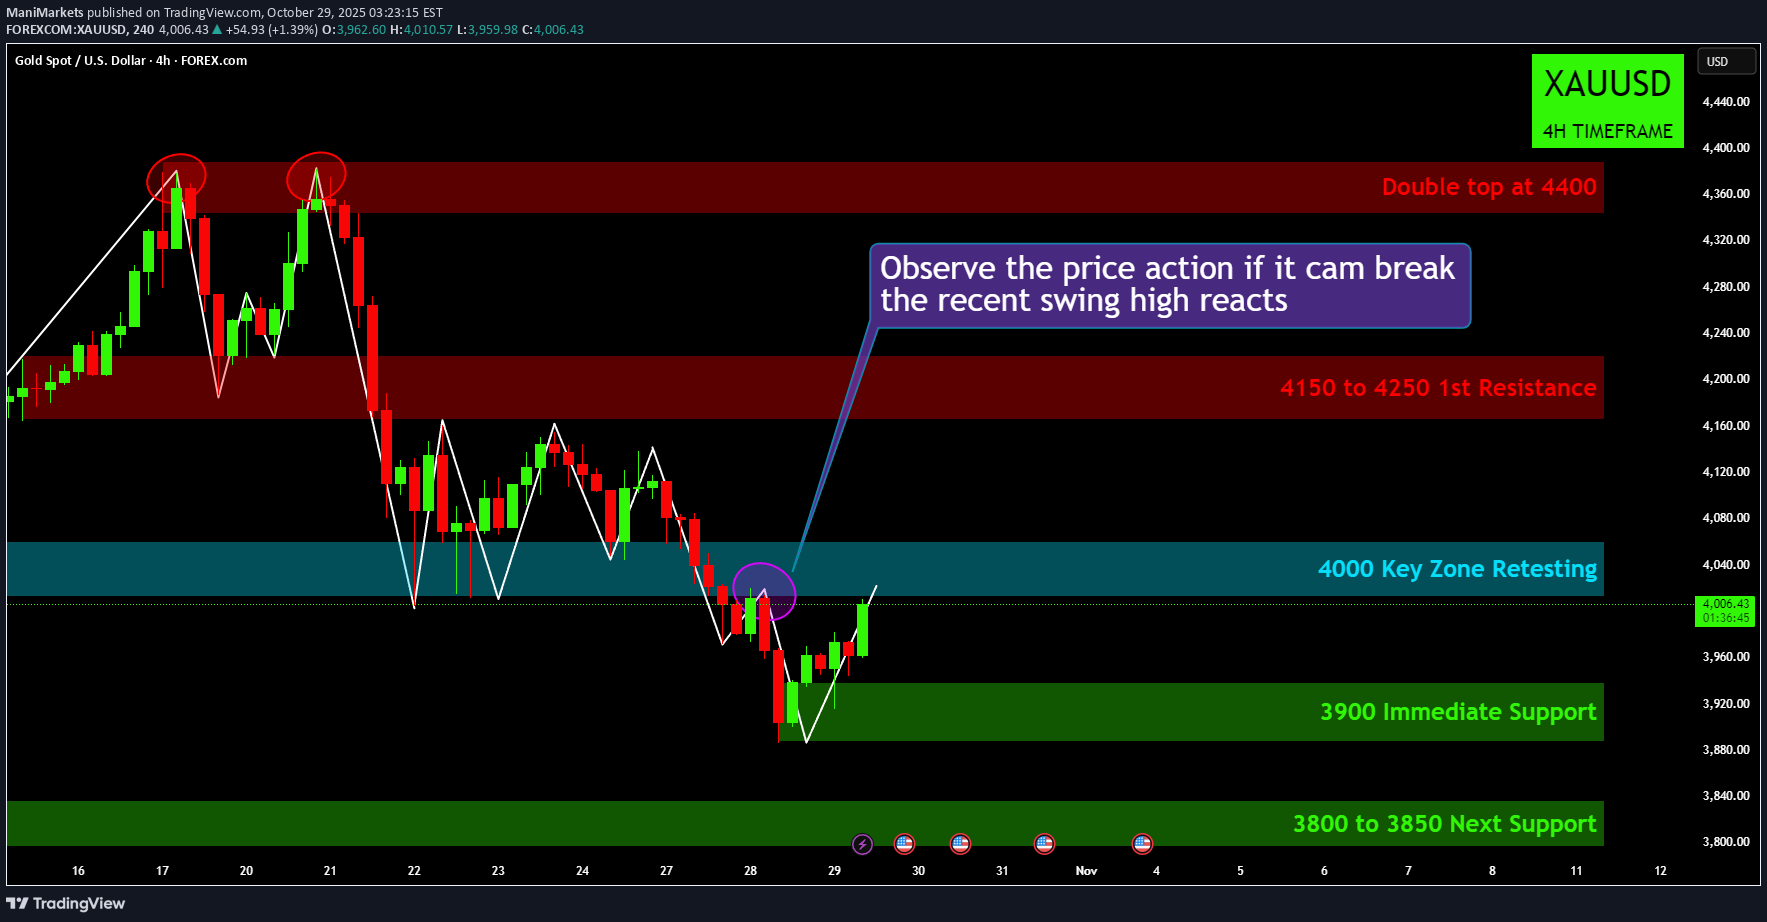
XAUUSD: Gold Battles the Key 4000 Zone Hey everyone! Let's dive into Gold (XAUUSD) on the 4-hour chart, where we've seen some dramatic moves recently. What We've Seen: Gold made a strong run earlier in the month, but was firmly rejected twice at the 4400 mark, forming a clear "Double Top" pattern (marked with red circles). This led to a significant pullback, pushing price down through several support levels. Currently, Gold has found some footing after hitting a low and is now attempting to recover. The Current Battleground: 4000 Key Zone Price is currently retesting the crucial 4000 Key Zone (highlighted in blue). This level acted as support previously, was broken, and is now being challenged again. The immediate task for buyers is to "Observe the price action if it can break the recent swing high" (marked with the purple circle) just below 4000, which has been acting as immediate resistance. Scenario 1: Bullish Reclaim & Push Higher (If 4000 Holds Strong) If Gold can successfully reclaim and hold above this 4000 Key Zone, it would be a strong bullish signal. This could open the door for: A push towards the 4150 to 4250 1st Resistance zone, where sellers might step in again. A more sustained recovery attempt, potentially aiming higher if that resistance is overcome. Scenario 2: Rejection & Further Downside (If 4000 Proves Too Strong) However, if the 4000 Key Zone acts as strong resistance and Gold fails to break above that recent swing high, we could see: A reversal back towards the 3900 Immediate Support level. Should 3900 fail to hold, the next significant support would be the 3800 to 3850 Next Support area. In Summary: The 4000 Key Zone is the pivotal point right now. Watch how price reacts here and whether it can overcome that immediate swing high resistance. This will largely dictate Gold's direction in the short term. Disclaimer: The information provided in this chart is for educational and informational purposes only and should not be considered as investment advice. Trading and investing involve substantial risk and are not suitable for every investor. You should carefully consider your financial situation and consult with a financial advisor before making any investment decisions. The creator of this chart does not guarantee any specific outcome or profit and is not responsible for any losses incurred as a result of using this information. Past performance is not indicative of future results. Use this information at your own risk. This chart has been created for my own improvement in Trading and Investment Analysis. Please do your own analysis before any investments.