
ManiMarkets
@t_ManiMarkets

What symbols does the trader recommend buying?
Purchase History
Trader Messages
Filter
Message Type
ManiMarkets
SOLANA (SOL/USD) 4H: Massive Double Top Breakdown Confirmed!
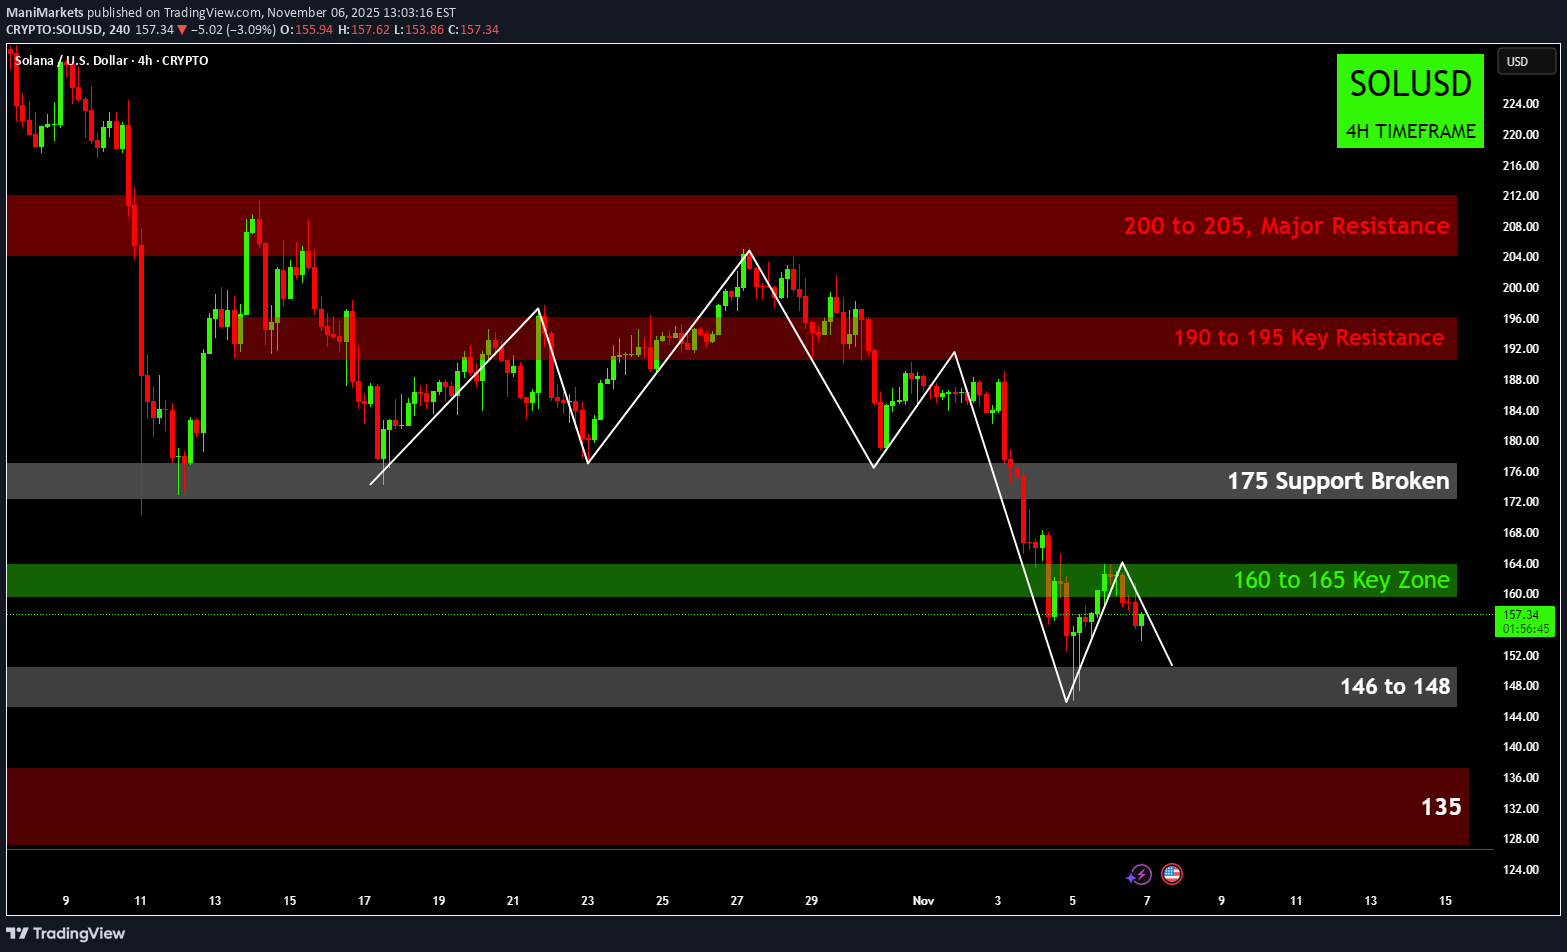
🔥 SOLANA (SOL/USD) 4H: Massive Double Top Breakdown Confirmed! 🔥 The Hunt for Support Below $175 is On The SOL/USD 4-Hour chart has confirmed a major bearish shift, driven by the breakdown of a large Double Top pattern (or a complex M-top structure) that formed between $175 and $205. This pattern reversal, often a powerful signal, has initiated a sharp correction, erasing significant gains. The critical $175 support (the neckline of the double top) has been definitively broken, confirming the bearish trend and paving the way for further downside measured moves. Key Levels Defining the Current Range The price is currently in a highly volatile phase, testing resistance levels as it attempts to find a stable base. 🛡️ Immediate Resistance (Key Zone): $160 to $165 (Green Zone) This is the area where the price is currently struggling. It was briefly reclaimed but failed to hold, turning it into the most immediate and critical resistance. Bears are defending this zone aggressively. 📉 Immediate Support (The Floor): $146 to $148 This is the recent swing low and the first crucial support level. The price bounced strongly from this area, which suggests buying interest is present, but it must hold on subsequent retests. 🛑 Major Overarching Resistance: $190 to $195 Reclaiming this zone is necessary to put an end to the mid-term bearish outlook. Until then, any movement below it is considered corrective. 🚨 Ultimate Bear Target: $135 (Major Demand Zone) If the immediate support of $146–$148 breaks, the next major target derived from the pattern breakdown is the deep demand zone around $135. What's Next for Solana? Two Critical Scenarios Bearish Continuation (The Dominant Trend): The price is rejected at the $160–$165 resistance zone. Bears drive the price back down to test the $146–$148 low. A decisive break and close below $146 confirms the continuation of the pattern breakdown, with $135 becoming the primary target. Bullish Relief (The Reversal Attempt): Bulls manage to successfully push the price above $165 and hold it. This would signal that the local correction is over and could lead to a relief rally to test the original breakdown zone at $175 (now acting as formidable resistance). A move to $175 would be a good sign, but the primary trend remains down until $195 is reclaimed. Conclusion: The path of least resistance remains downward following the breakdown from the $175 neckline. Traders should watch the $160–$165 zone for potential short entries and $146–$148 as the critical support line. Disclaimer: The information provided in this chart is for educational and informational purposes only and should not be considered as investment advice. Trading and investing involve substantial risk and are not suitable for every investor. You should carefully consider your financial situation and consult with a financial advisor before making any investment decisions. The creator of this chart does not guarantee any specific outcome or profit and is not responsible for any losses incurred as a result of using this information. Past performance is not indicative of future results. Use this information at your own risk. This chart has been created for my own improvement in Trading and Investment Analysis. Please do your own analysis before any investments.
ManiMarkets
XRP/USD (4H) Analysis: The $2.10 Launchpad
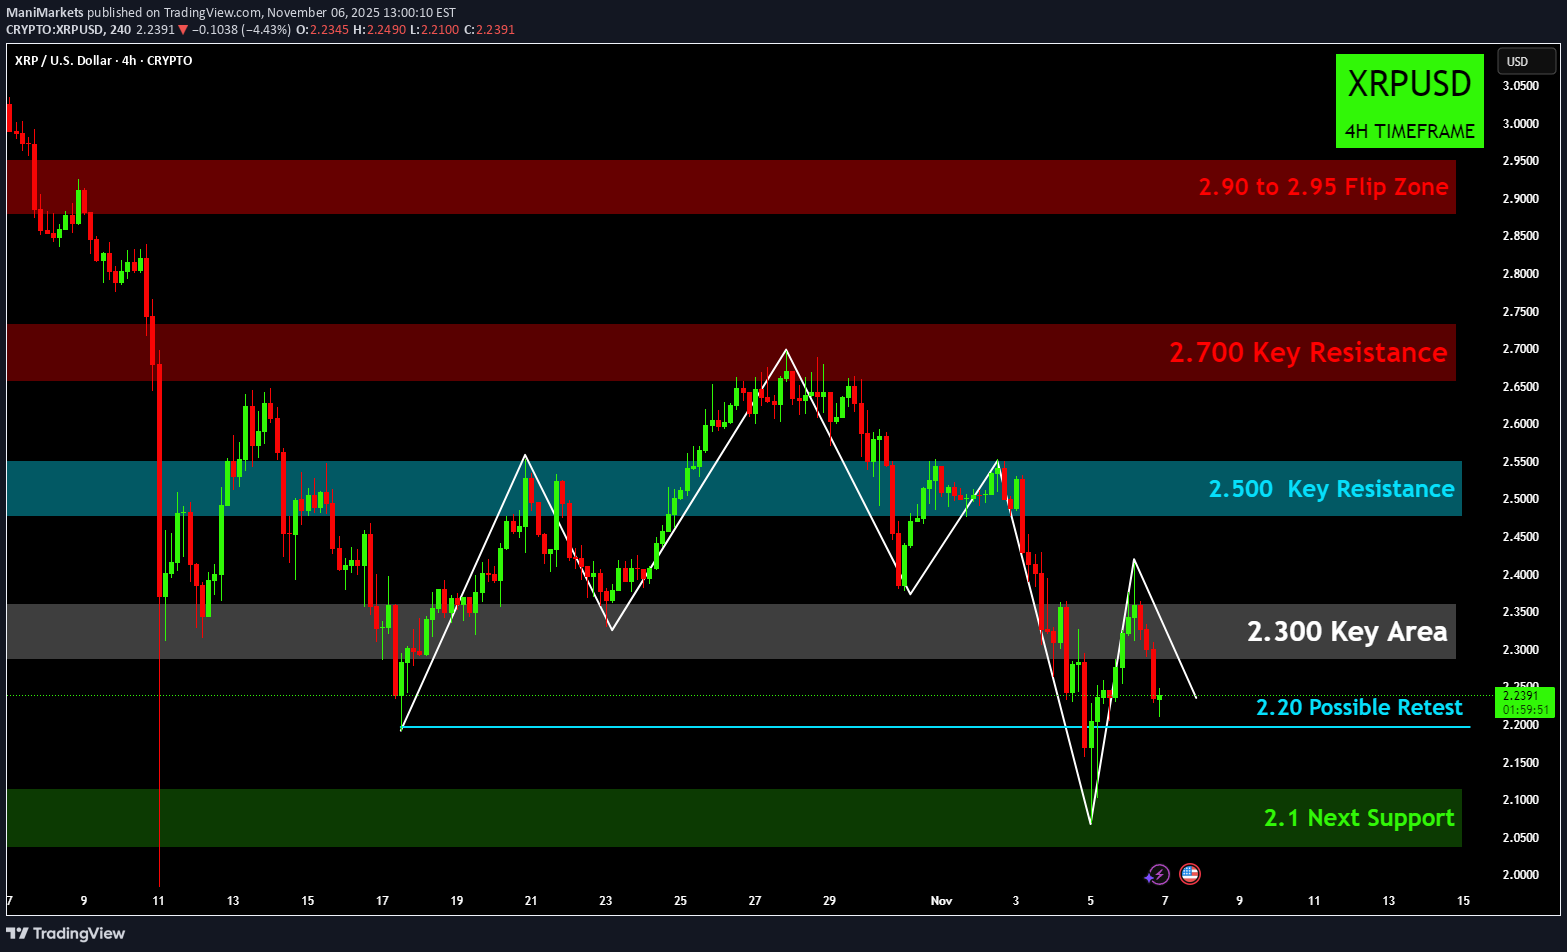
🚀 XRP/USD (4H) Analysis: The $2.10 Launchpad 🌊 Current Market Context The XRP/USD 4-hour chart provides a clear picture of a major bearish reversal from its recent highs. Price action suggests a classic Head and Shoulders (H&S) pattern has likely completed, marked by a decisive break below its neckline (the lows between the peaks), leading to a sharp drop. The crucial development is the recent price bounce off the $2.10 (Green Zone) support area. This zone has acted as a strong demand area, suggesting that the initial, aggressive correction phase triggered by the H&S pattern may be concluding. Bulls are now attempting to build a local base. Key Levels to Watch ⚡️ Immediate Resistance (The First Hurdle): $2.20 This is the immediate hurdle. A clean break and hold above $2.20 are necessary to confirm short-term bullish momentum and set the stage for a push to the next major resistance. 🎯 Key Resistance Area (Flip Zone): $2.30 (Grey Zone) This is the most critical resistance in the short term. The $2.30 area was previously a strong support and will now be tested as a major psychological and technical resistance. Breaking and turning this zone into support would significantly shift the short-term market structure from bearish to neutral/bullish. 🛡️ Major Support (Must Hold): $2.10 (Green Zone) This is the line in the sand for the bulls. A sustained break and candle closure below $2.10 on the 4H chart would confirm continued downside, with the H&S target being the next point of interest, leading to a much deeper correction. Potential Scenarios Bullish Scenario (Bounce and Break): XRP successfully holds the $2.10 support. The price breaks through $2.20 and then reclaims the $2.30 (Grey Zone). A confirmed flip of $2.30 opens the door for a rally toward the higher resistance zones at $2.50 (Blue Zone) and ultimately $2.70 (Red Zone). Bearish Scenario (Rejection and Retest): XRP fails to hold the recent bounce and is rejected at $2.20 or $2.30. Price falls back to retest the $2.10 (Green Zone) support. A sustained break below $2.10 would invalidate the current base-building effort, suggesting the H&S downside target is still in play, leading to further significant losses.
ManiMarkets
Ethereum Drowning: 3500 Round Figure in Jeopardy, 3000 Awaits?
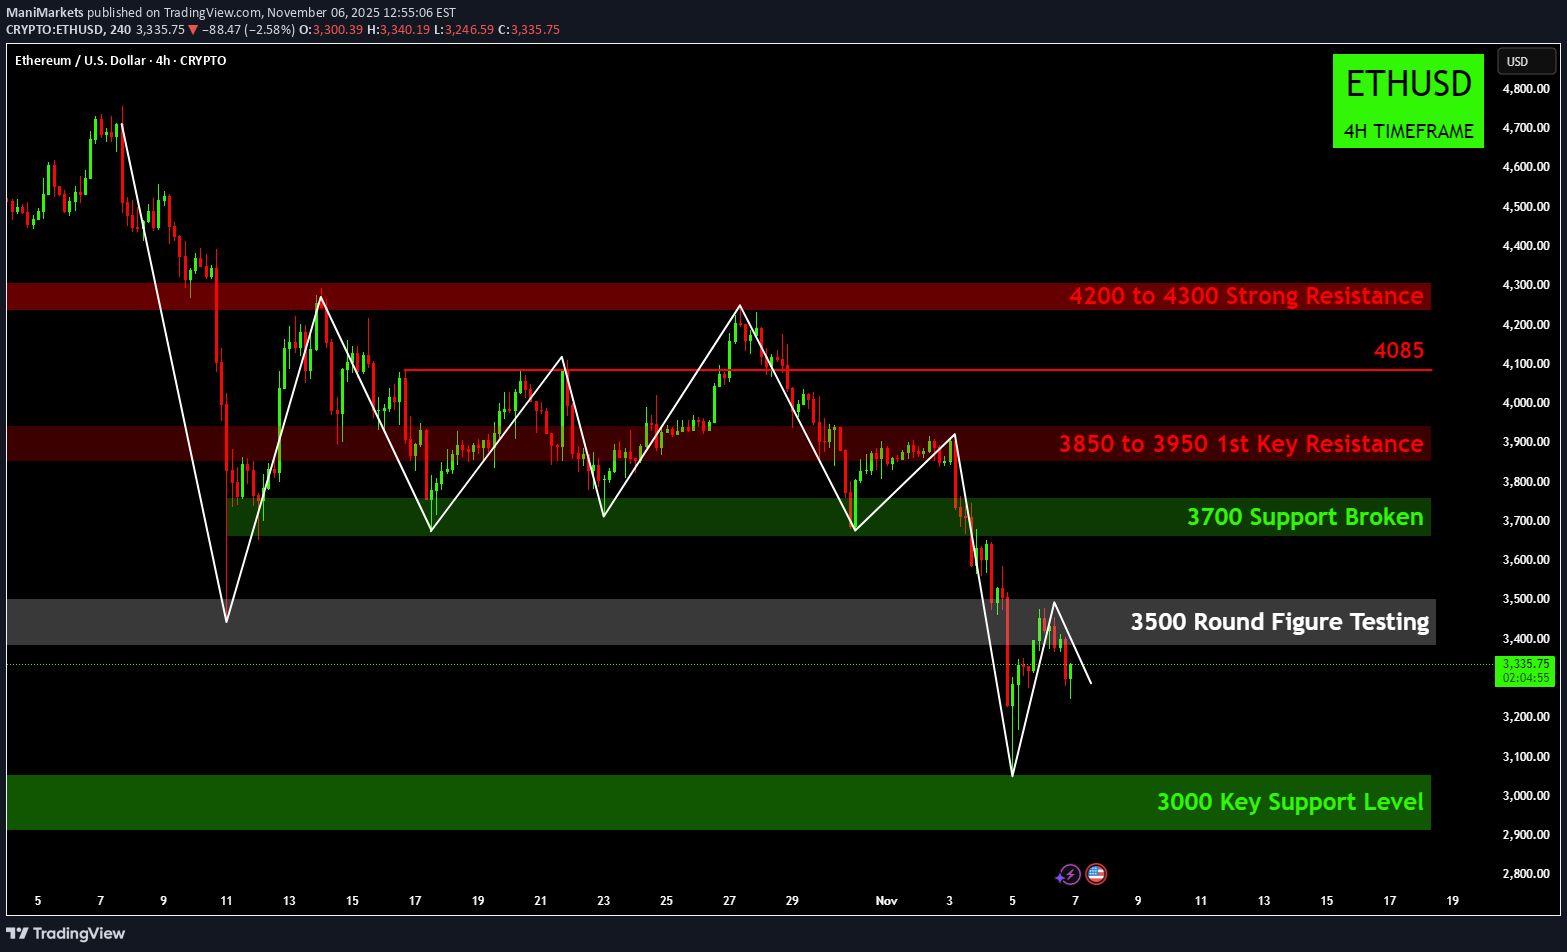
🌊 Ethereum Drowning: 3500 Round Figure in Jeopardy, 3000 Awaits? 📉 ETH/USD (4H Timeframe) Analysis Ethereum is facing intense selling pressure, mirroring the broader crypto market downturn. After failing to reclaim critical resistance levels, ETH has broken through several major supports and is now testing the key psychological level of 3500. 1. The Bearish Structure and Resistance Zones The chart clearly illustrates a significant failure of the bulls to sustain momentum, leading to a strong downtrend. 🛑 4200 to 4300 Strong Resistance: This upper red zone was the ceiling for the entire period shown. The repeated inability to break above this area confirmed strong overhead supply. 🔴 3850 to 3950 1st Key Resistance: This zone served as a frequent turning point during the consolidation phase. Having been lost, it now represents the most immediate and critical resistance for ETH. Reclaiming this zone is essential for any sign of a bullish reversal. ⚠️ 4085 Intermediate Resistance: An important minor level that also contributed to the overall bearish structure. 2. Current Price Action and Support Levels The recent price action is defined by a sharp breakdown below the established consolidation range. 💥 3700 Support Broken: The green box at 3700, which served as support throughout the extended consolidation period, has been decisively lost. This signals a structural break to the downside. ⚪ 3500 Round Figure Testing: The price is currently battling around the 3500 major round figure. The black box highlights this ongoing test. A confirmed break and hold below 3500 would open the floodgates for further selling. 🛡️ 3000 Key Support Level: The market is now looking toward the ultimate demand zone at the 3000 Key Support Level (deep green box). This is the next major psychological and technical support, likely to be the target if 3500 fails to hold. 3. Trade Plan Scenarios Bears (Short): Entry Trigger: A confirmed breakdown and candle close below the 3500 Round Figure Testing zone. Target: The next major demand zone at the 3000 Key Support Level. Bulls (Long): Entry Trigger: A successful defense of the 3500 level, followed by a strong close and push above the 3700 broken support. Target: A retest of the 3850 to 3950 Key Resistance zone. In summary, Ethereum is on precarious footing, having lost its key support structure. The battle at 3500 is critical; if it fails, a move toward 3000 is highly probable. Disclaimer: The information provided in this chart is for educational and informational purposes only and should not be considered as investment advice. Trading and investing involve substantial risk and are not suitable for every investor. You should carefully consider your financial situation and consult with a financial advisor before making any investment decisions. The creator of this chart does not guarantee any specific outcome or profit and is not responsible for any losses incurred as a result of using this information. Past performance is not indicative of future results. Use this information at your own risk. This chart has been created for my own improvement in Trading and Investment Analysis. Please do your own analysis before any investments.
ManiMarkets
Bitcoin Bleeding: Major Supports Shattered, 100K in Sight!
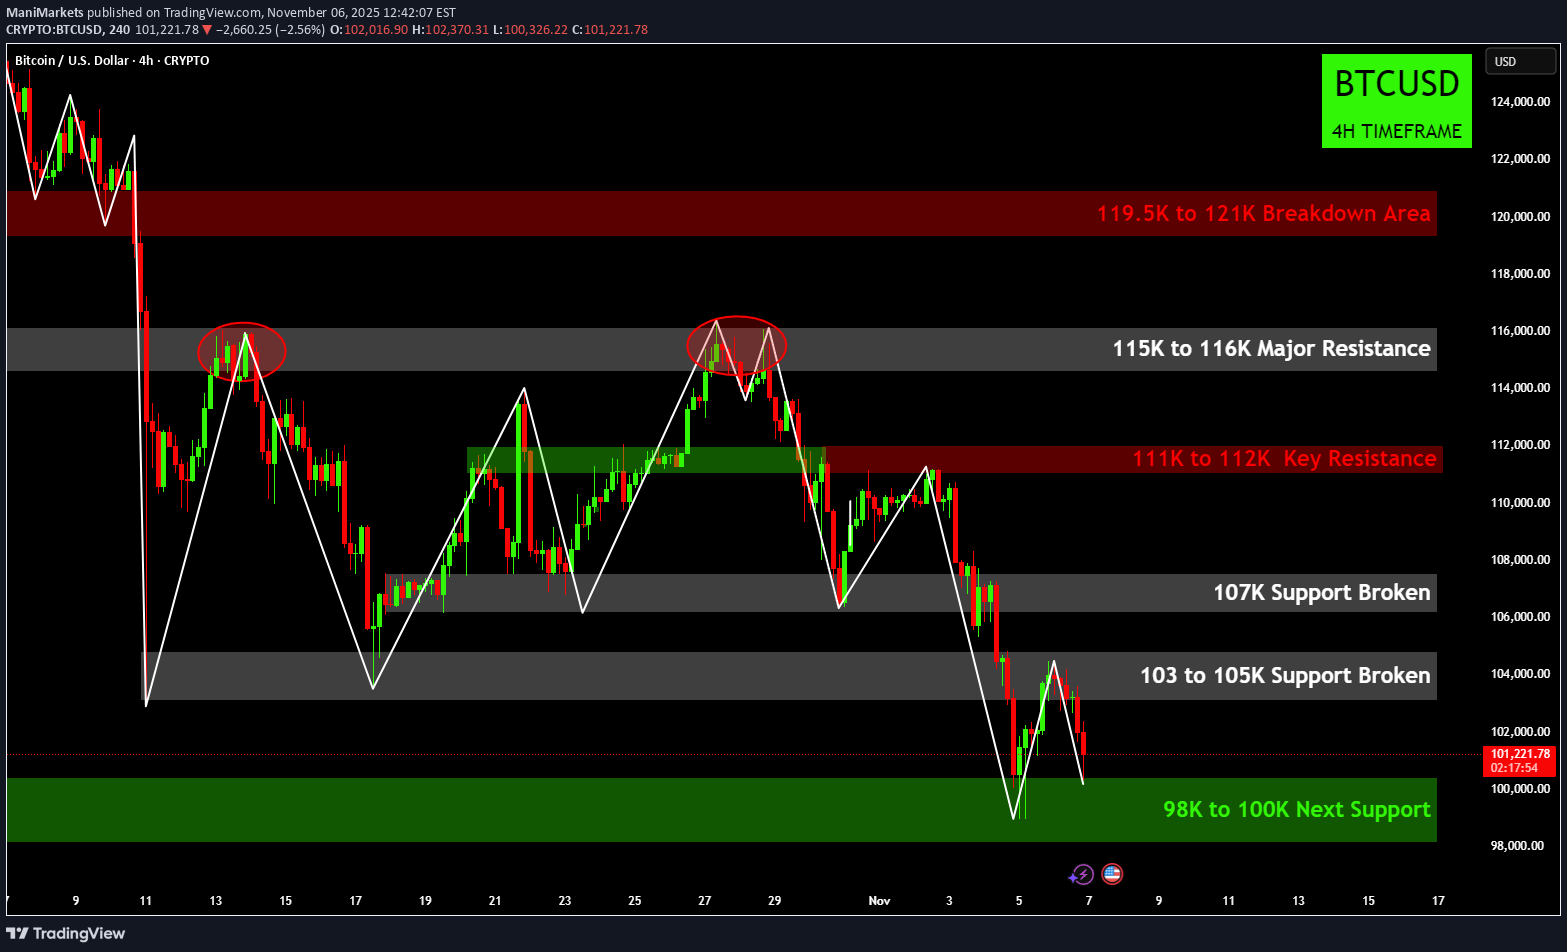
🚨 Bitcoin Bleeding: Major Supports Shattered, 100K in Sight! 📉 BTC/USD (4H Timeframe) Analysis Bitcoin is currently under heavy selling pressure, having broken through several key support levels following a significant rejection from overhead resistance. The price action suggests a continuation of the downtrend, with bulls struggling to establish a base. 1. The Bearish Structure and Key Resistances The chart clearly shows that the bears are in control after a failure to sustain a rally and a confirmed reversal pattern. 🛑 115K to 116K Major Resistance: This area proved to be the major turning point. The price formed a classic Double Top (or a variation of it) at this zone (circled), confirming strong supply and initiating the sharp sell-off. 🔴 111K to 112K Key Resistance: This green-turned-red zone was the last significant high the market made before breaking down. It now represents a critical hurdle. Any bounce is likely to meet heavy selling here. ⚠️ 119.5K to 121K Breakdown Area: This upper red zone shows the initial area where the massive drop originated. It would take an exceptional rally to reach and reclaim this level. 2. The Current Breakdown and Support Levels The most notable recent activity is the decisive break of previous consolidation levels, indicating strong bearish momentum. 💥 107K Support Broken: This was a significant intermediate support that has now been lost, contributing to the downward slide. 💥 103K to 105K Support Broken: The failure to hold this crucial demand zone confirms the strength of the current downtrend. This area will now likely act as immediate resistance on any bounce. 🛡️ 98K to 100K Next Support: The market is now rapidly approaching the major psychological and technical zone of 100,000. The green box highlights the next significant demand area from 98K to 100K. 3. Trade Plan Scenarios Bears (Short): Entry Trigger: A rejection and confirmation of resistance at the recently broken 103K to 105K zone. Target: A test of the 98K to 100K Next Support level. Bulls (Long): Entry Trigger: A confirmed reversal pattern (like a double bottom or strong engulfing candle) within the 98K to 100K support zone. Target: A retest of the 103K to 105K broken support, which is now expected to act as resistance. In summary, Bitcoin is in a decisive downtrend, targeting the psychologically important 100K level. Bears are clearly in control until a major support level provides a strong, convincing bounce. Disclaimer: The information provided in this chart is for educational and informational purposes only and should not be considered as investment advice. Trading and investing involve substantial risk and are not suitable for every investor. You should carefully consider your financial situation and consult with a financial advisor before making any investment decisions. The creator of this chart does not guarantee any specific outcome or profit and is not responsible for any losses incurred as a result of using this information. Past performance is not indicative of future results. Use this information at your own risk. This chart has been created for my own improvement in Trading and Investment Analysis. Please do your own analysis before any investments.
ManiMarkets
Gold's Critical Crossroads: Double Top Threatens Reversal!
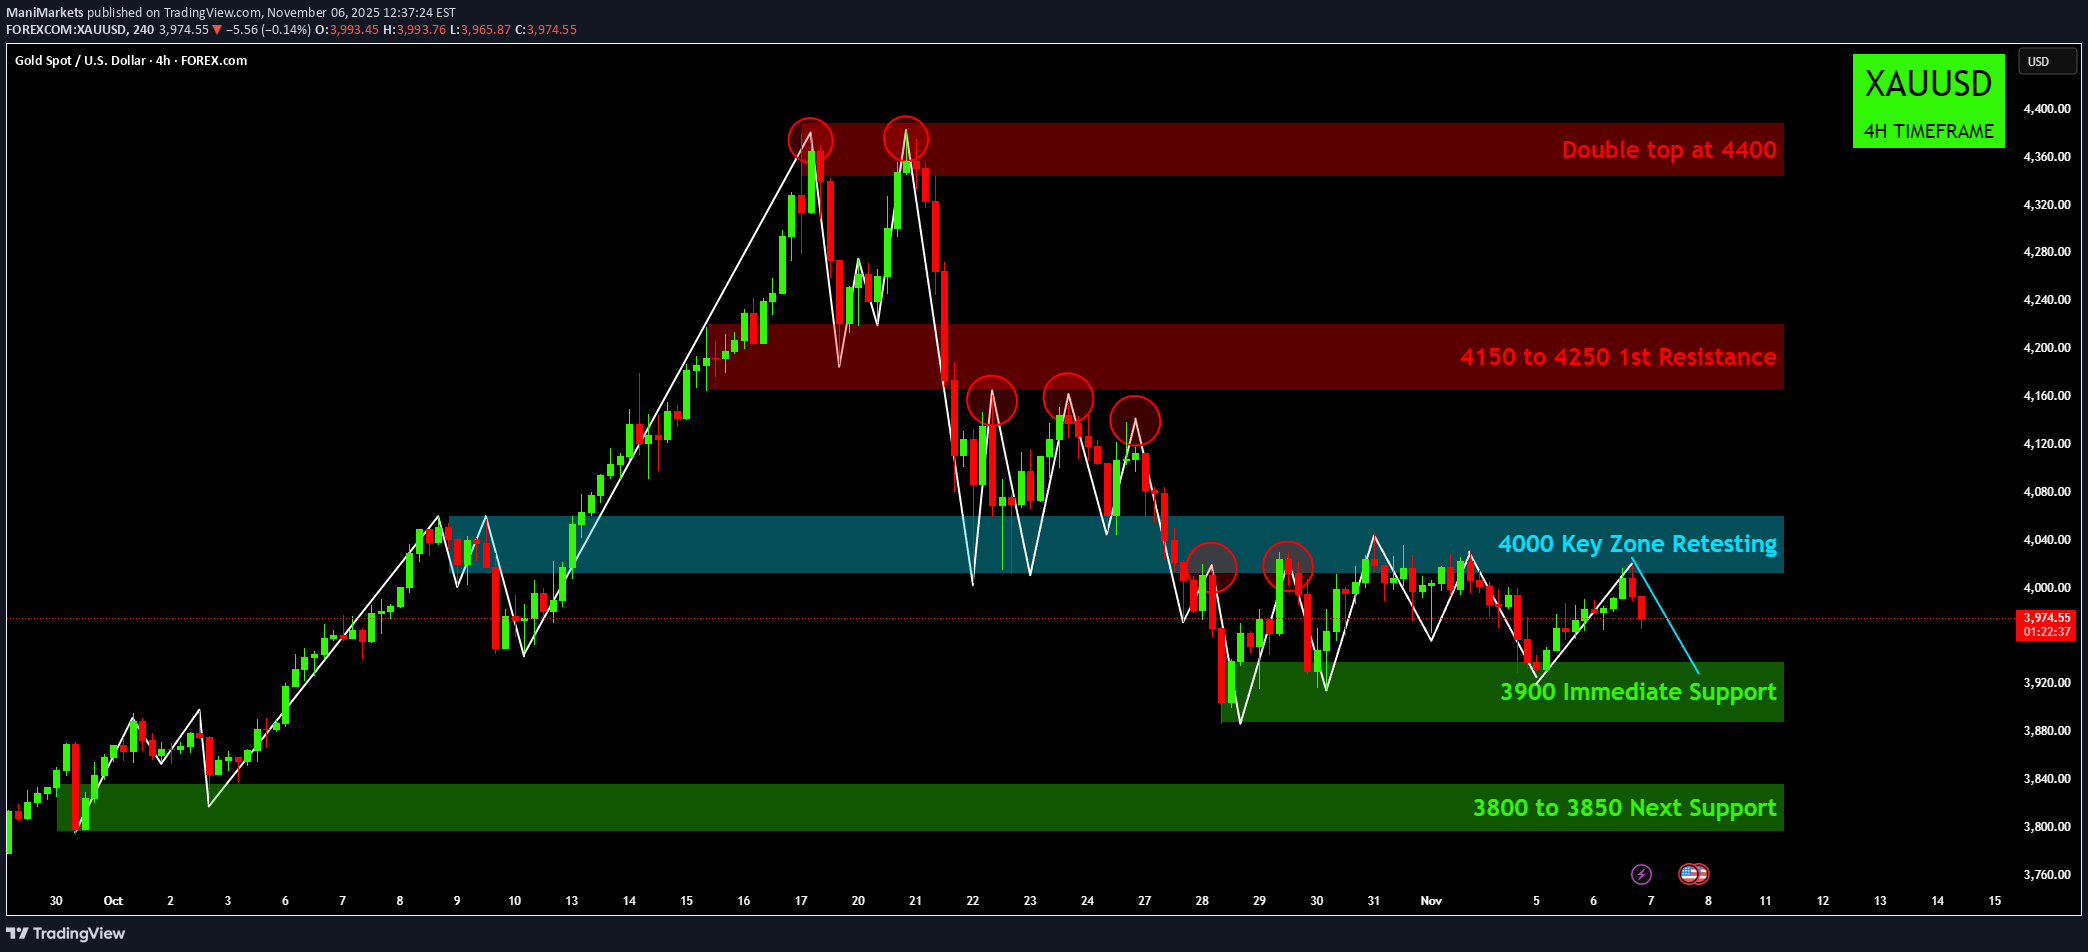
👑 Gold's Critical Crossroads: Double Top Threatens Reversal! 📉 XAU/USD (4H Timeframe) Analysis Gold has experienced a significant uptrend followed by a sharp reversal pattern, leaving traders to navigate a crucial period of consolidation and retesting. The chart highlights key supply and demand zones that will dictate the metal's next major move. 1. The Bearish Setup: Double Top and Key Zone Loss The chart clearly shows that the bullish momentum stalled after hitting a high around 4400. ⚠️ The Double Top at 4400: This major bearish reversal pattern formed, indicating strong selling pressure at the top. The price couldn't sustain the breakout, leading to a swift decline. 📉 Breakdown of the 4000 Key Zone: After the double top, Gold lost the critical 4000 Key Zone, which previously acted as strong support (teal box). The price is now retesting this zone from below, confirming its transition into a resistance area. 🛑 4150 to 4250 (1st Resistance): This large red zone represents the first major overhead supply area. For bulls to regain confidence, they would need to conquer this zone, but it looks heavily defended for now. 2. Current Price Action and Support Levels The price is currently consolidating below the 4000 resistance, forming a classic "descending triangle" or consolidation pattern. 🛡️ 3900 Immediate Support: The price is being held up by the 3900 immediate support level (green box). Holding this level is essential to prevent a further slide. A break below 3900 would likely signal more downside. 🎯 3800 to 3850 Next Support: This deeper green zone is the last line of defense for the current structure. This area aligns with the base of the previous major rally, making it a critical demand zone. 3. Trade Plan Scenarios Bulls (Long): Entry Trigger: A sustained breakout and candle close above the 4000 Key Zone. Target: A retest of the 4150 to 4250 resistance area. Bears (Short): Entry Trigger: A confirmed breakdown and candle close below the 3900 Immediate Support. Target: The next major demand zone at 3800 to 3850. In summary, Gold is at a pivotal point. Traders should monitor the battle at the 3900 support and 4000 resistance for the next directional cue! What do you think will happen next: will Gold hold 3900 or finally break above 4000? Disclaimer: The information provided in this chart is for educational and informational purposes only and should not be considered as investment advice. Trading and investing involve substantial risk and are not suitable for every investor. You should carefully consider your financial situation and consult with a financial advisor before making any investment decisions. The creator of this chart does not guarantee any specific outcome or profit and is not responsible for any losses incurred as a result of using this information. Past performance is not indicative of future results. Use this information at your own risk. This chart has been created for my own improvement in Trading and Investment Analysis. Please do your own analysis before any investments.
ManiMarkets
BTC Monthly: Awaiting Bullish Confirmation from Golden Zone
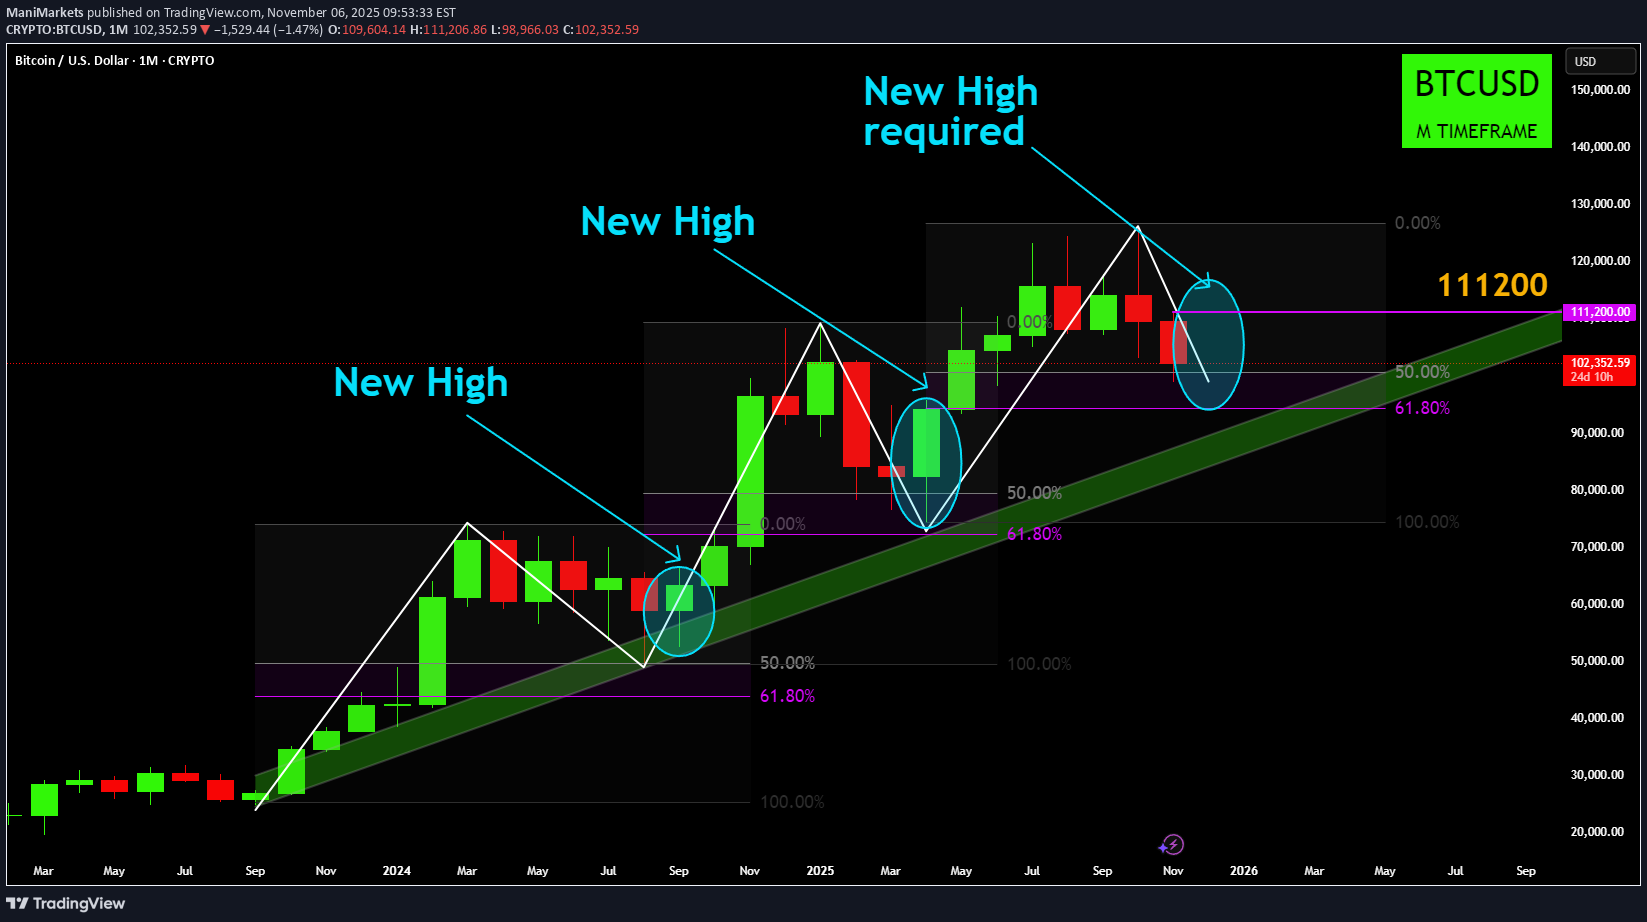
BTC Monthly: Awaiting Bullish Confirmation from Fibonacci Golden Zone Hello, traders. This is a high-level, monthly-timeframe analysis of Bitcoin's macro trend. This idea is based on a clear, repeating pattern that has defined the bull market since September 2023. By understanding this larger structure, we can better frame the current volatility and identify what to look for as confirmation of the next major leg up. 🔍 The Core Analysis On the monthly chart, BTC's bullish trend has followed a consistent blueprint: A strong impulse move up. A corrective pullback into the Fibonacci "Golden Zone" (the area between the 50% and 61.8% retracement levels). A period of consolidation in this zone, where support is found. A breakout from this zone, leading to a New High and continuation of the trend. As you can see from the chart, this "pullback-and-breakout" pattern has happened twice already during this uptrend. 📍 Where We Are Now Currently, we are at a critical juncture. After posting a significant new high (around $128,000), the price has once again entered a corrective phase. Price is currently testing the 50% Fibonacci level at approximately $102,404. This places us squarely back inside the "Golden Zone," the same area that has acted as a support and springboard for price in the past. 🐂 The Bullish Thesis (Confirmation) For the long-term bullish trend to be confirmed, the pattern must repeat: Support must hold within this 50% - 61.8% Fib zone. The price must eventually break out of this corrective structure and create a New High above the previous peak. This new high is the required confirmation that the pullback is complete and the macro uptrend is continuing. 🐻 The Corrective/Volatile Phase (The "Wait") Until that new high is formed, we must respect the current market phase. Price is technically in a "pullback mode." This means we should expect continued volatility. Price can easily fluctuate for weeks, or even months, within this corrective zone before a clear direction is established. A break below the 61.8% Fib level on a monthly closing basis would be a significant warning sign and would challenge the validity of this entire bullish structure. ⚠️ Important: A Macro View This is a Monthly Chart. Each candle represents 30 days of price action. This analysis is ideal for a long-term perspective (investors, position traders) to understand the bigger picture. It is NOT suitable for short-term trading. The moves within this "golden zone" can still be tens of thousands of dollars. This same concept (impulse, Fib pullback, new high) can be applied to shorter time frames (like the Daily or 4-Hour) to find short-term trade setups, but this specific chart is strictly a macro view. Disclaimer: The information provided in this chart is for educational and informational purposes only and should not be considered as investment advice. Trading and investing involve substantial risk and are not suitable for every investor. You should carefully consider your financial situation and consult with a financial advisor before making any investment decisions. The creator of this chart does not guarantee any specific outcome or profit and is not responsible for any losses incurred as a result of using this information. Past performance is not indicative of future results. Use this information at your own risk. This chart has been created for my own improvement in Trading and Investment Analysis. Please do your own analysis before any investments.
ManiMarkets
XAUUSD: Gold Battles the Key 4000 Zone
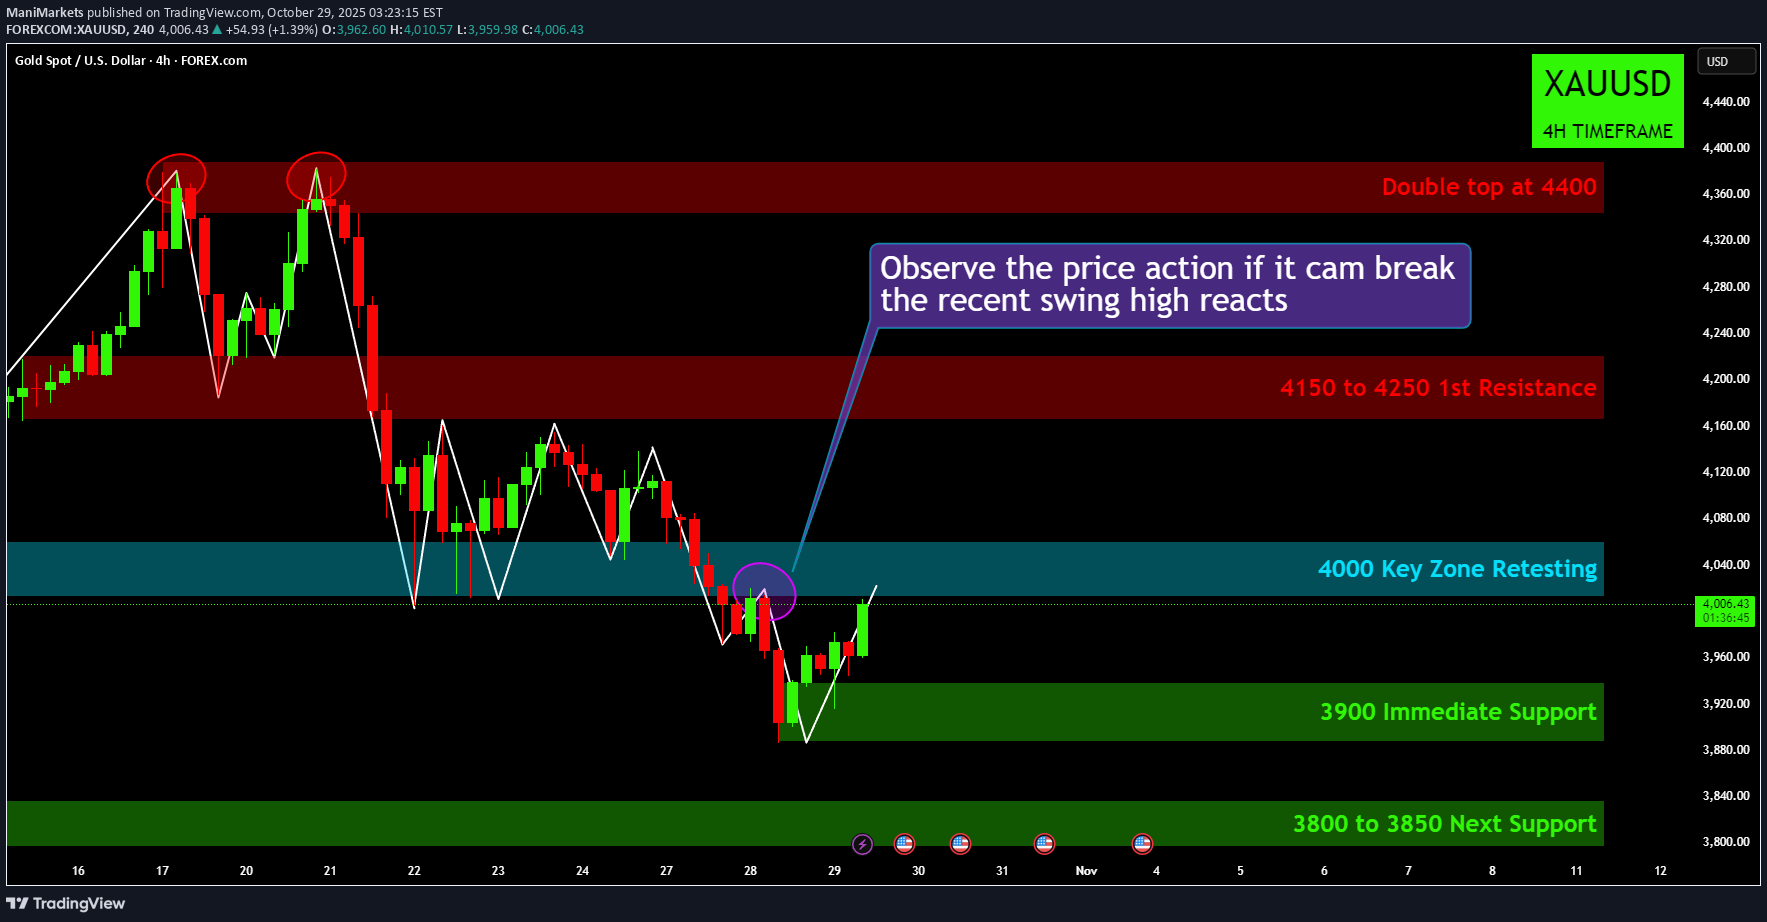
XAUUSD: Gold Battles the Key 4000 Zone Hey everyone! Let's dive into Gold (XAUUSD) on the 4-hour chart, where we've seen some dramatic moves recently. What We've Seen: Gold made a strong run earlier in the month, but was firmly rejected twice at the 4400 mark, forming a clear "Double Top" pattern (marked with red circles). This led to a significant pullback, pushing price down through several support levels. Currently, Gold has found some footing after hitting a low and is now attempting to recover. The Current Battleground: 4000 Key Zone Price is currently retesting the crucial 4000 Key Zone (highlighted in blue). This level acted as support previously, was broken, and is now being challenged again. The immediate task for buyers is to "Observe the price action if it can break the recent swing high" (marked with the purple circle) just below 4000, which has been acting as immediate resistance. Scenario 1: Bullish Reclaim & Push Higher (If 4000 Holds Strong) If Gold can successfully reclaim and hold above this 4000 Key Zone, it would be a strong bullish signal. This could open the door for: A push towards the 4150 to 4250 1st Resistance zone, where sellers might step in again. A more sustained recovery attempt, potentially aiming higher if that resistance is overcome. Scenario 2: Rejection & Further Downside (If 4000 Proves Too Strong) However, if the 4000 Key Zone acts as strong resistance and Gold fails to break above that recent swing high, we could see: A reversal back towards the 3900 Immediate Support level. Should 3900 fail to hold, the next significant support would be the 3800 to 3850 Next Support area. In Summary: The 4000 Key Zone is the pivotal point right now. Watch how price reacts here and whether it can overcome that immediate swing high resistance. This will largely dictate Gold's direction in the short term. Disclaimer: The information provided in this chart is for educational and informational purposes only and should not be considered as investment advice. Trading and investing involve substantial risk and are not suitable for every investor. You should carefully consider your financial situation and consult with a financial advisor before making any investment decisions. The creator of this chart does not guarantee any specific outcome or profit and is not responsible for any losses incurred as a result of using this information. Past performance is not indicative of future results. Use this information at your own risk. This chart has been created for my own improvement in Trading and Investment Analysis. Please do your own analysis before any investments.
ManiMarkets
SOLUSD: Key 175 Support in Focus After 198.5 Rejection
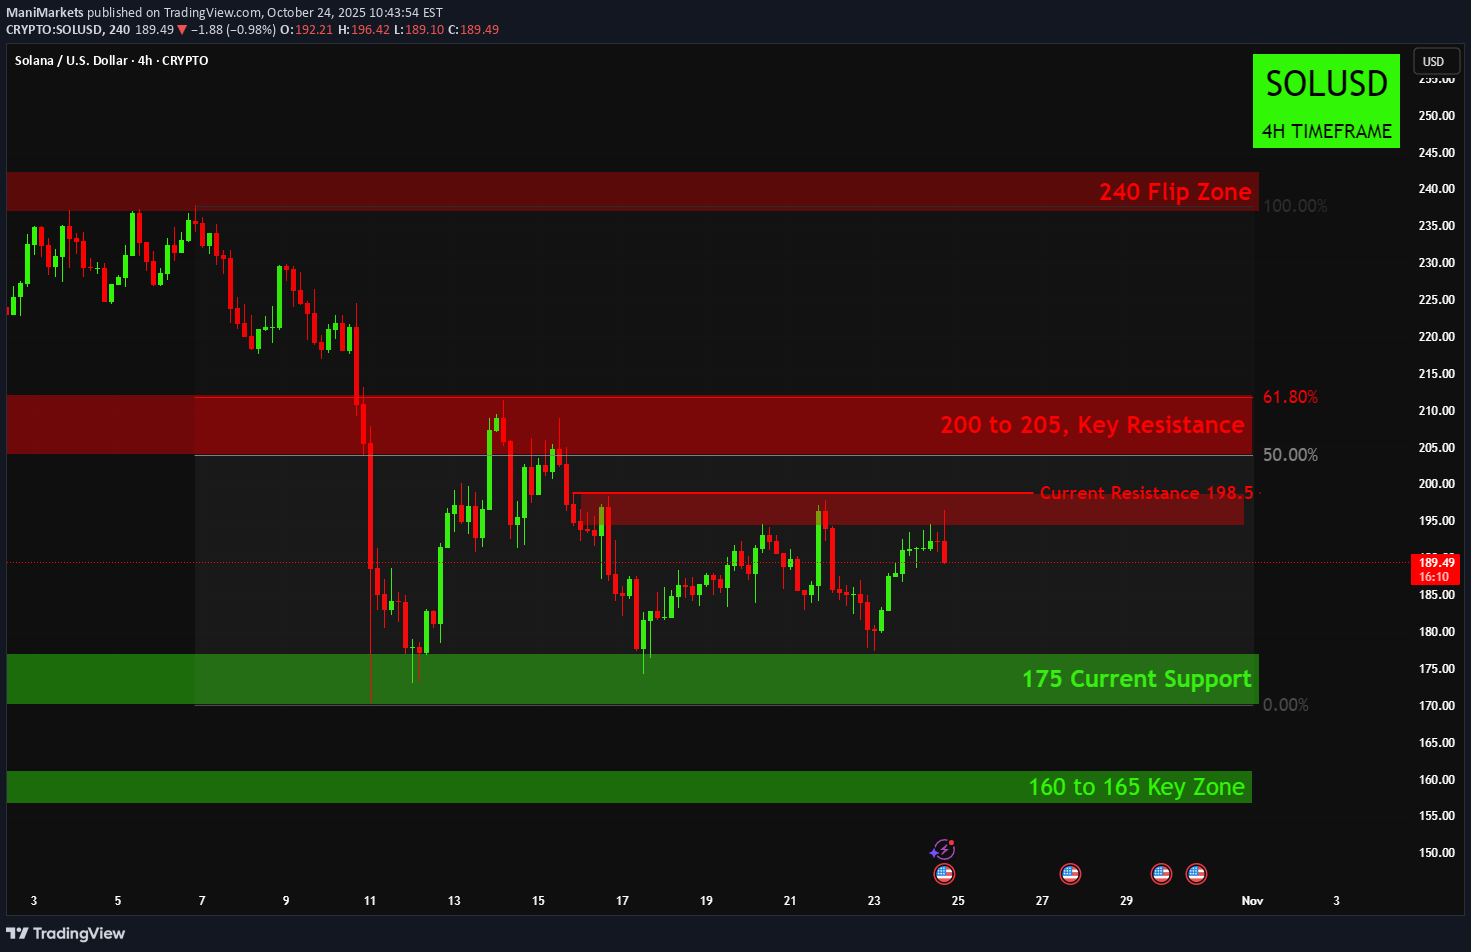
SOLUSD is currently consolidating in a range, facing a pullback after being rejected by the 198.5 current resistance level. For the bulls to regain control, the price needs to break and hold above the 198.5 resistance, which would set the stage for a move towards the 200 to 205 key resistance zone. The current bearish pressure suggests that a retest of the 175 current support level is likely in the short term. A breakdown and close below the 175 support would be a significant bearish development, potentially sending the price down to the 160 to 165 key support zone. Disclaimer: The information provided in this chart is for educational and informational purposes only and should not be considered as investment advice. Trading and investing involve substantial risk and are not suitable for every investor. You should carefully consider your financial situation and consult with a financial advisor before making any investment decisions. The creator of this chart does not guarantee any specific outcome or profit and is not responsible for any losses incurred as a result of using this information. Past performance is not indicative of future results. Use this information at your own risk. This chart has been created for my own improvement in Trading and Investment Analysis. Please do your own analysis before any investments.
ManiMarkets
XRPUSD: Bulls Challenge 2.500 Resistance After Trendline Break
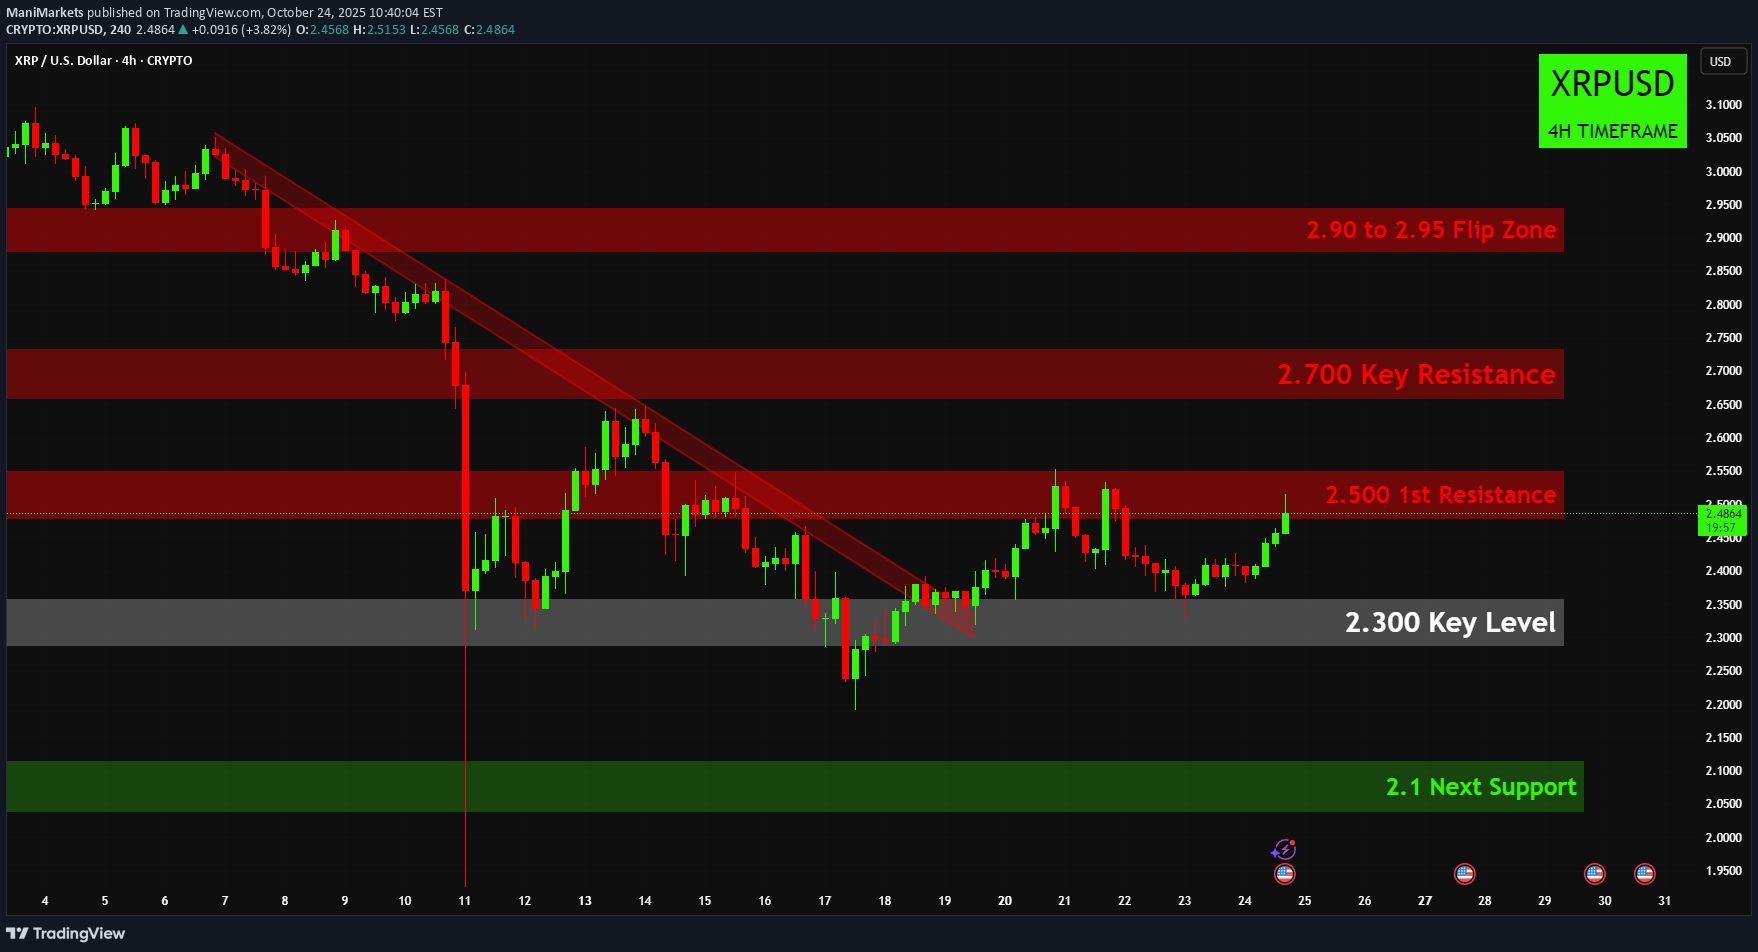
XRPUSD has successfully broken out from its descending trendline and is currently pushing towards the 2.500 first resistance, having established strong support at the 2.300 key level. A decisive close above the 2.500 resistance would signal continued bullish strength, opening the door for a potential move towards the 2.700 key resistance and then the 2.90 to 2.95 flip zone. If the price fails to overcome the 2.500 resistance, it could pull back to retest the 2.300 key level, which now acts as a critical support. A breakdown below the 2.300 support would negate the recent bullish momentum and could lead to a deeper correction, with the 2.1 next support level being the primary downside target. Disclaimer: The information provided in this chart is for educational and informational purposes only and should not be considered as investment advice. Trading and investing involve substantial risk and are not suitable for every investor. You should carefully consider your financial situation and consult with a financial advisor before making any investment decisions. The creator of this chart does not guarantee any specific outcome or profit and is not responsible for any losses incurred as a result of using this information. Past performance is not indicative of future results. Use this information at your own risk. This chart has been created for my own improvement in Trading and Investment Analysis. Please do your own analysis before any investments.
ManiMarkets
Ethereum's Moment of Truth, Will the 3850 Support Hold?
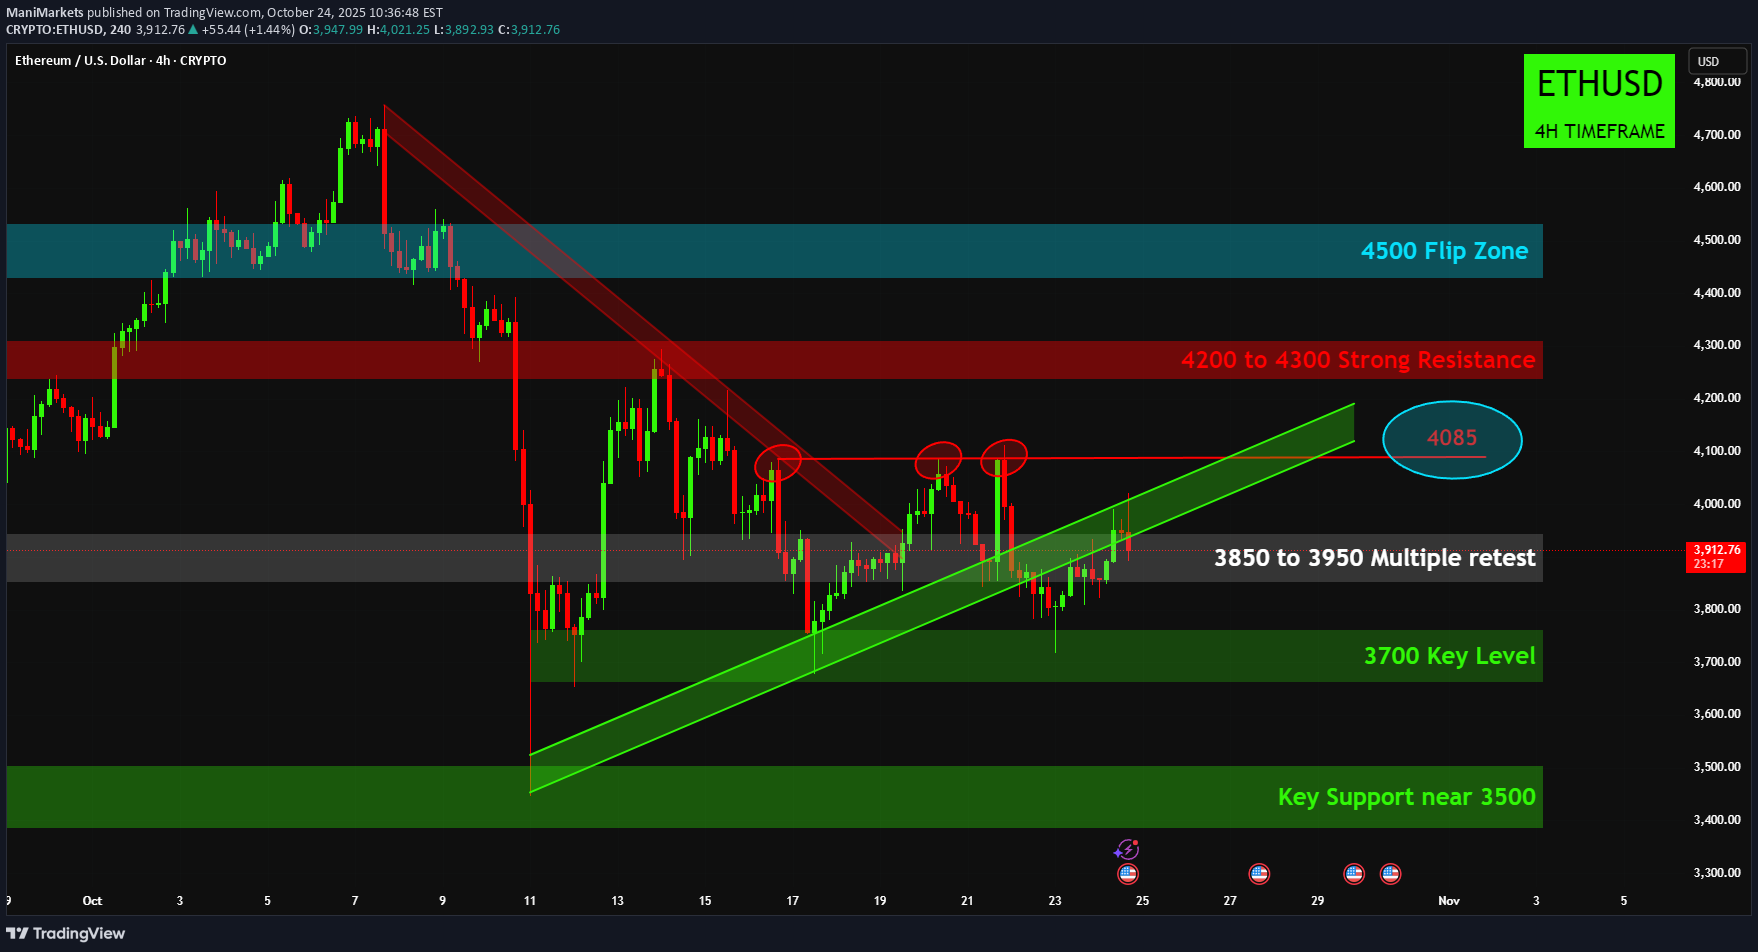
ETHUSD is currently at a critical inflection point, testing the ascending trendline support which coincides with the 3850 to 3950 multiple retest zone. A strong bounce from this support could lead to another test of the descending trendline resistance, with a breakout targeting the 4085 level and then the 4200 to 4300 strong resistance zone. Conversely, a failure to hold this ascending support and a breakdown below 3850 would signal a bearish turn in the short term. In the event of a breakdown, the price would likely seek lower support levels, with the next significant targets being the 3700 key level and then the key support near 3500. Disclaimer: The information provided in this chart is for educational and informational purposes only and should not be considered as investment advice. Trading and investing involve substantial risk and are not suitable for every investor. You should carefully consider your financial situation and consult with a financial advisor before making any investment decisions. The creator of this chart does not guarantee any specific outcome or profit and is not responsible for any losses incurred as a result of using this information. Past performance is not indicative of future results. Use this information at your own risk. This chart has been created for my own improvement in Trading and Investment Analysis. Please do your own analysis before any investments.
Disclaimer
Any content and materials included in Finbeet's website and official communication channels are a compilation of personal opinions and analyses and are not binding. They do not constitute any recommendation for buying, selling, entering or exiting the stock market and cryptocurrency market. Also, all news and analyses included in the website and channels are merely republished information from official and unofficial domestic and foreign sources, and it is obvious that users of the said content are responsible for following up and ensuring the authenticity and accuracy of the materials. Therefore, while disclaiming responsibility, it is declared that the responsibility for any decision-making, action, and potential profit and loss in the capital market and cryptocurrency market lies with the trader.