Technical analysis by readCrypto about Symbol BTC on 11/3/2025

readCrypto
Volatility Period: Up to November 10th
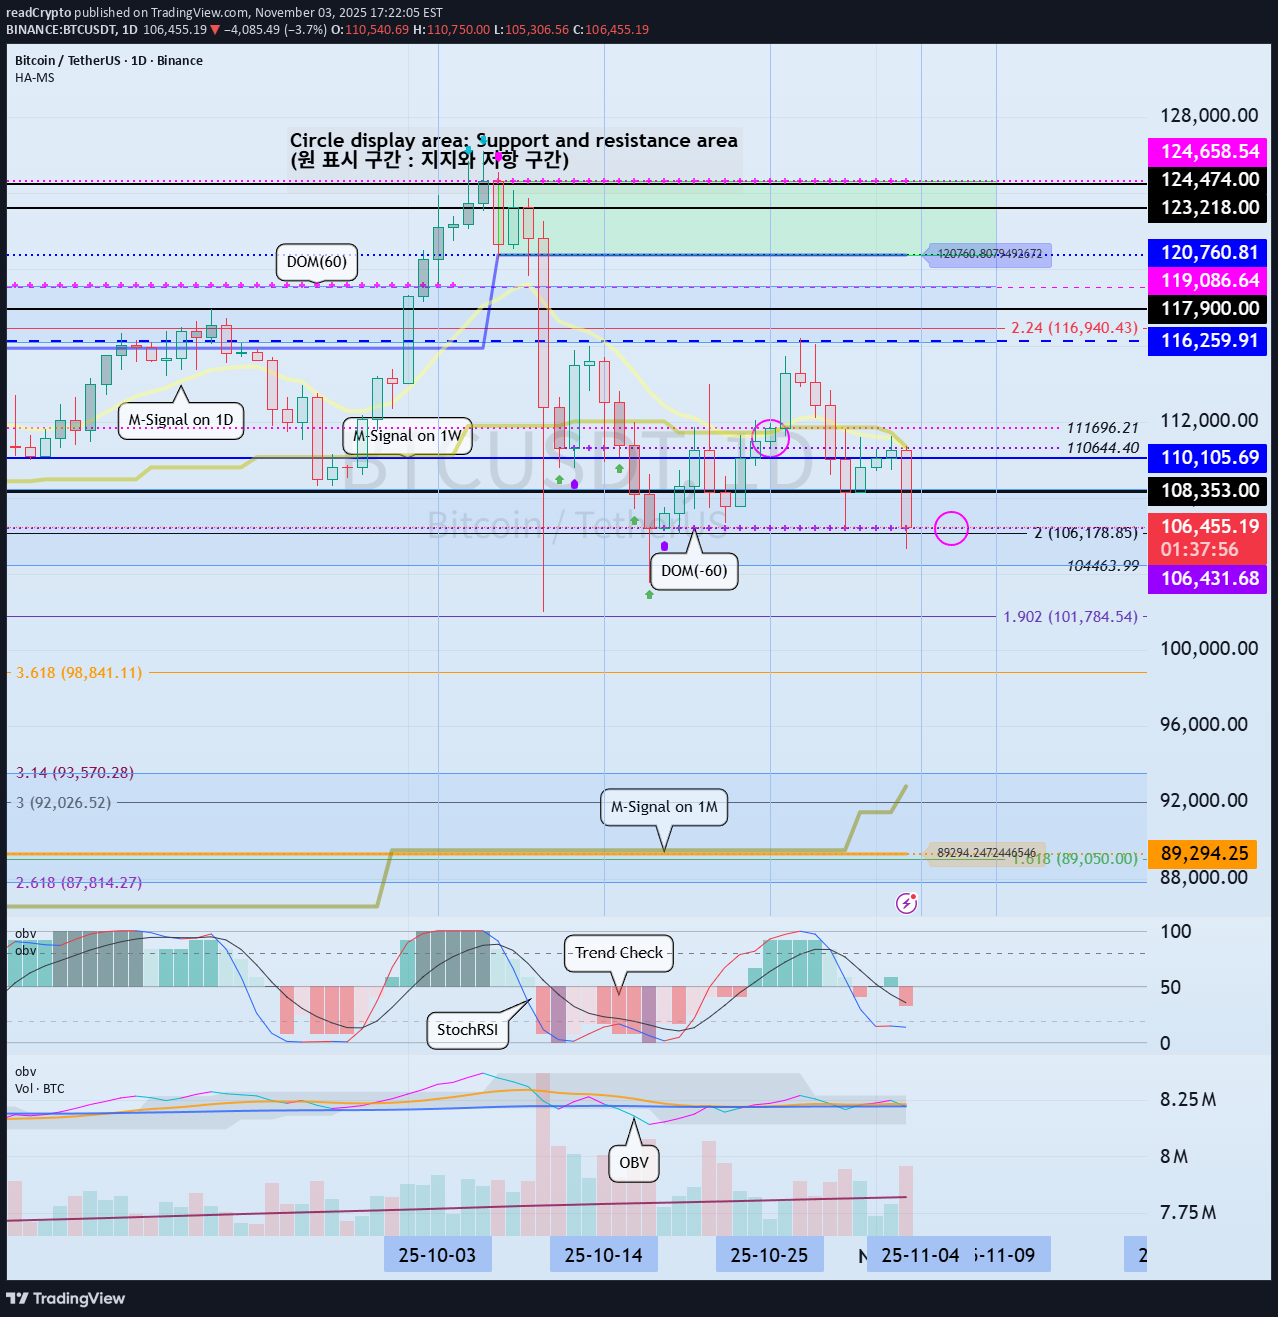
Hello, traders! Follow us to get the latest information quickly. Have a great day! ------------------------------------- (BTCUSDT 1D chart) This volatility period is expected to last from November 3rd to 9th. First, we need to check the movement between November 3rd and 5th. While the key question is whether the price can rise after finding support at the important support and resistance level of 104463.99-108353.0, it's crucial to check for support around 106431.68 within that range. This is because the 106431.68 point is the DOM(-60) level. - The DOM indicator is a comprehensive evaluation of the DMI, OBV, and MOMENTUM indicators. DOM(-60) indicates that all three indicators have reached their lows. Therefore, support is necessary to confirm the possibility of a bullish reversal. If the price rises after the DOM(-60) indicator first appears and then touches the DOM(-60) indicator again, it is highly likely that the price will fall without finding support. If the price rises after finding support at the DOM(-60) indicator, it should follow a period of sideways movement to confirm support. - Therefore, what we can do now is take the time to determine which direction the price deviates from the 106431.68-108353.0 range and where it encounters support and resistance. You need your own basic trading strategy to execute your trades. No one else can do this for you. This is because you need to tailor your trading strategy to your investment style to avoid regrets. My basic trading strategy is to buy in the DOM(-60) ~ HA-Low range and sell in the HA-High ~ DOM(60) range. However, if the price rises in the HA-High ~ DOM(60) range, a step-up trend is likely, while if the price falls in the DOM(-60) ~ HA-Low range, a step-down trend is likely. Therefore, a split trading strategy is required. - The formation of the DOM(-60) indicator indicates a buying opportunity. However, as previously mentioned, this is the second time the indicator has fallen below the DOM(-60) level since its formation, increasing the likelihood of further declines. If the price falls below 104463.99 and continues to decline, it is expected to meet the M-Signal indicator on the 1M chart and re-establish the trend. At this point, the key area to consider is support, particularly around the left Fibonacci level of 2.618 (87814.27) to the left Fibonacci level of 3.14 (93570.28). If the price declines and a new HA-Low indicator is formed, support around that level is crucial. - You can profit by trading whether the price is in an uptrend or a downtrend. However, the trading period may vary depending on the trend. Therefore, you should check the flow of funds and determine whether trading is possible based on the support and resistance levels currently established. To continue the uptrend by breaking above a key point or range, 1. The StochRSI indicator must be trending upward. If possible, it should not have entered an overbought zone. 2. The TC (Trend Check) indicator must be trending upward. If possible, it should remain above the zero level. 3. The On-By-Sign-Operative (OBV) indicator must be trending upward. If possible, it should remain above the High Line. When all three indicators above are met, an uptrend is highly likely. Currently, the On-By-Sign-Operative (OBV) indicator is located near the Low Line, following the EMA 3 > EMA 2 > EMA 1 > OBV. Therefore, we can see that selling pressure is dominant. However, since it's located near the HA-Low indicator, you should pay close attention to the situation. If it finds support in the DOM(-60) ~ HA-Low range according to the basic trading strategy, it's a good time to buy. - Thank you for reading to the end. I wish you successful trading. -------------------------------------------------- - Here's an explanation of the big picture. (3-year bull market, 1-year bear market pattern) I'll explain more in detail when the bear market begins. ------------------------------------------------------