
readCrypto
@t_readCrypto

What symbols does the trader recommend buying?
Purchase History
Trader Messages
Filter
Message Type
readCrypto
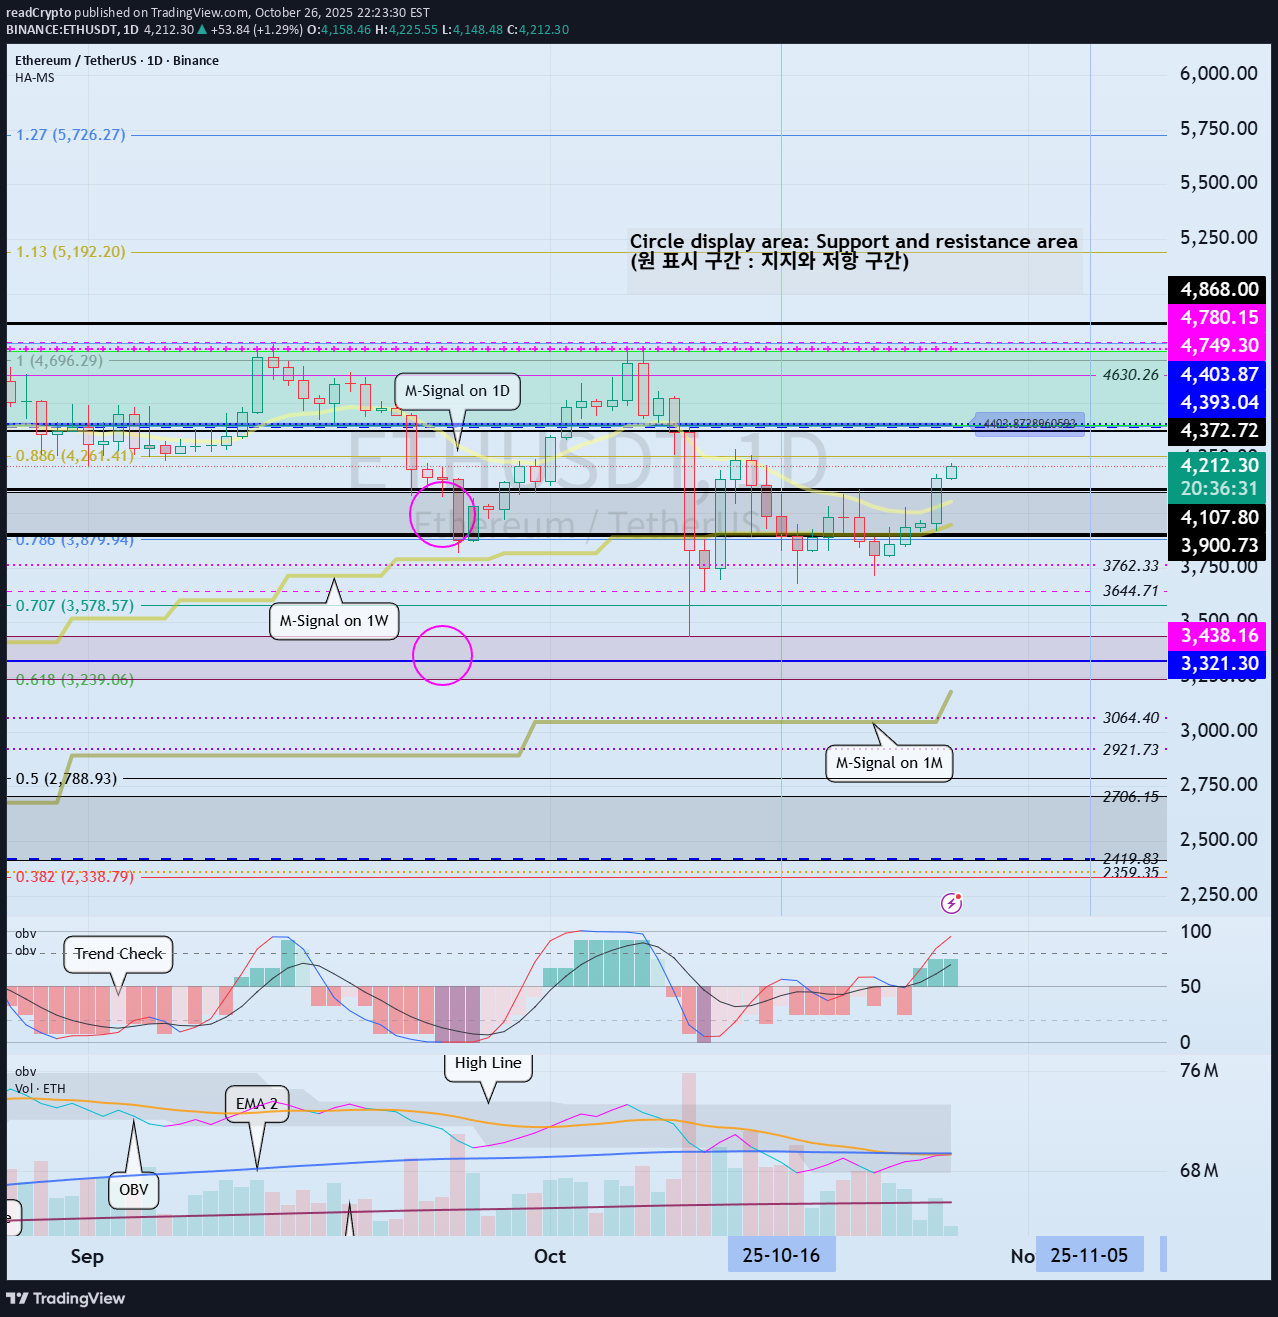
See if it finds support near 3321.30 and can rise
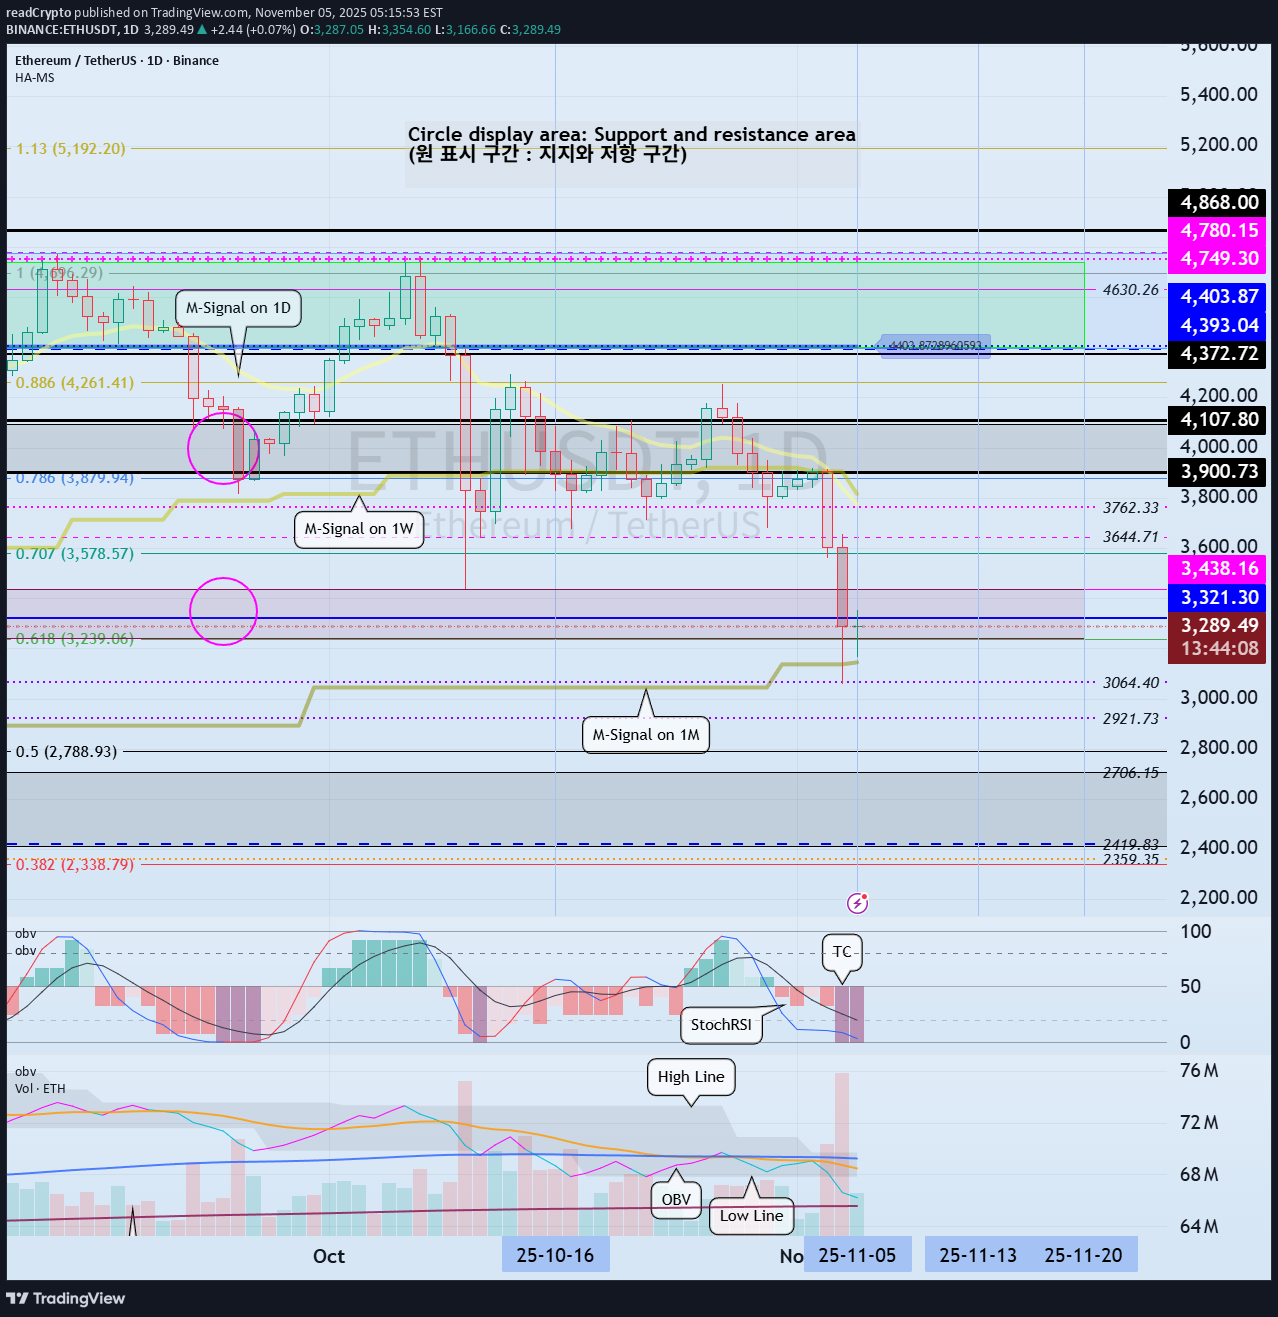
Hello, fellow traders! Follow us for quick updates. Have a great day. ------------------------------------- (ETHUSDT 1D chart) There's no change from what I mentioned in my previous idea. The M-Signal indicator on the 1M chart has been touched, so the trend will be re-determined. At this point, it's crucial to check for support near the Fibonacci 0.618 (3239.06) - 3438.16 range. If support fails and the price falls below the M-Signal indicator on the 1M chart, support should be checked around the 2419.83-2706.15 range. - Since the TC (Trend Check) indicator has touched its lowest point, a rebound is highly likely. Therefore, determining support near the critical Fibonacci 0.618 (3239.06) - 3438.16 range is more important than ever. Currently, ETH is in a period of volatility. Therefore, we need to monitor the movement until November 6th. The next period of volatility is around November 13th. - Thank you for reading. We wish you successful trading. --------------------------------------------------
readCrypto
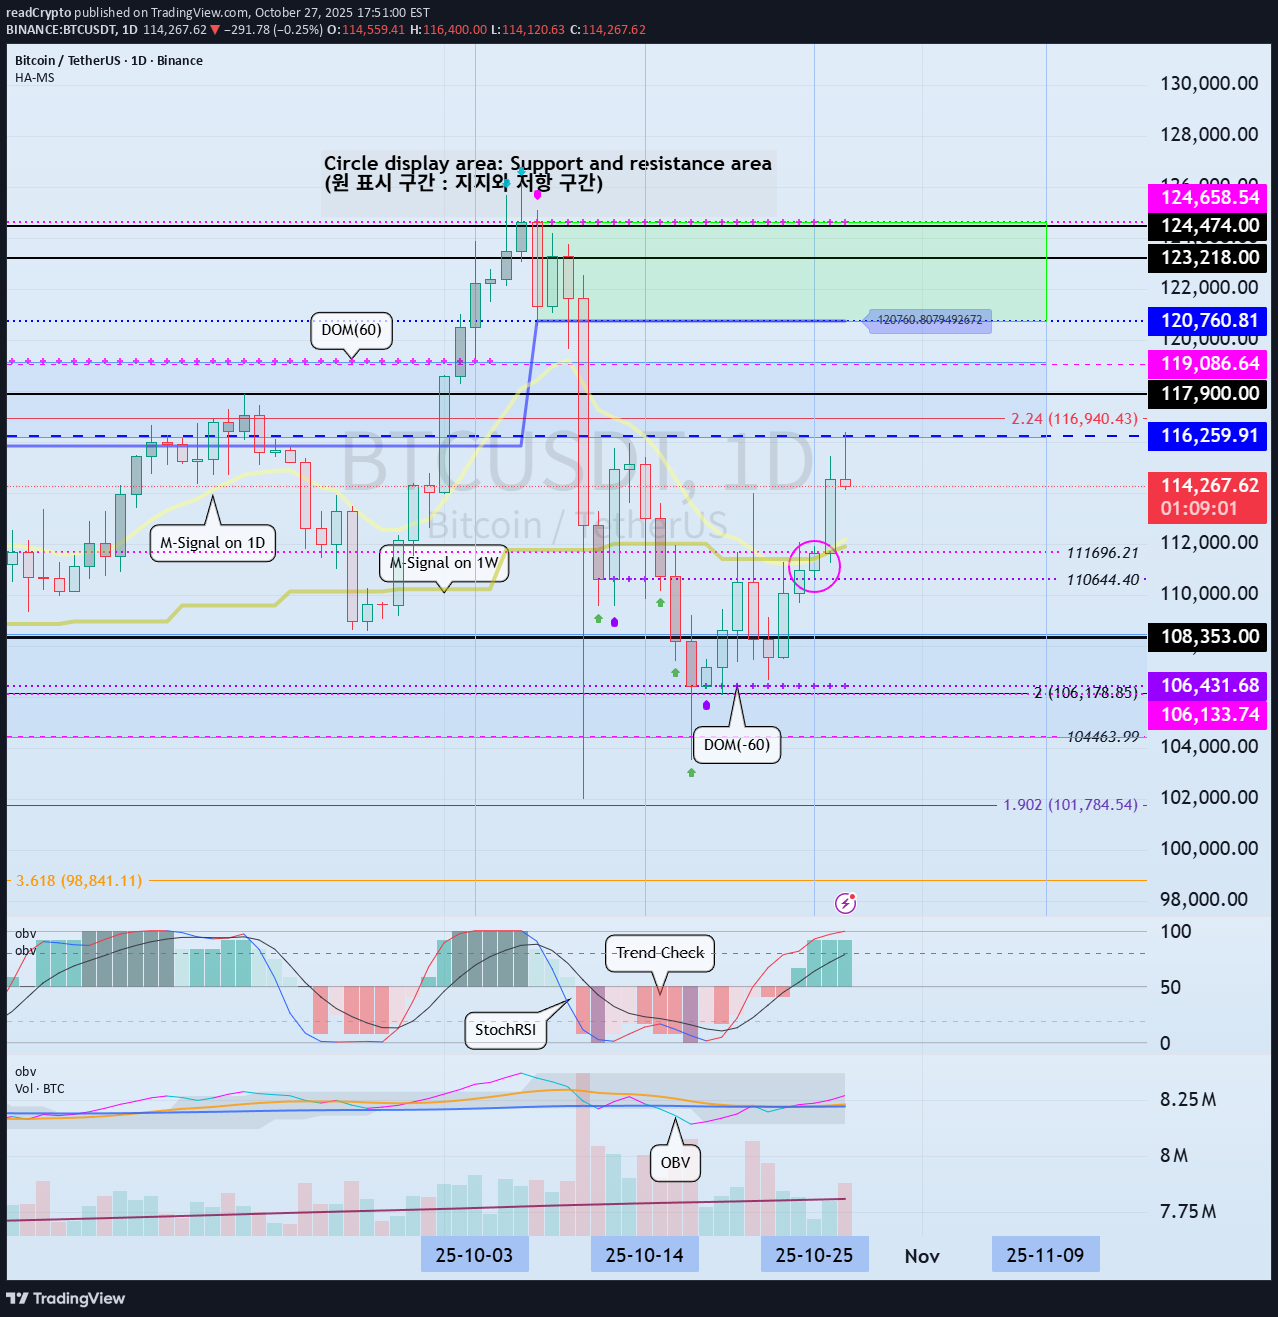
Need to see if it can rise above 104463.99
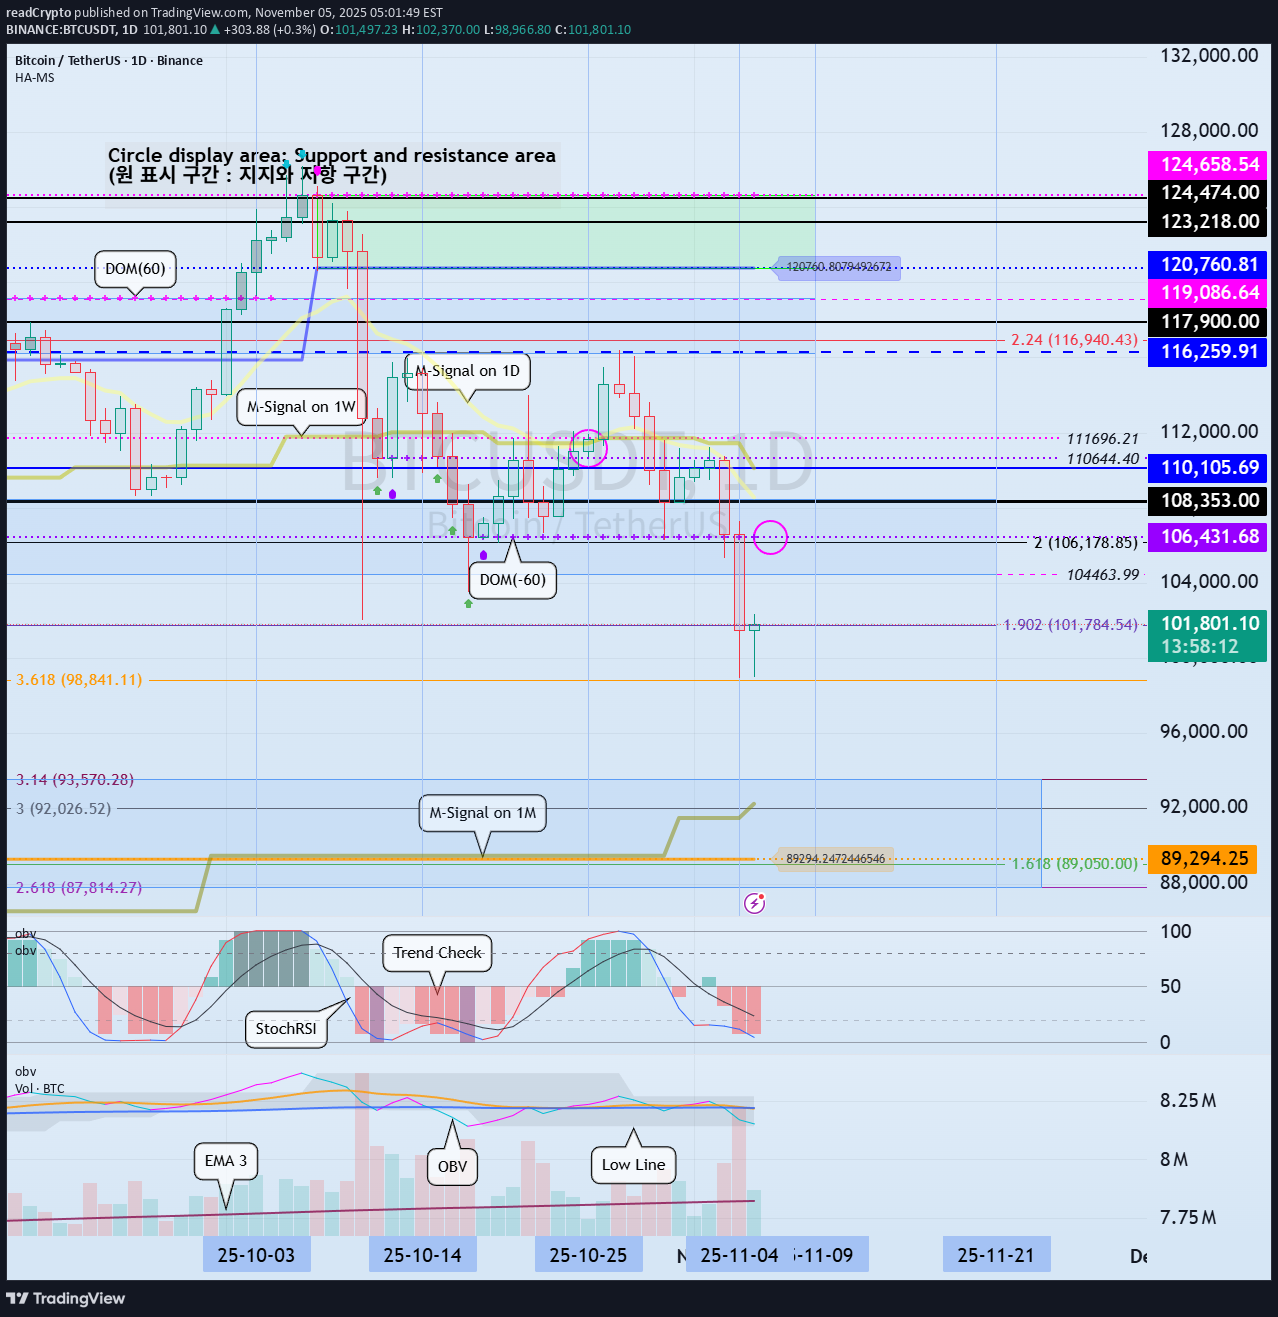
Hello, fellow traders! Please "Follow" to always get the latest information quickly. Have a great day. ------------------------------------- (BTCUSDT 1D chart) The price declined from the DOM(-60) indicator level of 106431.68, but the DOM(-60) indicator is still forming at 106431.68. Therefore, the 106431.68 level can be considered a low point. Therefore, we need to observe how the price moves during this volatile period, around November 4th-9th (maximum November 3rd-10th). Since it fell below the critical 104463.99-108353.0 level, if it fails to rise above this level, we should check for support near the next critical level of 89294.25. At this point, the M-Siganl indicator on the 1M chart is passing through a critical zone, so it's expected to re-establish the trend once it meets the M-Siganl indicator on the 1M chart. If the OBV indicator falls below the Low Line and fails to rise again, it's likely to touch EMA 3. For the price to break above a critical point or zone and continue the uptrend, 1. The StochRSI indicator must be rising. Ideally, it should not be in an overbought zone. 2. The TC (Trend Check) indicator must be rising. Ideally, it should remain above the zero level. 3. The OBV indicator must be rising. Ideally, it should remain above the High Line. If the above conditions are met, the upward trend is likely to continue after breaking above a critical point or zone. Currently, the price is moving against the above conditions, so there's a possibility of further decline. However, given the volatility, it's better to wait and see rather than assume a decline. ------------------------------------- I'm curious about what will happen next, but there's no way to know for sure. However, as I've repeatedly mentioned, if you're trading according to a basic trading strategy that suits your investment style, I believe you'll be able to trade according to your strategy, whether the current decline continues or rebounds and rises. As I mentioned in a previous idea, - If a daily decline exceeds -10%, a rebound is highly likely, - If a daily increase exceeds +10%, a reversal is highly likely. Therefore, if you're familiar with scalping or day trading, you can profit from trading. However, you must sell at that profit to lock in your profits. The basic trading strategy I mentioned is to buy in the DOM(-60) ~ HA-Low range and sell in the HA-High ~ DOM(60) range. Furthermore, we can respond based on the support and resistance levels identified on the 1M, 1W, and 1D charts, which are important areas. Therefore, the current available support levels are the 104463.99-108.353.0 and 87814.27-93570.28 levels. The remaining support and resistance levels can be used as trading opportunities. In other words, these are points for securing profits. - Due to this decline, the HA-High indicator on the 1M chart is showing signs of forming at the 110105.69 level. Therefore, if there is a rebound, the 110105.69 level could potentially serve as resistance. However, as the price rises, the HA-High indicator on the 1M chart could return to its previous HA-High level. Therefore, we need to determine if support is found in the 104463.99-108353.0 range and consider a response plan accordingly. - If the price falls below the M-Signal indicator on the 1M chart and remains there, there's a possibility of a downtrend, so we should also consider a response plan. The coin market operates in decimals, allowing for more flexible trading than the stock market. This means that by trading at a buy price, you can profit even if you're losing money and increase your coin (token) holdings. For example, if you bought $100 at $101,000, you could sell $100 (including transaction fees) when the price rises, increasing your profit. By increasing your profit, you can quickly turn a loss into a profit. If you bought $100 at 101,000 and only had 0.1 coins (tokens), you could sell those 0.1 coins and generate a cash profit if the price rises and you're making a profit. However, this method is only applicable if you won't be trading that coin (token) again. In other words, if you sell 100% of your holdings, you'll need to wait until the next price fluctuation, or you could end up making a worse trade. Therefore, if possible, it's best to trade with the same amount you bought, increasing the number of coins (tokens) that represent your profit. Don't think you should just leave the coin (token) you're losing and trade another coin (token) to make a profit. This could actually lead to further losses. - Thank you for reading to the end. I wish you successful trading. -------------------------------------------------- - This explains the big picture. (3-year bull market, 1-year bear market pattern) I will explain in more detail when the bear market begins. ------------------------------------------------------
readCrypto
Example of a Trading Style
Hello? Hello, fellow traders. Follow me to get the latest information quickly. Have a great day. ------------------------------------- While it's ideal to always close a trade in profit, this isn't always the case. Therefore, you should maintain your trade by locking in profits through fractional trading. Based on the trading information provided by the exchange, once a trade has turned into a loss, it's likely to take a considerable amount of time to turn into a profit again. Therefore, you should trade at different buy and sell prices. However, this is a rather tedious process, so it's not usually done that way. - If you were to buy near the area shown on the chart, the estimated average purchase price would be significantly higher than the current price. Therefore, you wouldn't be able to proceed with the trade. Therefore, we must trade by purchase price. The purchase prices for positions 1 and 2 are quite high, so we don't pay attention to them. Since the current price is near the purchase price for position 3, if it turns into a profit, you can sell the amount you purchased near position 3 to lock in the profit. By subtracting this profit from the purchase price for positions 1 and 2, you can minimize your losses. This trading method is possible because the coin market allows trading in decimals. The key here is to trade by purchase price. You should not trade in units of the number of coins you purchased. For example, if you purchased $100 at point 3 (106431.68), you should sell $100 when the price rises. Trading this way will allow you to quickly recover from losses and even generate profits even during losses. - You can profit whenever volatility occurs, regardless of whether the asset (coin or token) you're trading is in a loss or a profit. You should avoid increasing the number of assets (coins or tokens) you're trading without managing them. ------------------------------------------------ To do this, 1. Mark support and resistance points on the 1M, 1W, and 1D charts. 2. Develop a basic trading strategy using these support and resistance points. 3. Avoid greed and execute split trades according to your trading strategy. - Thank you for reading to the end. I wish you successful trading. --------------------------------------------------
readCrypto
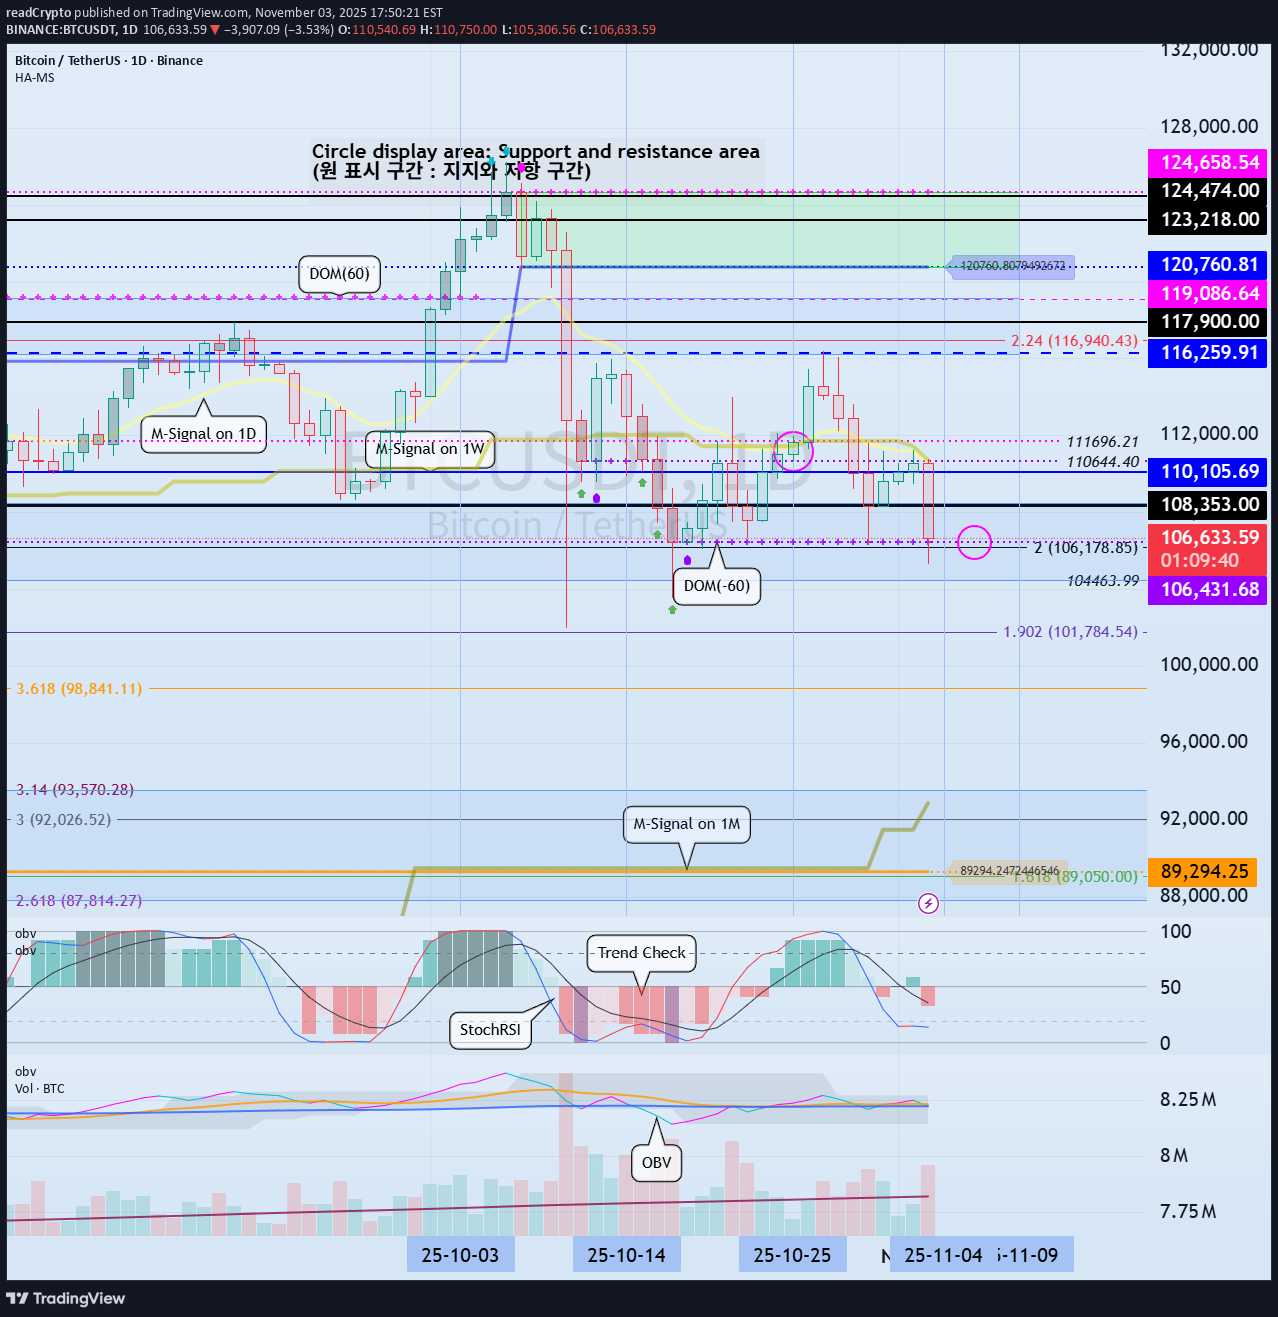
Volatility Period: Up to November 10th
Hello, traders! Follow us to get the latest information quickly. Have a great day! ------------------------------------- (BTCUSDT 1D chart) This volatility period is expected to last from November 3rd to 9th. First, we need to check the movement between November 3rd and 5th. While the key question is whether the price can rise after finding support at the important support and resistance level of 104463.99-108353.0, it's crucial to check for support around 106431.68 within that range. This is because the 106431.68 point is the DOM(-60) level. - The DOM indicator is a comprehensive evaluation of the DMI, OBV, and MOMENTUM indicators. DOM(-60) indicates that all three indicators have reached their lows. Therefore, support is necessary to confirm the possibility of a bullish reversal. If the price rises after the DOM(-60) indicator first appears and then touches the DOM(-60) indicator again, it is highly likely that the price will fall without finding support. If the price rises after finding support at the DOM(-60) indicator, it should follow a period of sideways movement to confirm support. - Therefore, what we can do now is take the time to determine which direction the price deviates from the 106431.68-108353.0 range and where it encounters support and resistance. You need your own basic trading strategy to execute your trades. No one else can do this for you. This is because you need to tailor your trading strategy to your investment style to avoid regrets. My basic trading strategy is to buy in the DOM(-60) ~ HA-Low range and sell in the HA-High ~ DOM(60) range. However, if the price rises in the HA-High ~ DOM(60) range, a step-up trend is likely, while if the price falls in the DOM(-60) ~ HA-Low range, a step-down trend is likely. Therefore, a split trading strategy is required. - The formation of the DOM(-60) indicator indicates a buying opportunity. However, as previously mentioned, this is the second time the indicator has fallen below the DOM(-60) level since its formation, increasing the likelihood of further declines. If the price falls below 104463.99 and continues to decline, it is expected to meet the M-Signal indicator on the 1M chart and re-establish the trend. At this point, the key area to consider is support, particularly around the left Fibonacci level of 2.618 (87814.27) to the left Fibonacci level of 3.14 (93570.28). If the price declines and a new HA-Low indicator is formed, support around that level is crucial. - You can profit by trading whether the price is in an uptrend or a downtrend. However, the trading period may vary depending on the trend. Therefore, you should check the flow of funds and determine whether trading is possible based on the support and resistance levels currently established. To continue the uptrend by breaking above a key point or range, 1. The StochRSI indicator must be trending upward. If possible, it should not have entered an overbought zone. 2. The TC (Trend Check) indicator must be trending upward. If possible, it should remain above the zero level. 3. The On-By-Sign-Operative (OBV) indicator must be trending upward. If possible, it should remain above the High Line. When all three indicators above are met, an uptrend is highly likely. Currently, the On-By-Sign-Operative (OBV) indicator is located near the Low Line, following the EMA 3 > EMA 2 > EMA 1 > OBV. Therefore, we can see that selling pressure is dominant. However, since it's located near the HA-Low indicator, you should pay close attention to the situation. If it finds support in the DOM(-60) ~ HA-Low range according to the basic trading strategy, it's a good time to buy. - Thank you for reading to the end. I wish you successful trading. -------------------------------------------------- - Here's an explanation of the big picture. (3-year bull market, 1-year bear market pattern) I'll explain more in detail when the bear market begins. ------------------------------------------------------
readCrypto
Examples of Chart Interpretation Methods
Hello, fellow traders! Follow us to get the latest information quickly. Have a great day! ------------------------------------- #BTCUSDT To break above a key point or range and continue the uptrend, 1. The StochRSI indicator must be trending upward. Ideally, it should not enter the overbought zone. 2. The On-By-Signal (OBV) indicator must show an upward trend. If possible, it should remain above the High Line. 3. The TC (Trend Check) indicator must show an upward trend. If possible, it should remain above the 0 level. Currently, only the TC indicator satisfies the above conditions. Therefore, if the price remains above the 110644.40-111696.21 range and the above conditions are met, we should see if the price rises above 116259.91 and remains there. If the On-By-Signal (OBV) indicator remains above EMA 1 and EMA 2 and rises above the High Line, further upside is likely. However, if the K indicator of the StochRSI indicator enters the overbought zone and the slope changes, the upside may be limited. When the TC (Trend Check) indicator touches its highest point, there's a high probability of forming a new high, so you should consider a response plan. Summary of the above: Support Zone: 110644.40-111696.21 Resistance Zone: 116259.91-119086.64 (up to 124658.54) ------------------------------------ #ETHUSDT As mentioned in the BTC chart description, ETH is also showing similar movements. However, the OBV indicator is just about to break above EMA 1 and EMA 2, so if it finds support near 4109.80, there's a possibility of further upside. ------------------------------------- #ZECUSDT Based on the BTC chart description, ZEC is likely to continue its upward trend. The chart is broken due to the sudden surge, making it difficult to determine the duration of volatility. -------------------------------------------- #XRPUSDT The key is whether the price can find support at key support and resistance levels and rise above 2.9092. ------------------------------------------ Ultimately, trading will be based on the support and resistance levels drawn on the 1M, 1W, and 1D charts. However, it is recommended to use auxiliary indicators to confirm whether to initiate a trade. The basic trading strategy is to buy in the DOM(-60) ~ HA-Low range and sell in the HA-High ~ DOM(60) range. However, if the price rises in the HA-High ~ DOM(60) range, a step-up trend is likely, while if the price falls in the DOM(-60) ~ HA-Low range, a step-down trend is likely. Therefore, a fractional trading strategy is recommended. In this context, the coin (token) currently closest to buying is XRP. - Thank you for reading to the end. I wish you successful trading. --------------------------------------------------
readCrypto
The key is whether it can rise above 4403.87
Hello, traders. Follow us to get the latest information quickly. Have a great day. ------------------------------------- (ETHUSDT 1W chart) The formation of an upward trend line (A) created an upward channel from (A) to (B). Therefore, the key is whether it can continue to rise along this upward trend line. If the upward movement fails, we need to check whether the price rises along the rising trend lines (1) and (2). Therefore, the 3900.73-4107.80 range is a crucial area for sustaining the upward trend. In this context, we expect a significant period of volatility to begin around the week of November 24th. This period of volatility could continue until around the week of January 12th, 2026. - (1M Chart) If this month closes with a bearish candle, forming an upward trend line (a), the key question is whether the price can rise along trend line (a). If not, there's a possibility of touching the upward trend line (2), so we need to consider a response plan. - (1D Chart) The key is whether the price can sustain above the uptrend line (1) and rise above 4403.87. To do this, we need to see if it can break above the downward channel created on the 1D chart. Therefore, we need to observe how the price moves after the volatility period around November 5th. The HA-High ~ DOM(60) section (4393.04-4780.15) on the 1W chart overlaps with the HA-High ~ DOM(60) section (4403.87-4749.30) on the 1D chart, so it's likely to act as resistance. ------------------------------------ The basic trading strategy is to buy in the DOM(-60) ~ HA-Low section and sell in the HA-High ~ DOM(60) section. However, if the price rises from the HA-High to DOM(60) range, a step-like uptrend is likely, while if it falls from the DOM(-60) to HA-Low range, a step-like downtrend is likely. Therefore, a split trading strategy is recommended. To maintain a step-like uptrend in the DOM(-60) to HA-Low range, 1. The StochRSI indicator must be rising. If possible, it should not enter the overbought zone. 2. The On-By-Value (OBV) indicator must be rising. If possible, it should remain above the High Line. 3. The TC (Trend Check) indicator must be rising. If possible, it should remain above the 0 level. If the above conditions are met, the uptrend is likely to continue. If not, a high point is likely to form, so you should consider a countermeasure. - Thank you for reading to the end. I wish you successful trading. --------------------------------------------------
readCrypto
Volatility Period: Around October 22nd (October 21st-23rd)

Hello, traders! If you "Follow" us, you'll always get the latest information quickly. Have a great day. ------------------------------------- (TSLA 1M Chart) The key is whether the price can rise above the target level of 488.54 by following the rising channel. If the price fails to rise, we should check for support near 381.59. - (1W Chart) The rising trend line (1) has formed, forming an ascending channel. Therefore, the key is whether the price can maintain above the rising trend line (2) and rise along the rising channel. The HA-High ~ DOM(60) range on the 1W chart is formed in the 382.40-421.06 range. If the price remains above this range, a stepwise uptrend is expected to continue. - (1D chart) The key question is whether the price can continue its upward trend toward 488.54 after passing through this volatile period around October 22nd (October 21st-23rd). To do so, we need to see if it can find support and rise around 439.60-442.79. - Thank you for reading to the end. I wish you successful trading. --------------------------------------------------
readCrypto
Check if 224.47-260.42 can be supported

Hello, fellow traders! If you "Follow" us, you'll always get the latest information quickly. Have a great day. ------------------------------------- (ZECUSDT 1M chart) You might be wondering why it's rising, but you don't need to know why. Because it's already rising. It's a sharp rise, breaking above the important support and resistance area of 56.29-78.91. The key is whether the price can hold above the Fibonacci 1.618 (338.52) level. If not, we need to check for support near 220.20, the previous DOM (60) indicator level. Since the chart was broken by a surge, I believe the next support period is crucial. - (1W chart) The next volatility period is expected to be November 3-23, around the week of November 10. - (1D chart) As mentioned earlier, since the chart was broken by a surge, I think we can calculate the next volatility period based on the next support period. Until then, we need to see how the price moves after this volatility period, which runs around October 21 (October 20-22). Looking at the current 1D chart, the HA-High ~ DOM(60) range is forming between 224.47 and 260.42. Therefore, we need to see if it can find support within this range and rise. If it falls below 220.20, it could fall to around 115.72, so we should consider a response plan. - Thank you for reading to the end. I wish you successful trading. --------------------------------------------------
readCrypto
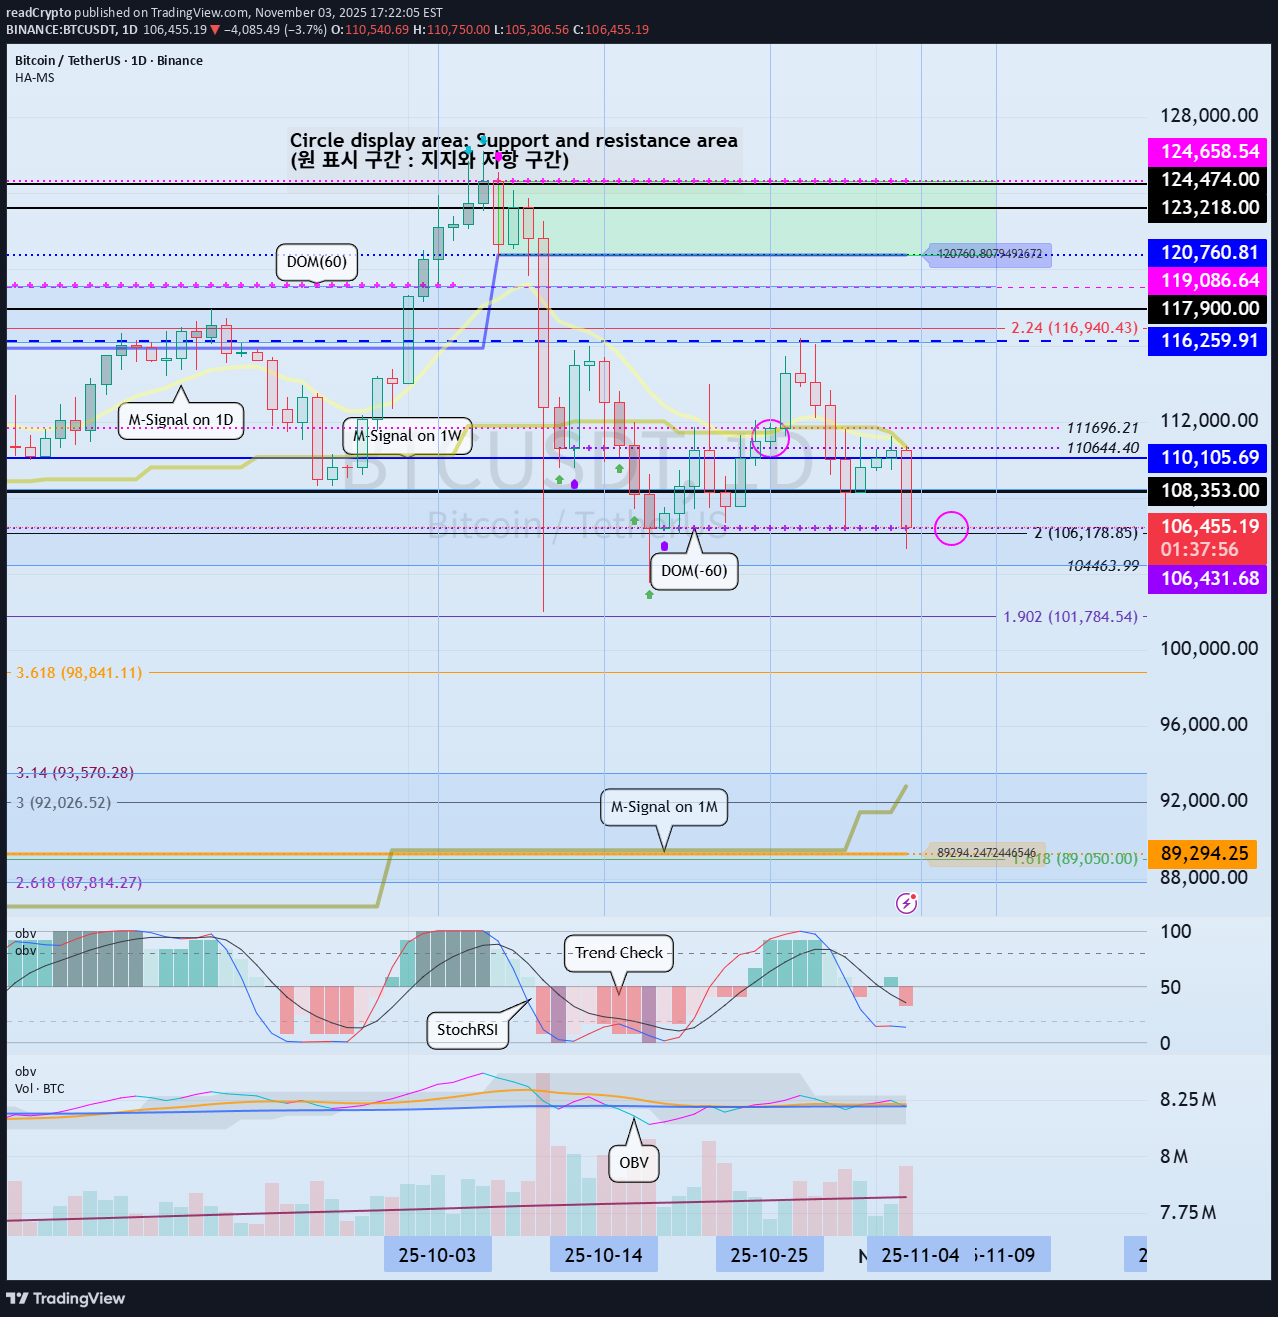
See if it can rise above 110644.40-111696.21

Hello, fellow traders! Please "Follow" to always get the latest information quickly. Have a great day. ------------------------------------- (BTCUSDT 1W Chart) Support levels for maintaining an uptrend are: 1st: 104463.99-108353.0 2nd: 87814.27-93570.28 Support must be found within the first and second levels above. To rise above the right Fibonacci ratio of 2.618 (133889.92), which is my target level, the price must rise above the uptrend line (1) and maintain its position. In other words, the price must rise above the HA-High indicator level of 116259.91 on the 1W chart and maintain its position. - (1D Chart) The key is whether the price can find support near 10443.99-108353.0 and rise above the 110644.40-111696.21 range. If the price fails to rise, it is highly likely to fall further, so we need to consider countermeasures. Since the M-Signal indicator on the 1W and 1D charts is passing near the 110644.40-111696.21 range, I believe the trend will likely be determined by the presence of support. The HA-High ~ DOM(60) range on the 1W chart is formed within the 116,259.91-119,086.64 range, while the HA-High ~ DOM(60) range on the 1D chart is formed within the 120,760.81-124,658.54 range. Therefore, the 116,259.91-124,658.54 range is likely to act as resistance. Therefore, I believe a surge in capital is needed to break above this range. - Therefore, I believe BTC dominance should rise while USDT dominance should decline. If BTC dominance rises, most altcoins are likely to move sideways or decline, so altcoin trading requires a strategy to counter this. BTC dominance is likely to rise to around 61.73, USDT dominance is expected to fall below 4.55 and break above the resistance level. - If both BTC and USDT dominance decline simultaneously, an altcoin bull market could begin. However, BTC dominance must decline below 55.01, and USDT dominance must also decline below 4.91. The next period of volatility is expected to occur around October 25th (October 24th-26th). - Thank you for reading. We wish you successful trading. -------------------------------------------------- - This is an explanation of the big picture. (3-year bull market, 1-year bear market pattern) I will explain in more detail when the bear market begins. ------------------------------------------------------#BTCUSDT The 111696.21 point is the previous DOM(60) indicator level, and the 110644.40 point is the DOM(-60) indicator level. Therefore, the key question is whether support can be found around 110644.40-111696.21 and the price can rise. If not, we need to check for support around 106431.68, the current DOM(-60) indicator level. To break above a key point or range and continue the uptrend, 1. The StochRSI indicator must be trending upward. Ideally, it should not enter the overbought zone. 2. The On-By-Sign-Observation Volume indicator must be trending upward. Ideally, it should remain above the High Line. 3. The TC (Trend Check) indicator must be trending upward. If possible, it should remain above the 0 point. If the above conditions are met, the upward trend is likely to continue.#BTCUSDT #ETHUSDT BTC remains within the important support and resistance levels mentioned in the previous idea, while ETH remains outside them. Therefore, the key question is whether ETH can rise above 3900.73. If not, it could decline to around 3321.30. BTC has a DOM (-60) indicator level formed at 106431.68, so if it declines, it will be crucial to determine whether support is found near this level.
readCrypto
Volatility Period: October 16 (October 15-17)

Hello, traders! Follow us to get the latest information quickly. Have a great day! ------------------------------------- (ETHUSDT 1D Chart) Following BTC, ETH is also entering a volatility period. This period of volatility for ETH is expected to last until October 16th (October 15th-17th). After this period of volatility, the key question is whether the price can find support around 3900.72-4372.72 and rise above 4403.87 to maintain its price. If the price fails to rise, it is expected to encounter the M-Signal indicator on the 1M chart, so a response plan should be considered. - (1M chart) The StochRSI indicator on the 1M chart is entering an overbought zone, potentially limiting its upward movement. Therefore, 1st: 3900.73-4107.80 2nd: 3321.30-3438.16 We need to determine whether the price can rise after finding support near the 1st and 2nd levels above. In other words, we need to see if the price remains above the M-Siganl indicator on the 1M chart. - (1W chart) Looking at the 1W chart, the HA-High ~ DOM (60) range is formed in the 4393.04-4780.15 range. Therefore, a rise above this range is necessary for a stepwise uptrend. Ultimately, the key question is whether the price can rise above the 4393.04-4780.15 range. ---------------------------------- Therefore, the key question is whether the 4393.04-4780.15 range, which corresponds to the HA-High ~ DOM(60) range on the 1W and 1D charts, can rise after this period of volatility. As I always say, to break above this important point or range and continue the uptrend, 1. The StochRSI indicator must be trending upward. If possible, it's best to avoid entering the overbought zone. 2. The On-By-Sign-Observable (OBV) indicator must be trending upward. If possible, it should remain above the High Line. 3. The TC (Trend Check) indicator must be trending upward. If possible, it should remain above the 0 level. If the above conditions are met, the uptrend is likely to continue. It's recommended to draw support and resistance points or ranges on the 1M, 1W, and 1D charts and utilize auxiliary indicators to determine the significance of these points or ranges. When drawing support and resistance points or zones, we often think of them as important, but it can be difficult to recognize how important they actually are. Therefore, when drawing support and resistance points or zones, it's important to be able to develop a basic trading strategy. Once you've established a basic trading strategy, the key to trading is figuring out how to maintain that strategy and respond accordingly. No matter what chart analysis you use, you'll ultimately need to draw support and resistance points or zones. Therefore, the first step is to draw support and resistance points or zones on the 1M, 1W, and 1D charts. Next, you should check auxiliary indicators to determine the importance of the drawn support and resistance points or zones and determine whether you should respond. To achieve this, you need to understand your investment size and how to manage your reserve funds. You should always keep a certain portion (approximately 20%) of your total investment in cash. This allows you to respond to volatility when it occurs. If you've invested too much money in a single coin (token, stock), it's a good idea to sell some of it when the price rises to a certain level and secure cash. Ultimately, overcoming the relentless volatility of the beginning and achieving profit depends on how you manage your funds. - Thank you for reading to the end. I wish you successful trading. --------------------------------------------------
Disclaimer
Any content and materials included in Finbeet's website and official communication channels are a compilation of personal opinions and analyses and are not binding. They do not constitute any recommendation for buying, selling, entering or exiting the stock market and cryptocurrency market. Also, all news and analyses included in the website and channels are merely republished information from official and unofficial domestic and foreign sources, and it is obvious that users of the said content are responsible for following up and ensuring the authenticity and accuracy of the materials. Therefore, while disclaiming responsibility, it is declared that the responsibility for any decision-making, action, and potential profit and loss in the capital market and cryptocurrency market lies with the trader.