Technical analysis by readCrypto about Symbol BTC on 13 hour ago

readCrypto
Need to see if it can rise above 104463.99
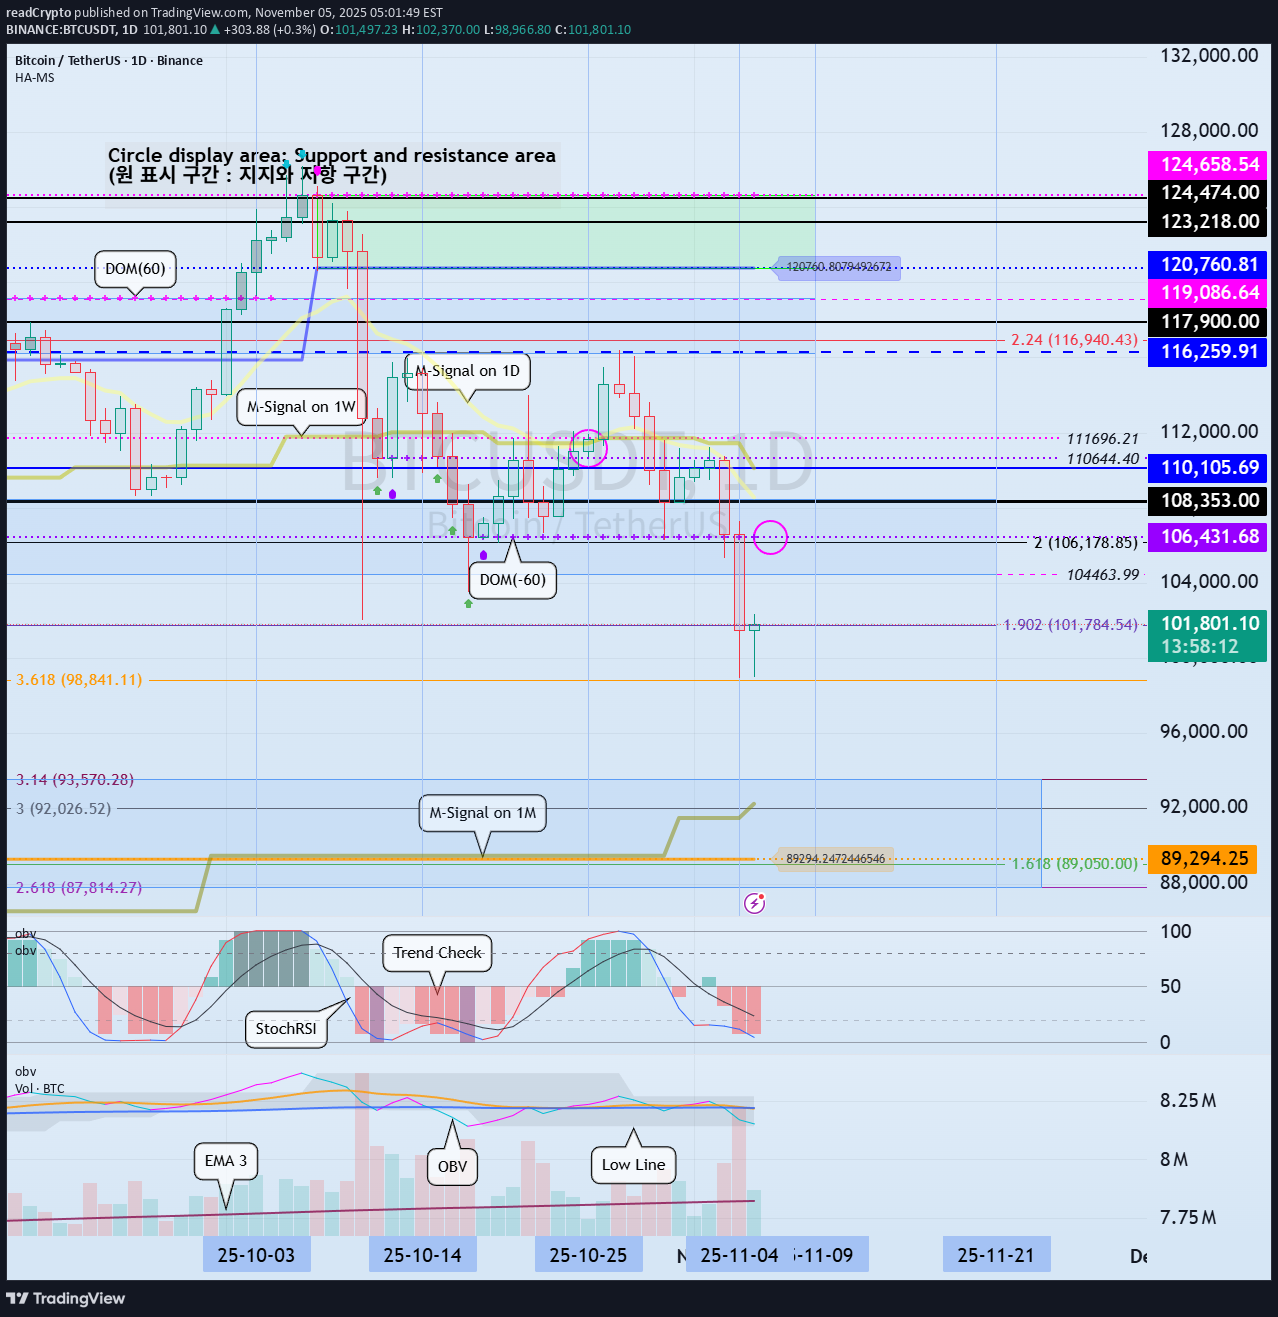
Hello, fellow traders! Please "Follow" to always get the latest information quickly. Have a great day. ------------------------------------- (BTCUSDT 1D chart) The price declined from the DOM(-60) indicator level of 106431.68, but the DOM(-60) indicator is still forming at 106431.68. Therefore, the 106431.68 level can be considered a low point. Therefore, we need to observe how the price moves during this volatile period, around November 4th-9th (maximum November 3rd-10th). Since it fell below the critical 104463.99-108353.0 level, if it fails to rise above this level, we should check for support near the next critical level of 89294.25. At this point, the M-Siganl indicator on the 1M chart is passing through a critical zone, so it's expected to re-establish the trend once it meets the M-Siganl indicator on the 1M chart. If the OBV indicator falls below the Low Line and fails to rise again, it's likely to touch EMA 3. For the price to break above a critical point or zone and continue the uptrend, 1. The StochRSI indicator must be rising. Ideally, it should not be in an overbought zone. 2. The TC (Trend Check) indicator must be rising. Ideally, it should remain above the zero level. 3. The OBV indicator must be rising. Ideally, it should remain above the High Line. If the above conditions are met, the upward trend is likely to continue after breaking above a critical point or zone. Currently, the price is moving against the above conditions, so there's a possibility of further decline. However, given the volatility, it's better to wait and see rather than assume a decline. ------------------------------------- I'm curious about what will happen next, but there's no way to know for sure. However, as I've repeatedly mentioned, if you're trading according to a basic trading strategy that suits your investment style, I believe you'll be able to trade according to your strategy, whether the current decline continues or rebounds and rises. As I mentioned in a previous idea, - If a daily decline exceeds -10%, a rebound is highly likely, - If a daily increase exceeds +10%, a reversal is highly likely. Therefore, if you're familiar with scalping or day trading, you can profit from trading. However, you must sell at that profit to lock in your profits. The basic trading strategy I mentioned is to buy in the DOM(-60) ~ HA-Low range and sell in the HA-High ~ DOM(60) range. Furthermore, we can respond based on the support and resistance levels identified on the 1M, 1W, and 1D charts, which are important areas. Therefore, the current available support levels are the 104463.99-108.353.0 and 87814.27-93570.28 levels. The remaining support and resistance levels can be used as trading opportunities. In other words, these are points for securing profits. - Due to this decline, the HA-High indicator on the 1M chart is showing signs of forming at the 110105.69 level. Therefore, if there is a rebound, the 110105.69 level could potentially serve as resistance. However, as the price rises, the HA-High indicator on the 1M chart could return to its previous HA-High level. Therefore, we need to determine if support is found in the 104463.99-108353.0 range and consider a response plan accordingly. - If the price falls below the M-Signal indicator on the 1M chart and remains there, there's a possibility of a downtrend, so we should also consider a response plan. The coin market operates in decimals, allowing for more flexible trading than the stock market. This means that by trading at a buy price, you can profit even if you're losing money and increase your coin (token) holdings. For example, if you bought $100 at $101,000, you could sell $100 (including transaction fees) when the price rises, increasing your profit. By increasing your profit, you can quickly turn a loss into a profit. If you bought $100 at 101,000 and only had 0.1 coins (tokens), you could sell those 0.1 coins and generate a cash profit if the price rises and you're making a profit. However, this method is only applicable if you won't be trading that coin (token) again. In other words, if you sell 100% of your holdings, you'll need to wait until the next price fluctuation, or you could end up making a worse trade. Therefore, if possible, it's best to trade with the same amount you bought, increasing the number of coins (tokens) that represent your profit. Don't think you should just leave the coin (token) you're losing and trade another coin (token) to make a profit. This could actually lead to further losses. - Thank you for reading to the end. I wish you successful trading. -------------------------------------------------- - This explains the big picture. (3-year bull market, 1-year bear market pattern) I will explain in more detail when the bear market begins. ------------------------------------------------------