Technical analysis by John_Isige about Symbol ETH on 11/18/2025

John_Isige
ETH/USD — Bearish Breakdown Toward 2,500
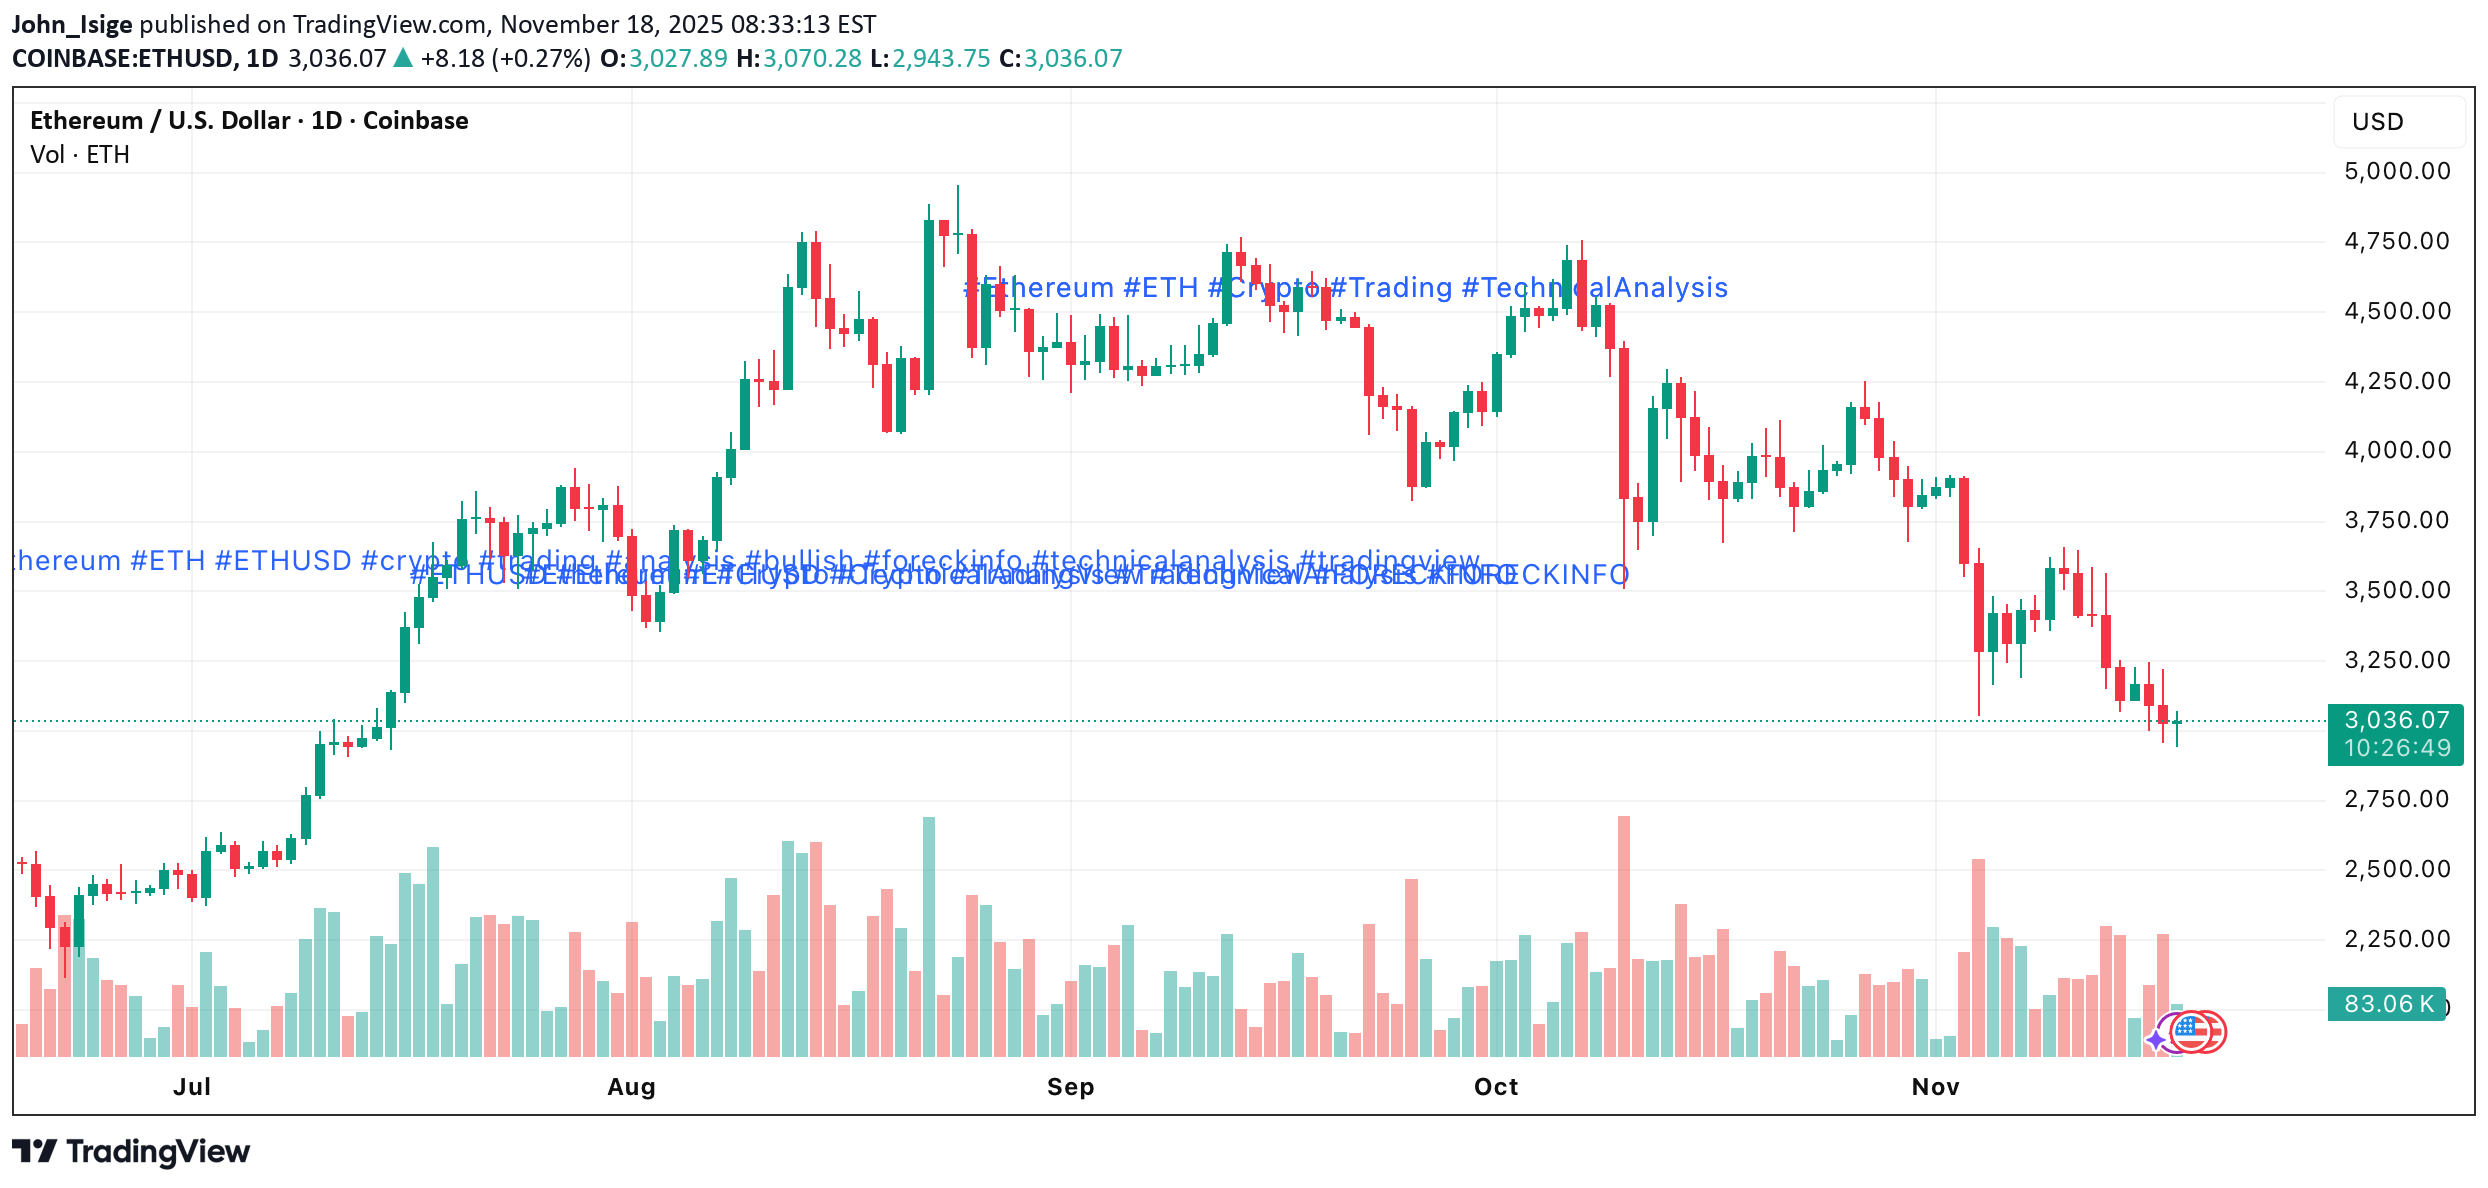
Ethereum extended its decline last week and broke below 3,125 (Murray [2/8]), updating the July low with a drop to 2,950. The market remains dominated by risk-off sentiment as the Fed signals the possibility of pausing rate cuts in December, geopolitical tension increases, and uncertainty around AI-driven tech investments grows. The Fear & Greed Index sits at 11 (extreme fear), while ETF outflows intensified: • ETH ETFs: –$1.4B (≈7% of AUM) • BTC ETFs: –4% On-chain activity also confirms weakening demand: ETH deposits fell 13% to a four-month low, and weekly DEX volume declined 27% to $17.4B. The fundamental backdrop continues to favor the bears. ⸻ Technical Setup ETH/USD broke below its descending channel and consolidated under 3,125, opening a clear path to deeper downside targets: Bearish Structure • Price trades below the mid-Bollinger band • Bollinger Bands point downward • MACD expands in the negative zone • Stochastic remains flat inside oversold conditions Unless ETH reclaims 3,750, the trend remains decisively bearish. ⸻ Key Levels Resistance: 3,750 · 4,375 · 5,000 Support: 3,125 · 2,500 · 2,187 ⸻ Trading Plan 🔻 Primary Scenario — SELL STOP • Entry: 2,960 • TP1: 2,500 • TP2: 2,187 • SL: 3,300 • Bias: bearish continuation • Timeframe: Weekly (5–7 days) 🔼 Alternative Scenario — BUY STOP • Entry: 3,770 • TP1: 4,375 • TP2: 5,000 • SL: 3,360 • Bias: reversal only above 3,750 ⸻ ETH remains in a strong downtrend after losing the 3,125 support zone. A move below 2,960 confirms continuation toward 2,500 → 2,187, while only a breakout above 3,750 would signal a potential trend reversal.