
John_Isige
@t_John_Isige

What symbols does the trader recommend buying?
Purchase History
Trader Messages
Filter
Message Type
John_Isige
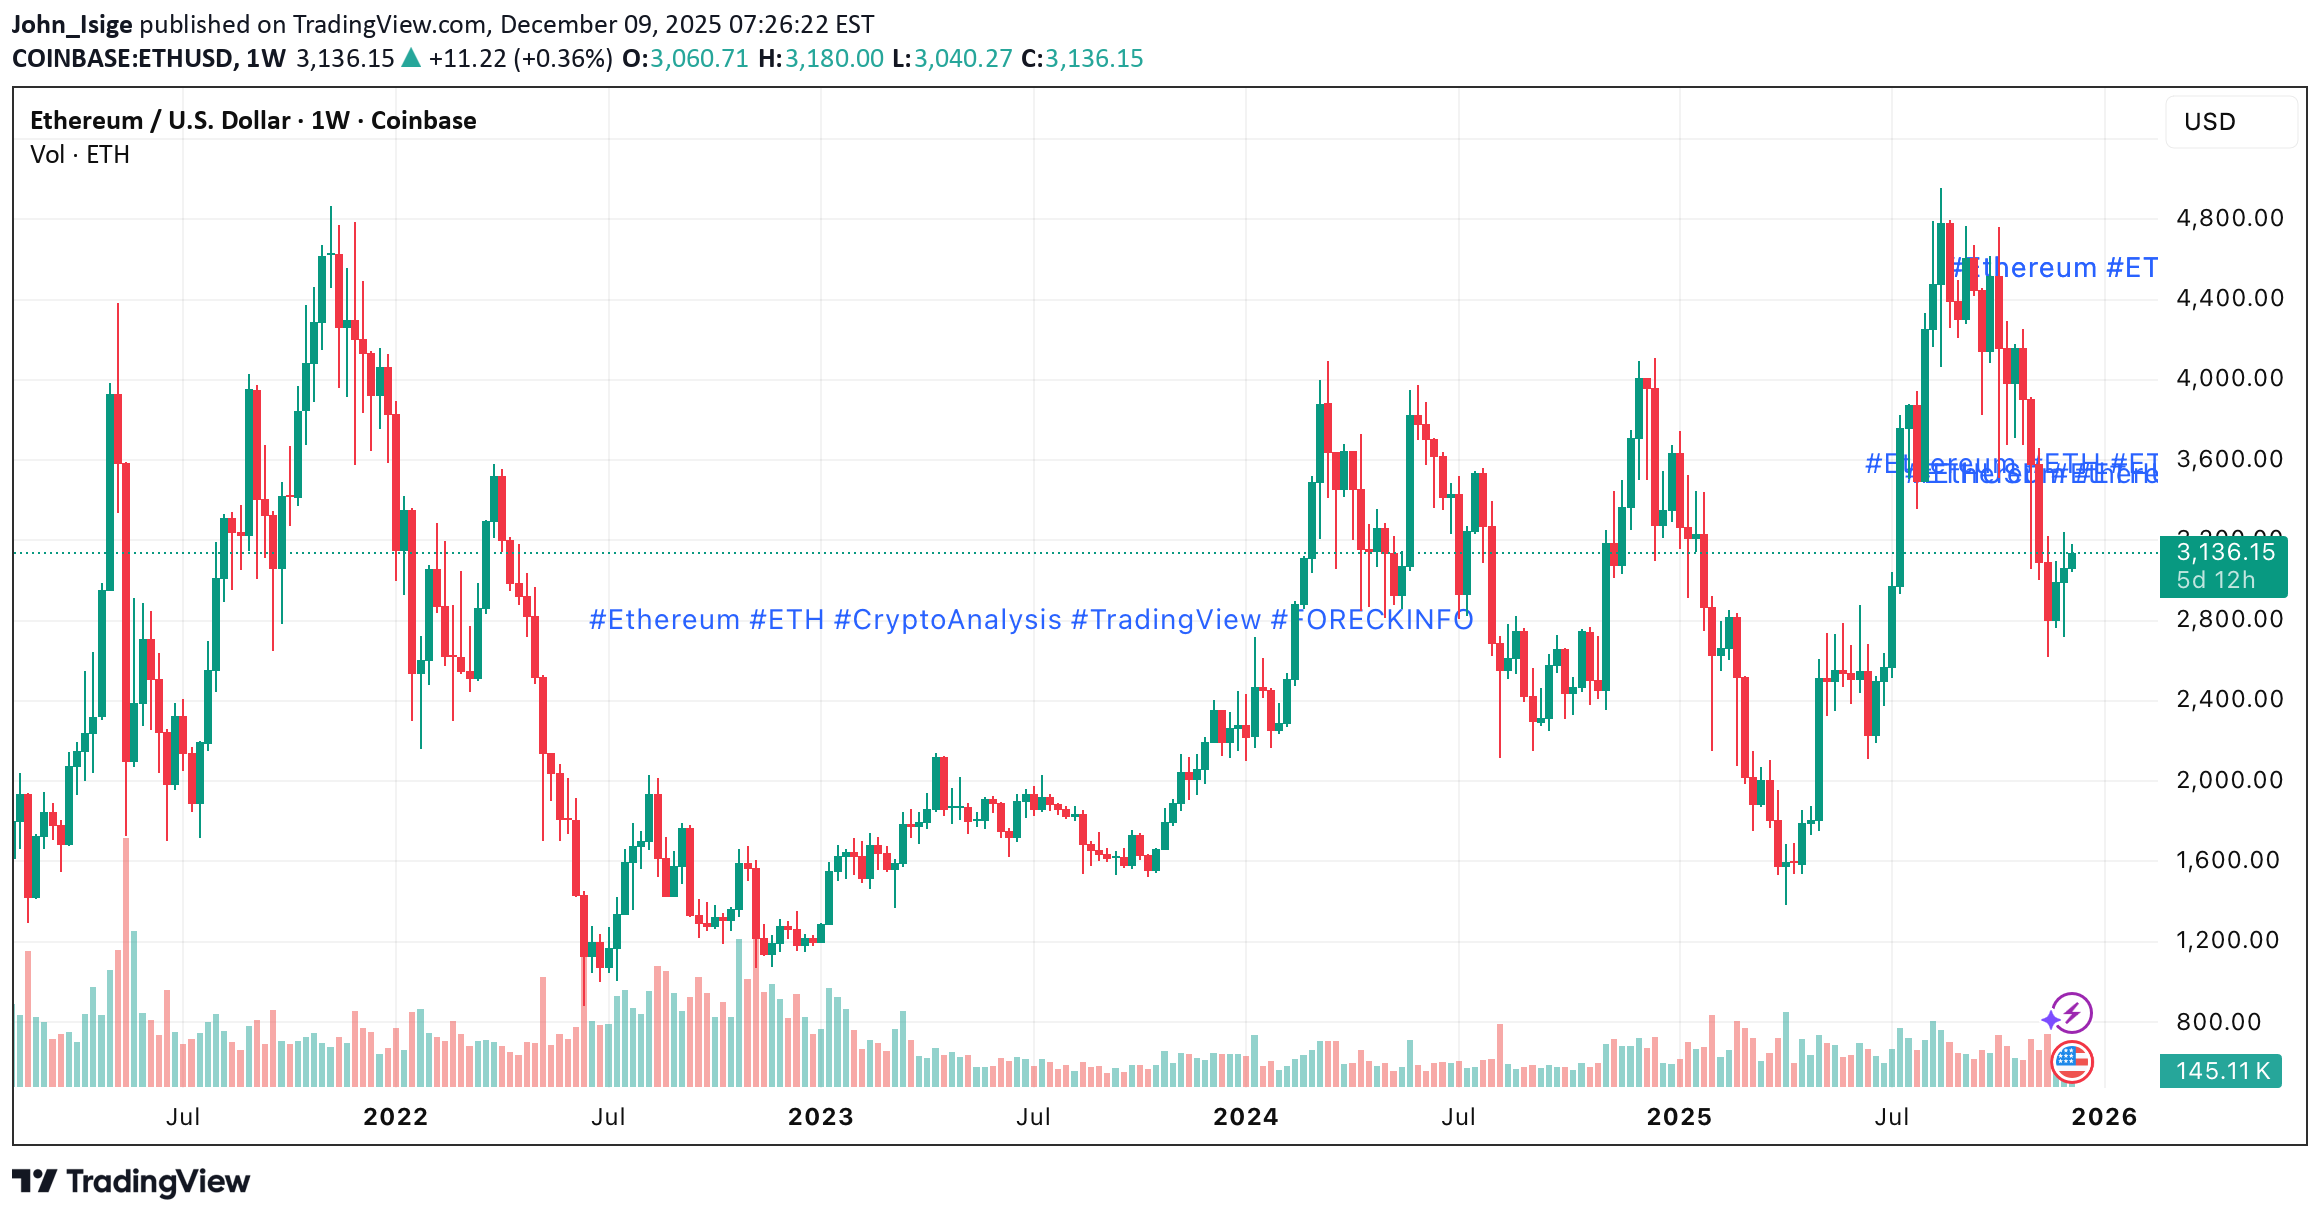
ETH/USD remains in a medium-term downtrend, but since last week the price has stabilized inside a 3125–2980 consolidation zone (Murray [2/8], 50% Fib, mid-Bollinger Band). The market is holding this range while awaiting the Fed’s December 10 rate decision. The CME FedWatch Tool shows a 89% probability of a 25 bps cut to 3.75%. Since this outcome is largely priced in, traders are focused on forward guidance: • Continuation of easing in January → bullish for crypto • Pause after December → bearish for risk assets ETH receives additional support from BlackRock’s filing of an S-1 to launch the iShares Ethereum Staking Trust (ETHB) — a staking ETF that could expand institutional participation. Despite this, sentiment remains weak: the Fear & Greed Index stays at 22, and Ethereum ETFs saw $56.4M in outflows last week (though Monday brought +$35.5M). ⸻ Market Structure ETH trades inside a broad bearish structure with key boundaries defined: Bullish reversal zone: 3437–3540 (Murray [3/8], 38.2% Fib, upper BB) A breakout above this area opens the way toward: • 4062.50 (23.6% Fib, Murray [5/8]) • 4687.50 (Murray [7/8]) • 5000.00 (Murray [8/8]) Bearish continuation zone: 2812.50–2720.00 (Murray [1/8], 61.8% Fib) A breakdown below this support activates targets: • 2187.50 (Murray [–1/8]) • 1875.00 (Murray [–2/8]) Indicators: • Bollinger Bands → flattening (rangebound) • Stochastic → neutral, sideways • MACD → continues drifting lower in negative territory No clear momentum signal yet, confirming indecision before the Fed meeting. ⸻ Key Levels Resistance: 3540 • 4062.50 • 4687.50 • 5000 Support: 2720 • 2187.50 • 1875 ⸻ ETH/USD — Trading Scenarios (Weekly) Primary Scenario — SELL STOP Entry: 2700 TP: 2187.50 • 1875 SL: 3100 Alternative Scenario — BUY STOP Entry: 3550 TP: 4062.50 • 4687.50 • 5000 SL: 3240
John_Isige
BTC/USD — Bears Defend 93.75K: Risk Extends Toward 75K
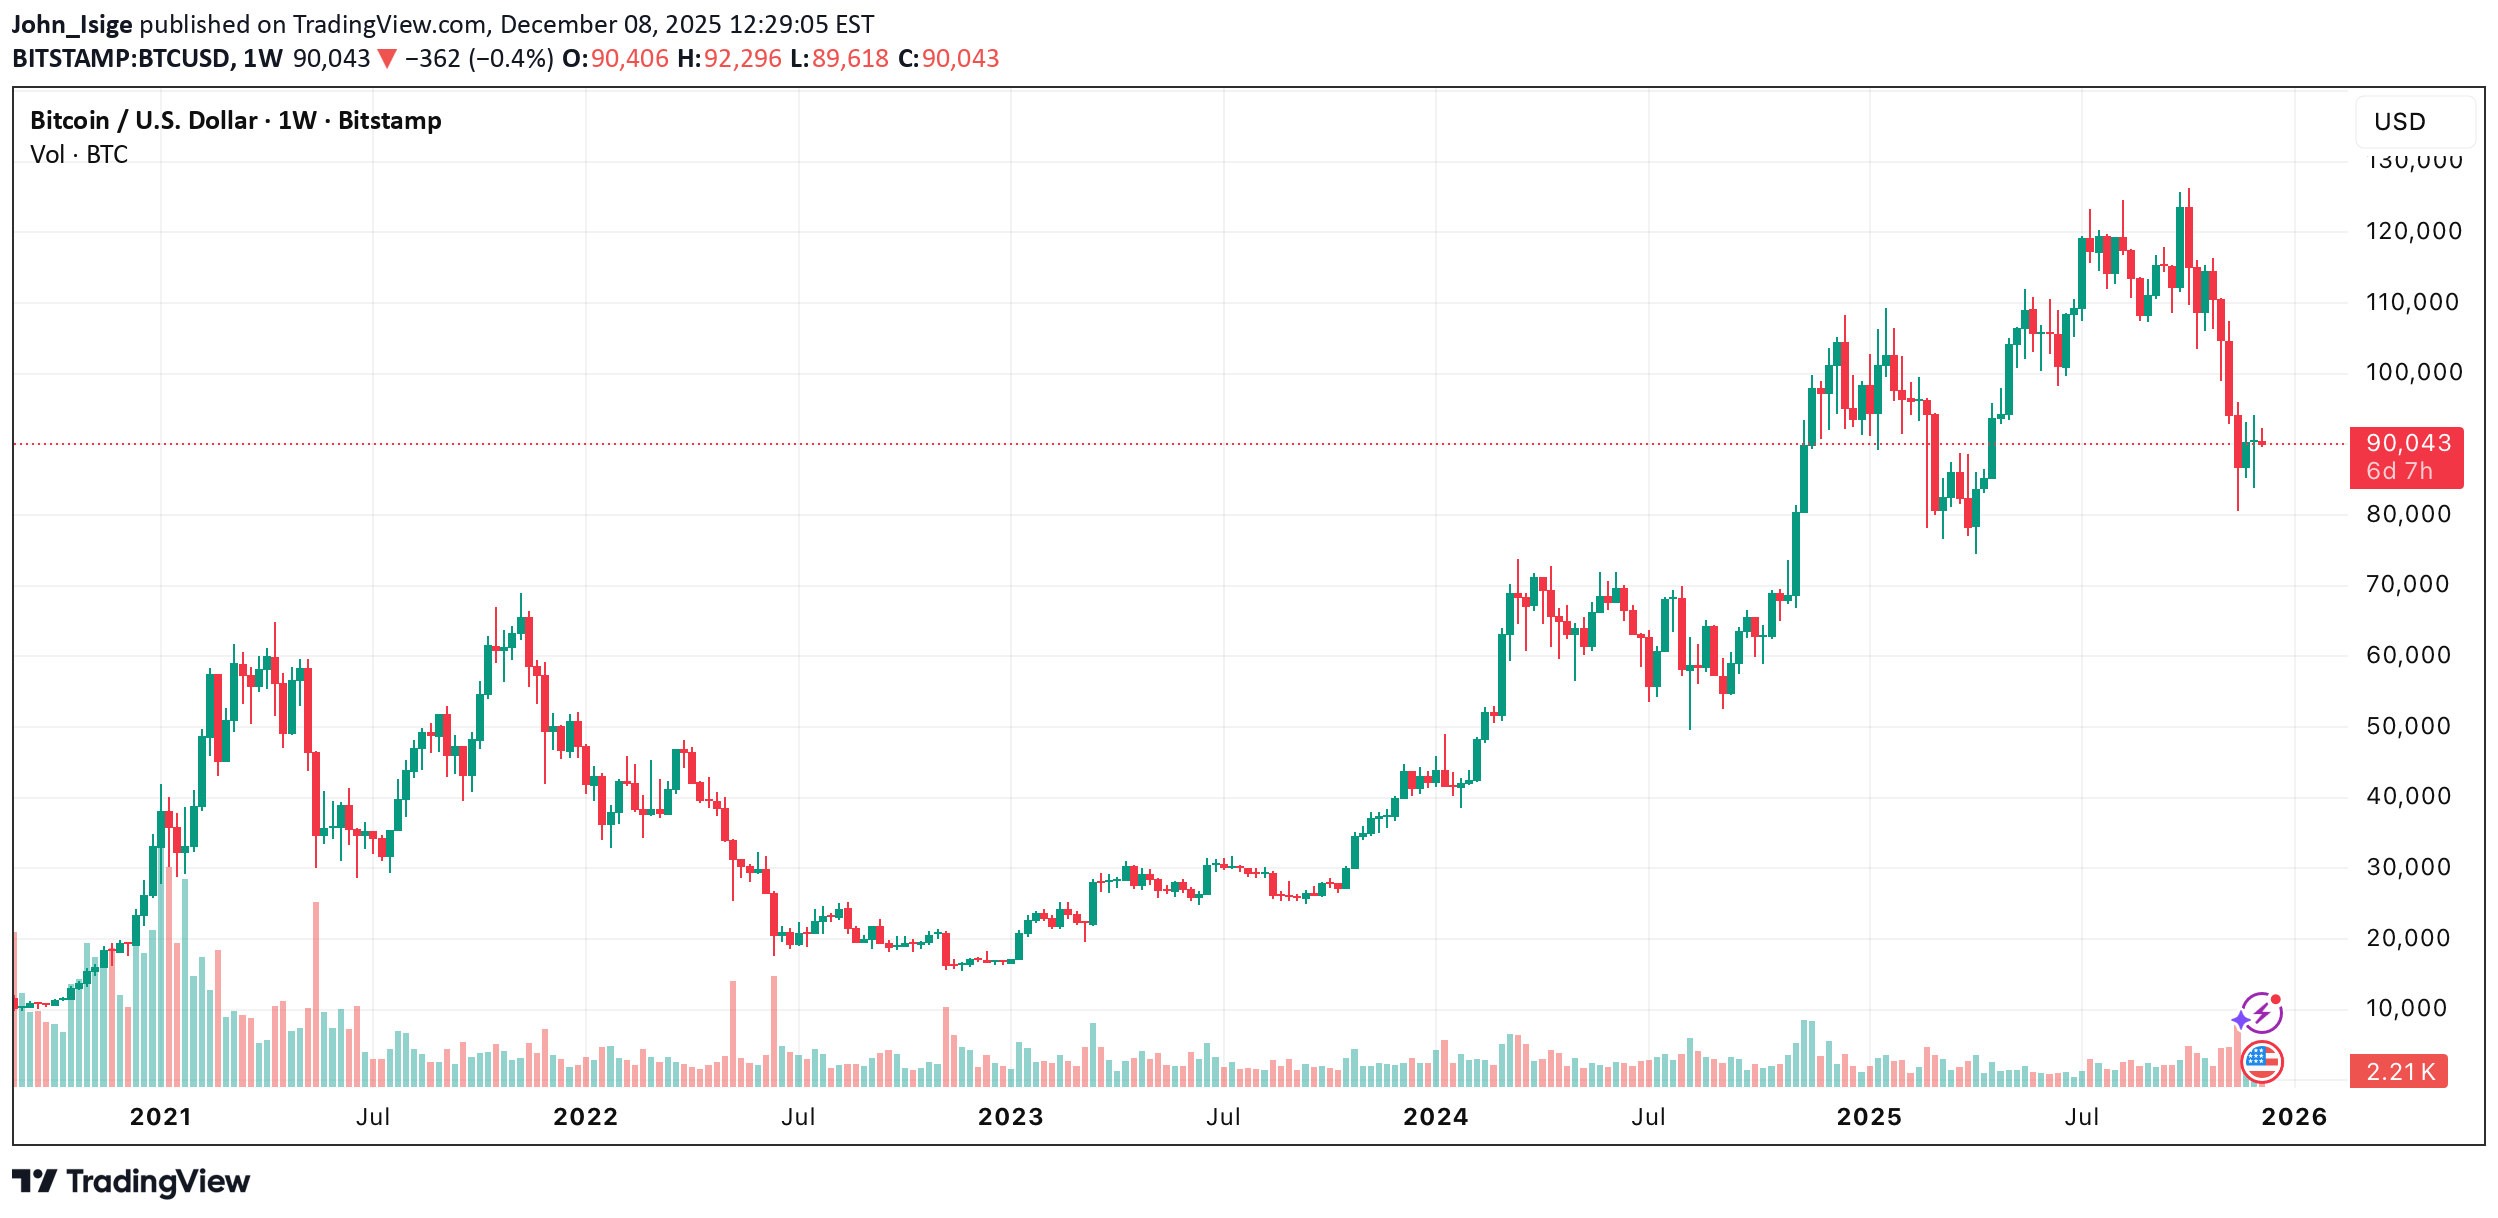
BTC/USD spent last week inside the 93,750–87,500 range, failing to break higher despite growing expectations of a Fed rate cut on December 10. CME FedWatch shows ~90% odds of a 25 bp cut, but Powell’s earlier remarks about a potential pause keep uncertainty elevated. Despite a minor rebound, upside remains capped. Investors reacted negatively to the U.S. National Security Strategy, which ignored crypto entirely while highlighting AI and quantum tech as critical national priorities. ETF flows also signal persistent risk aversion: Bitcoin ETFs recorded $87.7M in net outflows, while the Fear & Greed Index remains in Extreme Fear (20). Given this backdrop, a sustained bullish recovery looks unlikely even if the Fed delivers a dovish decision. ⸻ Market Structure BTC trades inside a long-term downtrend, with a short-term rebound failing at the upper boundary of the range. A clean break above 93,750 (Murray [3/8], 61.8% Fib, upper BB) would open a move toward 100,000 and 106,250, but sellers continue to dominate. A breakdown below 87,500 (Murray [2/8]) would trigger continuation toward the cycle lows at 75,000 and 68,750. Technical indicators maintain a bearish bias: • Bollinger Bands → flat • Stochastic → turning down • MACD → stable in negative territory Momentum remains weak. ⸻ Key Levels Resistance: 93,750 • 100,000 • 106,250 Support: 87,500 • 75,000 • 68,750 ⸻ BTC/USD — Trading Scenarios (Weekly) Primary Scenario — SELL STOP Entry: 87,450 Take Profit: 75,000 • 68,750 Stop Loss: 92,300 Bias: Bearish continuation below key support ⸻ Alternative Scenario — SELL LIMIT Entry: 100,000 Take Profit: 75,000 • 68,750 Stop Loss: 104,000 Bias: Fade the rally into resistance
John_Isige
TRX/USD — Trying to Break the Downtrend
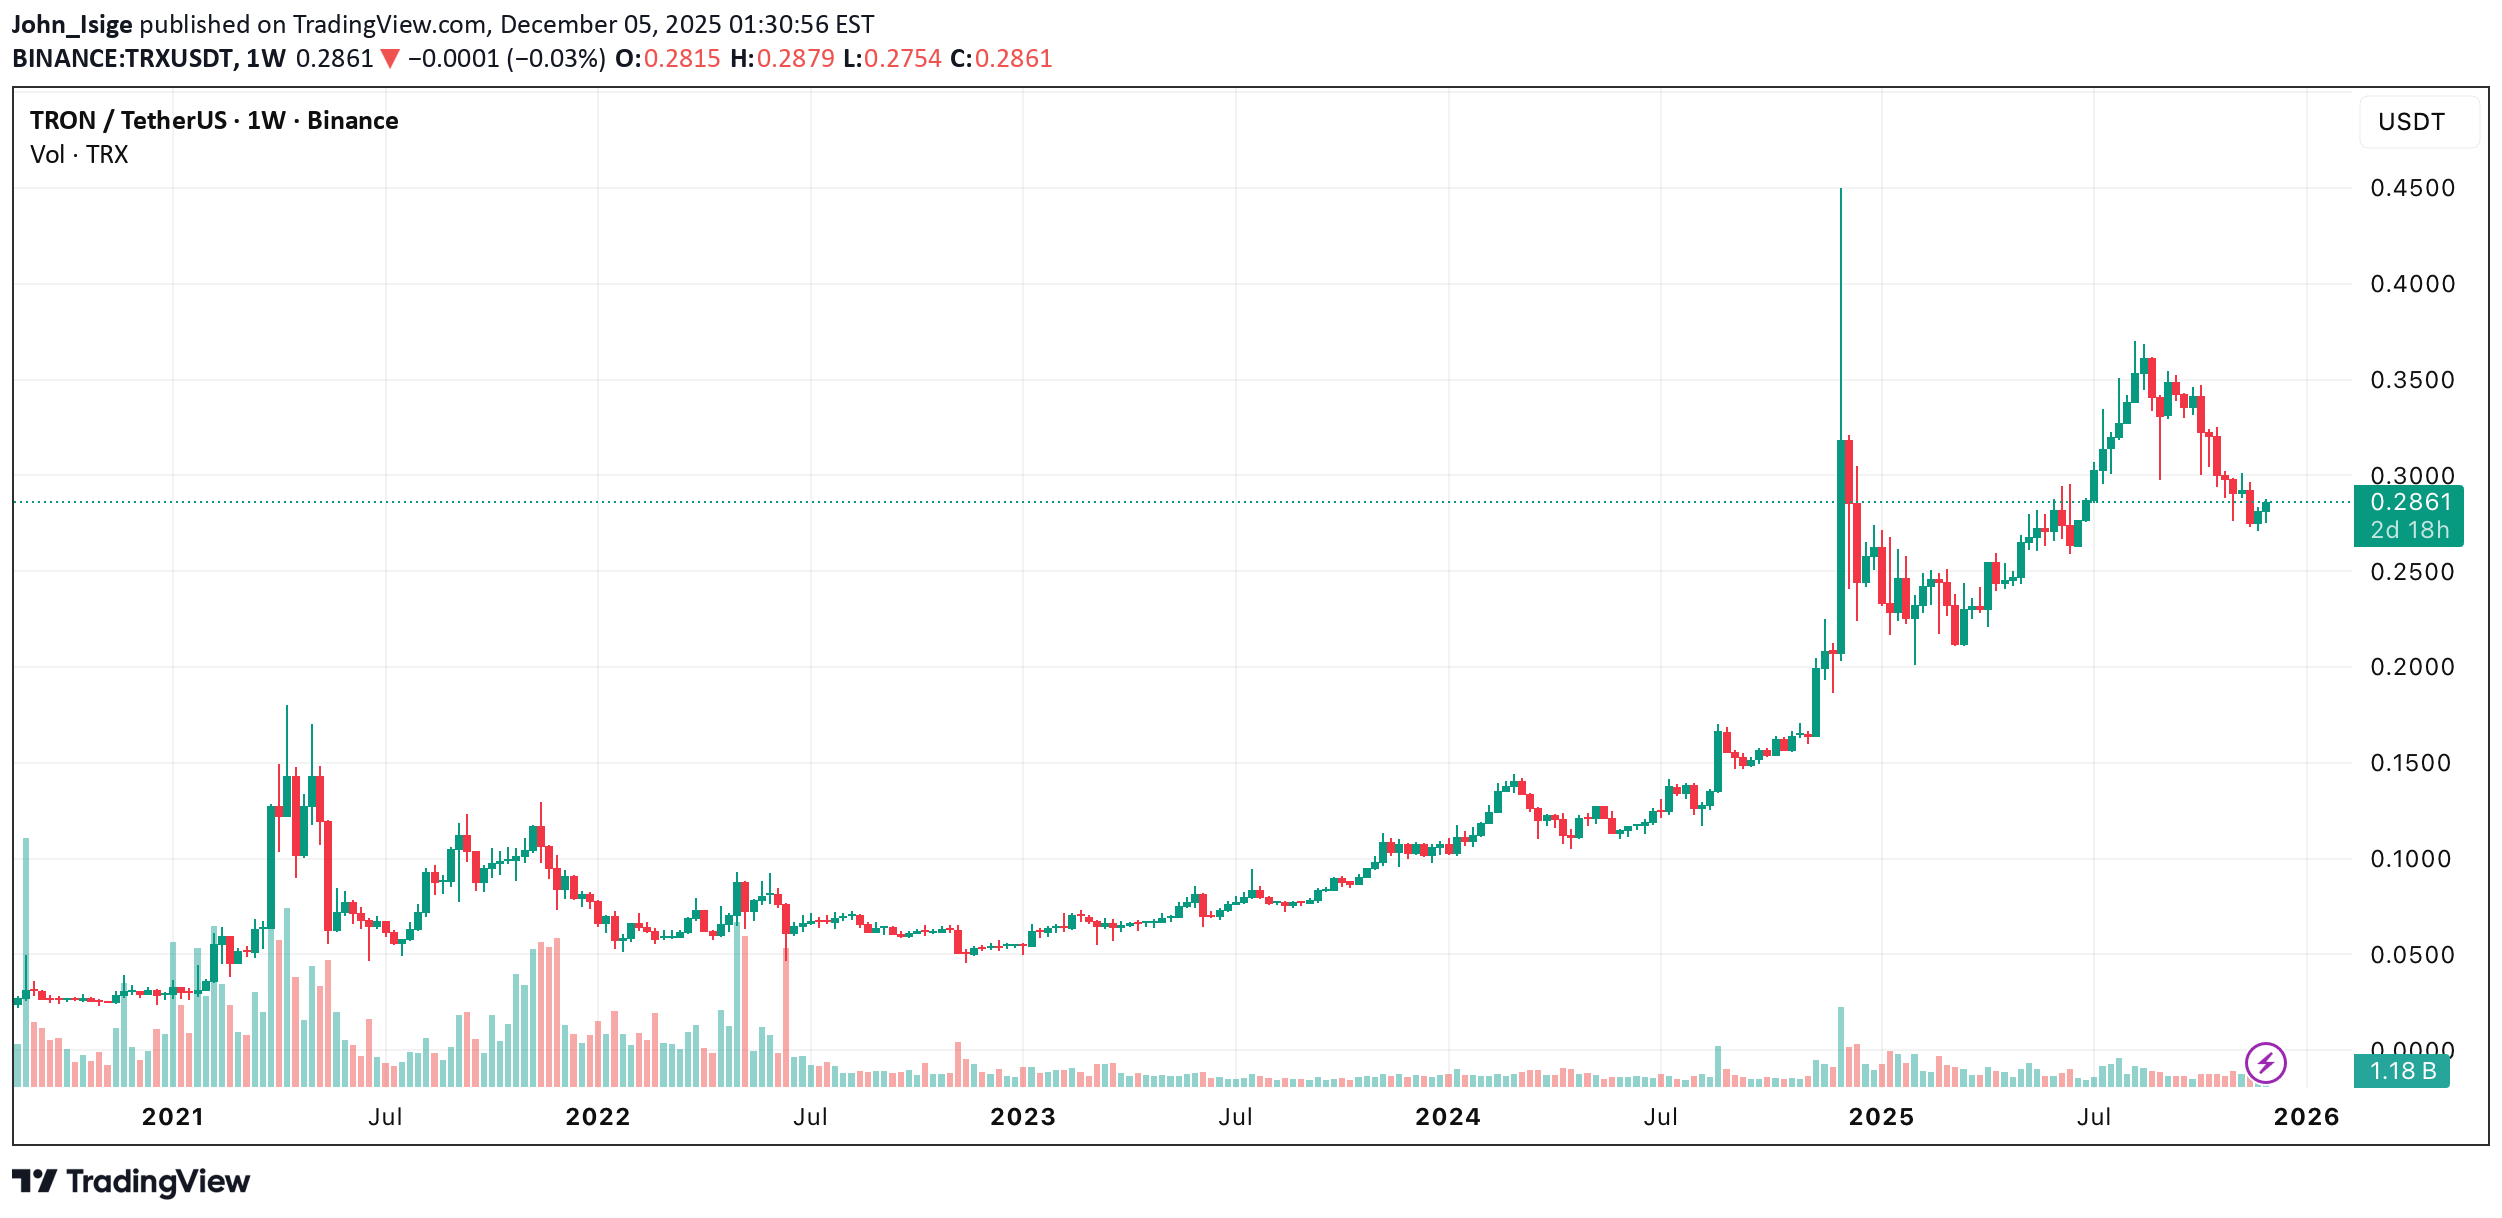
TRX/USD has been under pressure since August, losing up to 26%, yet compared to other L1 assets the decline remains relatively mild. Over the past weeks, the pair stabilized around 0.27, forming a minor rebound structure. The key question now: can TRX reclaim its trend, or is this just a relief bounce? ⸻ Market Structure Price reacted to the 0.272 support zone again, while on-chain metrics show improving fundamentals: • Total Tron accounts exceed 350M • Perp DEX volume on Tron surged 271% in November • Stablecoin market cap on Tron reached $80B, near ATH TRX remains the dominant network for USDT flows — an upside catalyst if risk appetite returns. A confirmed trend reversal requires a breakout above the 20-day EMA, followed by a push toward 0.289 (Supertrend resistance). Failure to hold 0.277 risks another retest of 0.272. ⸻ Bullish Levels 0.289 • 0.293–0.298 • 0.305 • 0.319–0.326 • 0.334 • 0.354–0.362 • 0.369 A break of 0.293–0.298 is the key to unlocking bullish momentum — this zone clusters the 50 EMA, 38.2% Fib, and 200 EMA. Above it, the next pivot is 0.319–0.326, followed by 0.334, and the Golden Pocket at 0.354–0.362, which is the maximum realistic upside in the coming weeks unless macro conditions flip risk-on. ⸻ Bearish Levels 0.278–0.271 • 0.261–0.258 • 0.240 • 0.225–0.212 Below the 20 EMA, downside pressure persists. A break below 0.271 would reopen a slide toward 0.258 (23.6% Fib). Further bearish momentum targets 0.240, and then the macro support 0.225–0.212, which held from January–April 2025. Given Tron’s relative strength, a return to yearly lows remains unlikely unless Bitcoin makes fresh cycle lows. ⸻ Indicators • Daily RSI: bullish divergence — supporting recovery • Weekly RSI: recently flashed a sell signal, invalidated only above the 20-day EMA • Monthly RSI: cooling off but still holding above neutral — long-term structure remains intact ⸻ Bias: Neutral → Bullish above 0.293; Bearish below 0.277 Critical Reversal Zone: 0.293–0.298 Key Support: 0.272 Breakout Target: 0.319–0.326 and 0.354–0.362 Breakdown Target: 0.258 and 0.240
John_Isige
ETH/USD — Downtrend Extends as Price Tests Key Support Zone
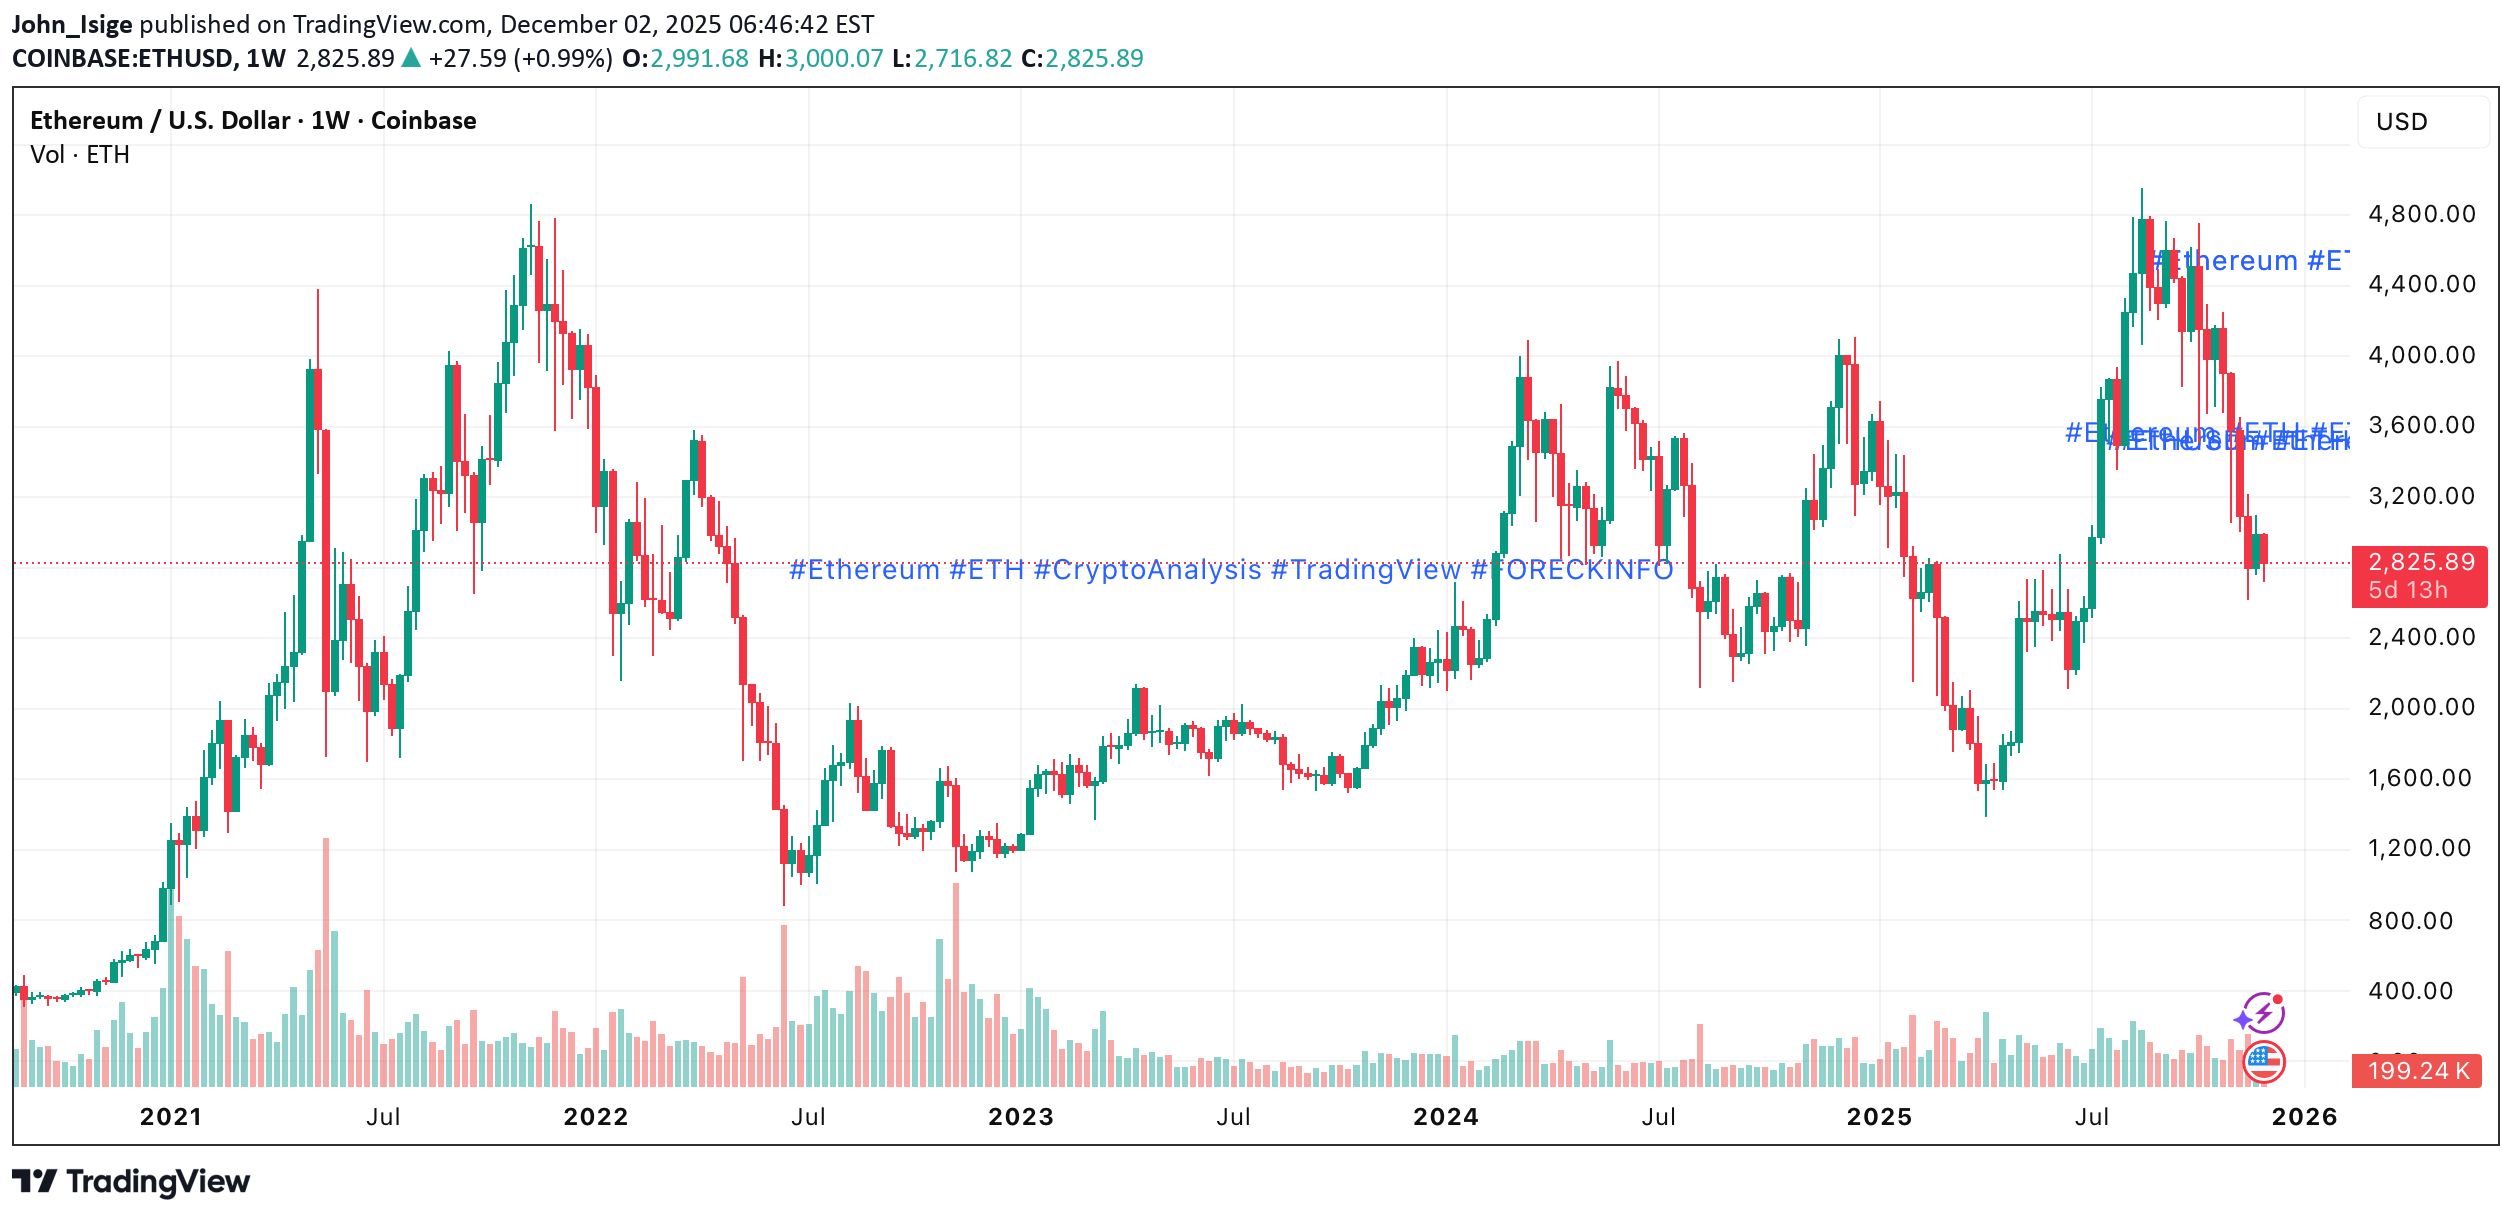
ETH/USD remains in a medium-term downward trend, correcting against the long-term structure. The pair has broken below the descending channel and is now testing the support area at 2812.50–2720.00 (Murray [1/8], 61.8% Fib). A firm daily/weekly close below 2720.00 would confirm downside continuation toward: • 2187.50 (Murray [–1/8]) • 1875.00 (Murray [–2/8]) A reversal scenario becomes valid only if ETH reclaims the 3437.50–3540.00 resistance zone (Murray [3/8], 38.2% Fib, upper Bollinger Band). A breakout above this area would open targets at: • 4062.50 (23.6% Fib, Murray [5/8]) • 4687.50 (Murray [7/8]) • 5000.00 (Murray [8/8]) Indicators: Bollinger Bands are sloping downward, MACD stays negative, and Stochastic is turning lower. On the weekly chart, price has reached the lower Bollinger Band, increasing the probability of another leg down. ⸻ Key Levels Resistance: 3540 • 4062.50 • 4687.50 • 5000 Support: 2720 • 2187.50 • 1875 ⸻ TradingView Scenarios Primary Scenario — SELL STOP • Entry: 2700 • TP: 2187.50 / 1875 • SL: 3100 • Bias: Bearish below 2720 • Timeframe: Weekly Alternative Scenario — BUY STOP • Entry: 3570 • TP: 4062.50 / 4687.50 / 5000 • SL: 3240 • Bias: Bullish above 3540
John_Isige
ZEC/USD – TradingView Script-Style Summary
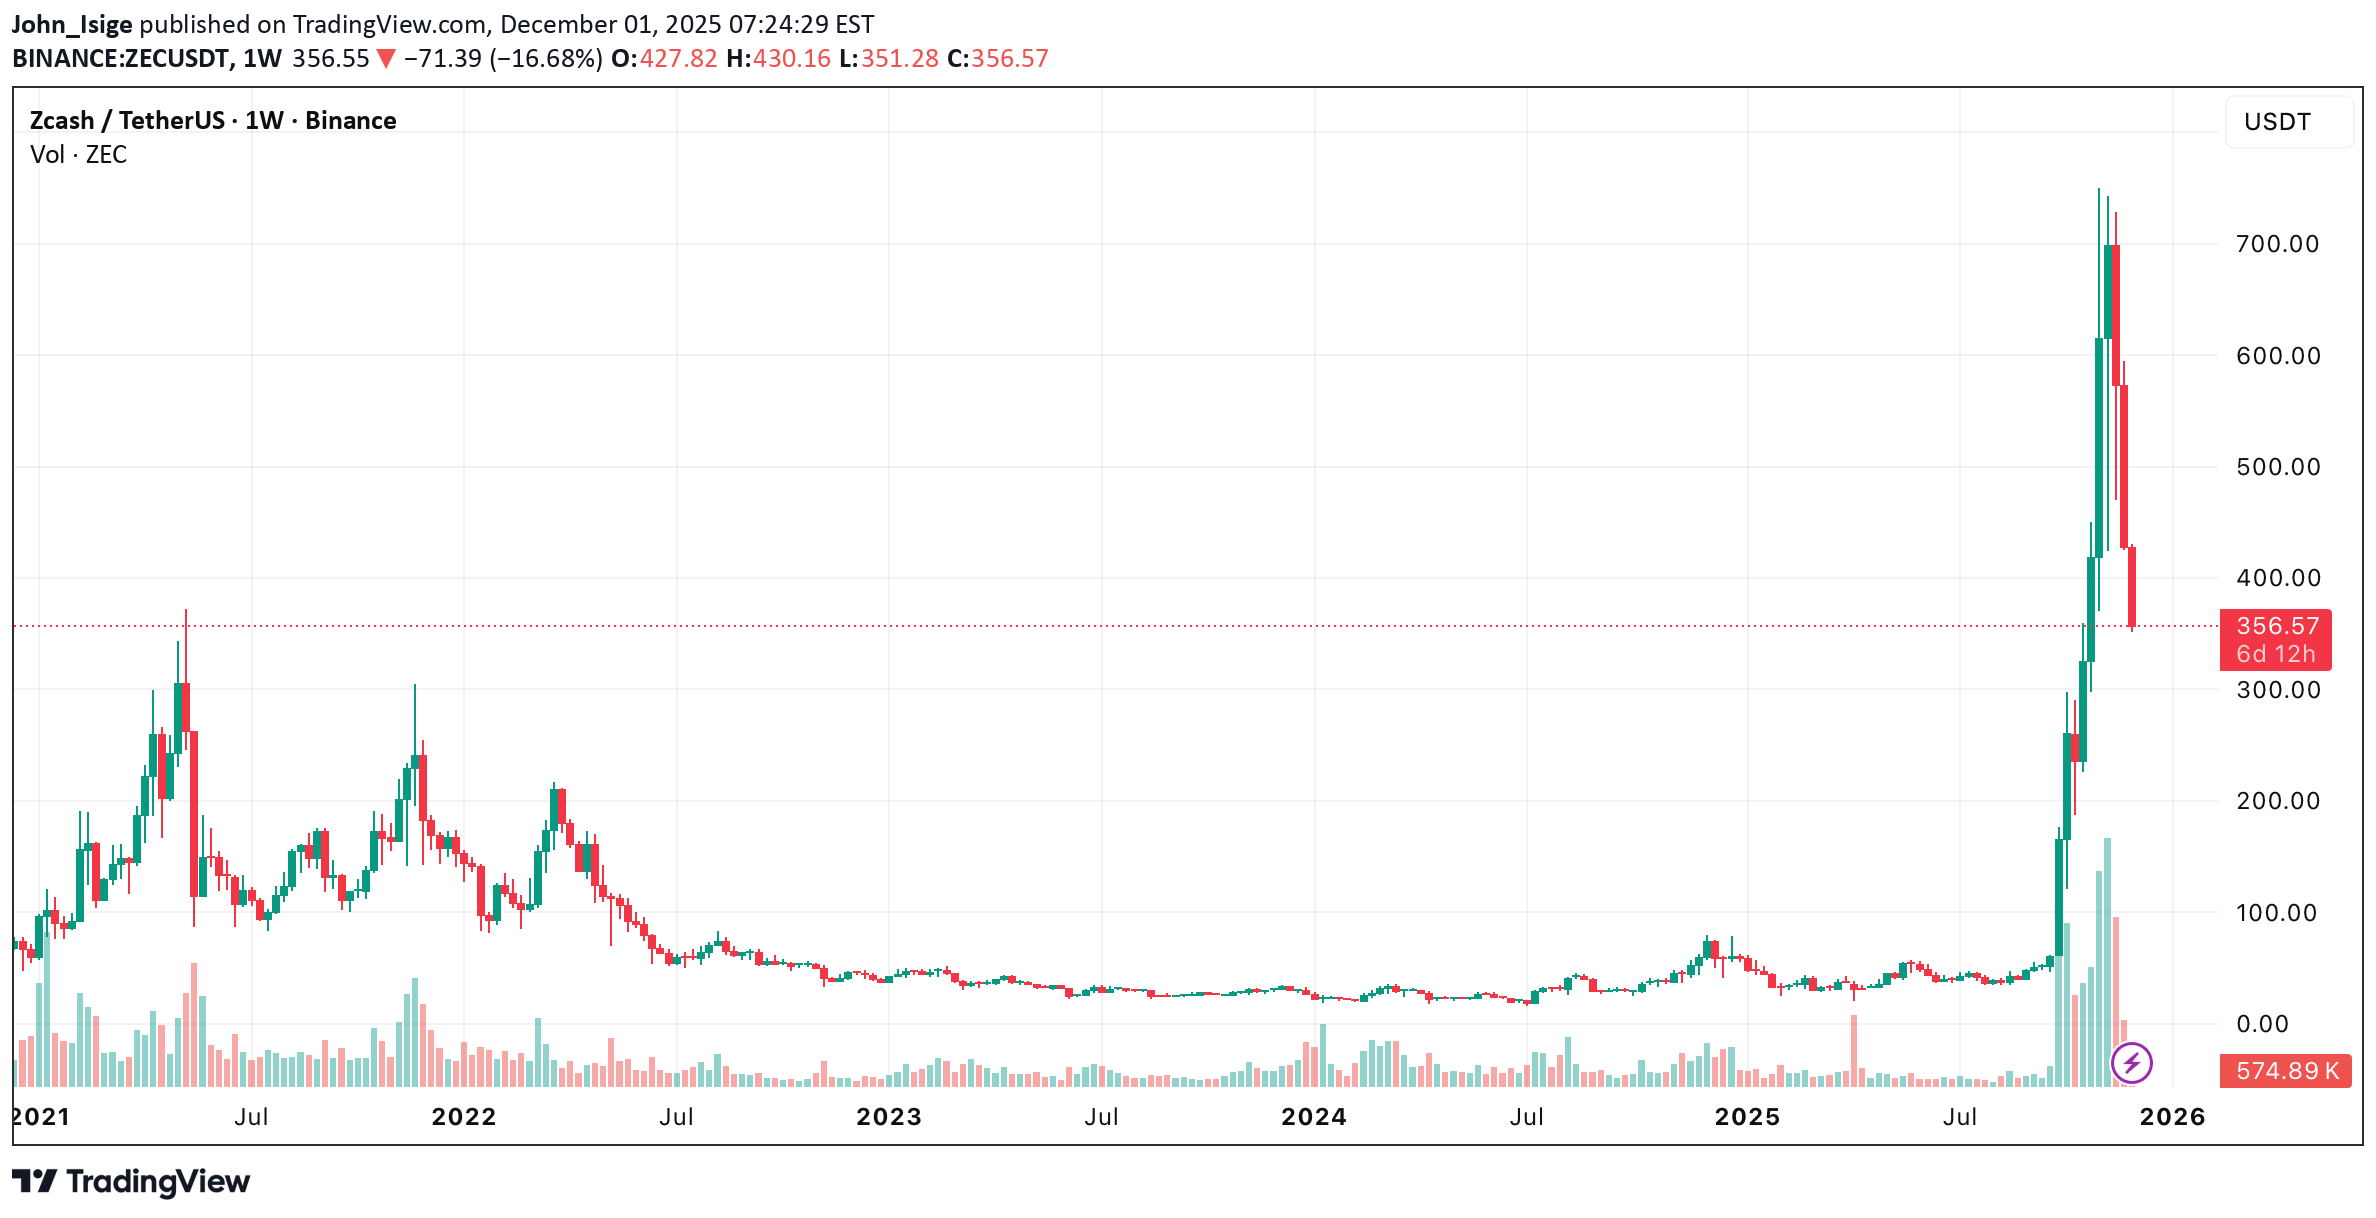
// ZEC/USD – Market Summary // Trend: Bearish below 20-day EMA // Volatility: Elevated // Bias: Neutral → Bearish // STRUCTURE Price remains below EMA20 (437.28), forming lower highs + lower lows. Momentum weak (RSI ~36), MACD negative but stabilizing. Bollinger Band width ~138.51 → high volatility. // KEY LEVELS Support 1: 351.28 (daily low) Support 2: 320.00 (psychological) Support 3: 220–330 (selloff zone) Resistance 1: 430.16 (swing high) Resistance 2: 437.28 (EMA20) Resistance 3: 512.37 (upper BB) Fib Target: 577.90 (61.8% retracement) // BULLISH TRIGGER Daily close > 437.28 (EMA20) + rising volume → Targets: 500–600 range → RSI > 50 required for confirmation // BEARISH TRIGGER Break < 351.28 (daily low) → Targets: 320 → 260 → 220 → RSI drop < 30 increases downside momentum // NEUTRAL ZONE 351.28–430.16 Trend consolidation unless EMA20 is reclaimed. // BIAS Bearish until EMA20 is reclaimed on strong daily close.
John_Isige
BTC/USD: Rebound Fades as Liquidations Spike and Macro Pressure
Last week, BTC/USD attempted a corrective bounce within the broader medium-term downtrend. After reversing near 80,600, the price moved toward 91,000 as markets sharply increased expectations of a December Fed rate cut. Dovish comments from Fed officials, softer wholesale inflation (2.9% → 2.6%), and slowing retail sales (0.6% → 0.2%) pushed the FedWatch probability of a cut from 30% to 87%, boosting demand for non-dollar assets. However, the rebound was short-lived. BTC failed to hold above 91,000 and resumed its decline, now trading near 86,500, down more than 5% intraday. Analysts point to technical triggers behind the sell-off: the liquidation of several large long positions cascaded across the market, reaching a total of $646M, with ~90% longs washed out. Additional pressure came from: • Yearn Finance hack (~$9M stolen, incl. 1,000 ETH moved via Tornado Cash) • China reaffirming a full nationwide ban on crypto trading, stating digital assets have no legal-tender status and cannot be used in commerce These events fueled risk-off sentiment across the market. ⸻ Support and Resistance Levels BTC reversed from the middle Bollinger Band near 91,000 and is now attempting to consolidate below 87,500 (Murray [2/8]). A firm breakdown below 87,500 would target: • 81,250 (Murray [1/8]) • 75,000 (Murray [0/8]) A bullish reversal requires a breakout above 93,750 (Murray [3/8], 61.8% Fib), which would open the way toward: • 100,000 (Murray [4/8], 50% Fib) • 106,250 (Murray [5/8]) Indicators remain aligned with the downtrend: • Bollinger Bands slope downward • Stochastic points lower • MACD stays negative Resistance: 93,750 • 100,000 • 106,250 Support: 87,500 • 81,250 • 75,000 ⸻ BTC/USD Trading Scenarios 📉 Primary Scenario — SELL STOP • Entry: 85,800 • Take Profit: 81,250 • 75,000 • Stop Loss: 89,100 • Timeframe: Weekly • Bias: Bearish continuation below 87,500 📈 Alternative Scenario — BUY STOP • Entry: 93,800 • Take Profit: 100,000 • 106,250 • Stop Loss: 88,400 • Bias: Breakout above resistance
John_Isige
ETH/USD: Bearish Momentum Persists as Price Tests Key Support Le
The ETH/USD pair continues to extend its medium-term downtrend as it retraces toward the long-term bullish structure. Last week, the price broke below the descending channel, reaching the July lows near 2620.00. Although Ethereum has recovered part of the decline, the overall trend remains bearish — confirmed by: • Bollinger Bands turning downward • MACD stabilizing in negative territory A meaningful bullish reversal will only become possible if ETH breaks above the 3437.50–3540.00 resistance cluster (Murray [3/8], 38.2% Fibonacci). A breakout would open the way toward: • 4062.50 — Fib 23.6%, Murray [5/8] • 4687.50 — Murray [7/8] • 5000.00 — Murray [8/8] On the downside, the key support area for bears is 2812.50–2720.00 (Murray [1/8], Fib 61.8%). A confirmed move below this zone increases the probability of a deeper decline toward: • 2187.50 — Murray [–1/8] • 1875.00 — Murray [–2/8] On the weekly timeframe, the price is pressing against the lower Bollinger Band, which is flattening — allowing for a corrective bounce but still favoring the continuation of the downtrend. ⸻ Support and Resistance Resistance: 3540.00, 4062.50, 4687.50, 5000.00 Support: 2720.00, 2187.50, 1875.00 ⸻ ETH Trading Scenarios 📉 Primary Scenario — SELL STOP • Entry: 2700.00 • Take Profit: 2187.50, 1875.00 • Stop Loss: 3100.00 • Timeframe: Weekly • Bias: Bearish continuation below key support 📈 Alternative Scenario — BUY STOP • Entry: 3570.00 • Take Profit: 4062.50, 4687.50, 5000.00 • Stop Loss: 3240.00 • Bias: Bullish reversal above major resistance
John_Isige
STRK/USD — Bulls Eye Breakout Above 0.2467: What Comes Next
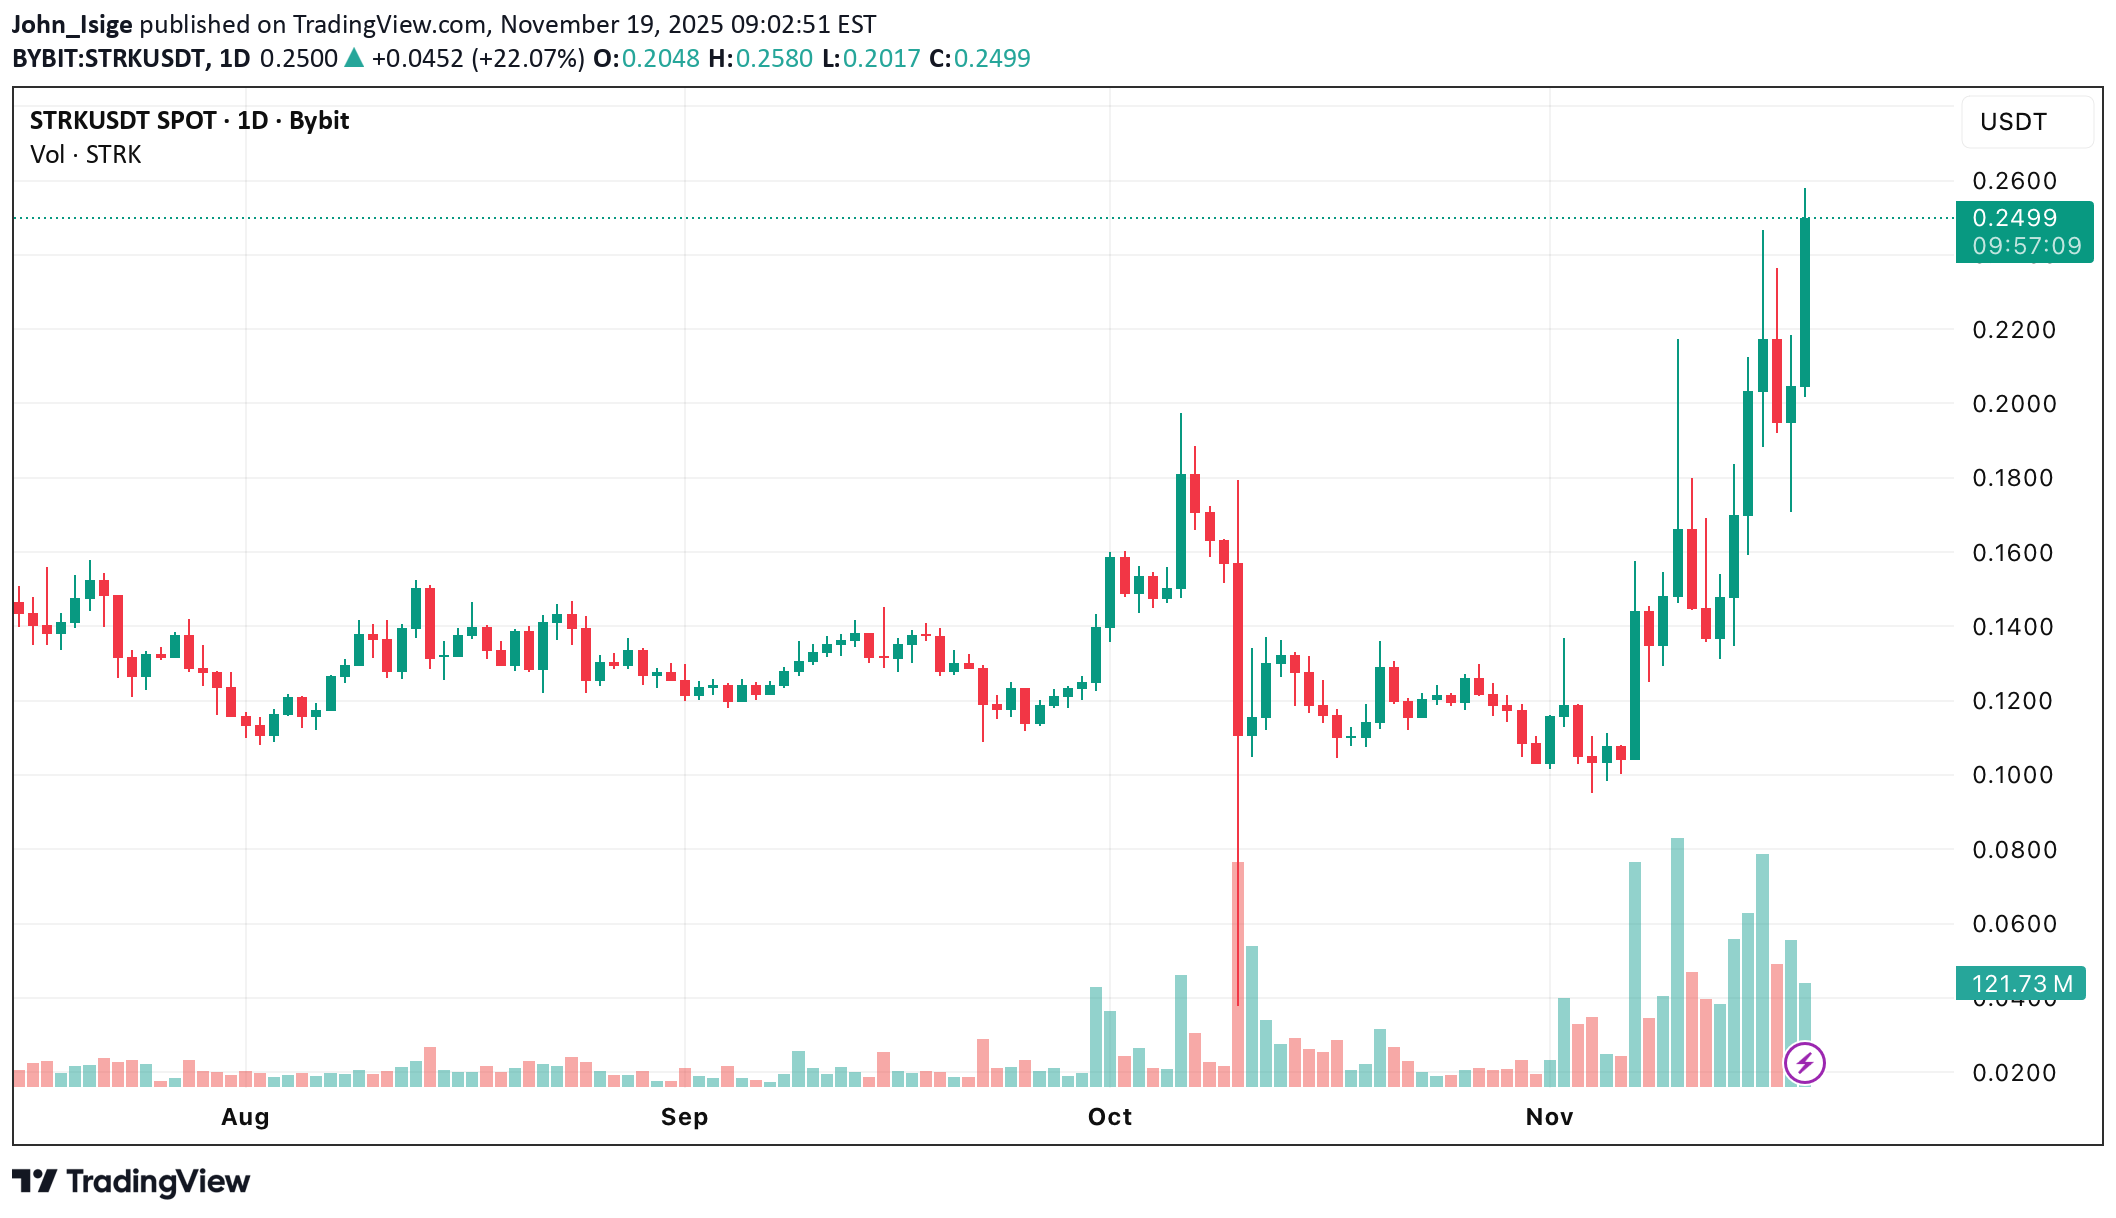
Starknet (STRK) continues its strong rebound after broad market sell-offs, maintaining a clean short-term uptrend. Price action remains constructive, holding firmly above the 20-day EMA (0.2074) and forming higher highs and higher lows — a classic bullish structure. Over the past 24 hours, STRK traded between 0.2321–0.2459, with the latest close at 0.2417, well above yesterday’s 0.1911. Rising volume supports the move, while market cap is now $1.09B. Key Technical Signals • Price above 20-EMA → trend intact • RSI (61) → bullish momentum without overbought stress • Momentum histogram → strengthening positive impulse • Bollinger width at 0.064 → volatility rising but controlled Immediate resistance sits at 0.2393–0.2467, and this zone is the key trigger for the next trend leg. ⸻ Scenario Outlook (TradingView Style) 🔵 Neutral Scenario (40%) • Range: 0.205 – 0.260 • Trigger: RSI stays between 50–65, price consolidates above EMA-20 • Invalidation: 0.195 • Key Levels: • EMA-20 at 0.2074 • Upper Bollinger at 0.2440 • Fibonacci support at 0.1560 Neutral bias holds as long as STRK respects 0.2074 and volatility remains stable (<150M volume). ⸻ 🟢 Bullish Scenario (35%) • Target: 0.247 – 0.350 • Trigger: • Breakout above 0.2467 • Daily candle closes above key resistance • Volume >150M • RSI pushes above 70 • Invalidation: 0.20 • Long-term reference: ATH at 4.41 USD A clean break of 0.2467 could ignite momentum toward 0.30–0.35. ⸻ 🔴 Bearish Scenario (25%) • Target: 0.12 – 0.20 • Trigger: • Drop below EMA-20 (0.2074) • RSI dips under 50 • Breakdown below 0.1560 Fibonacci • Invalidation: 0.26 • Key Levels: • Lower Bollinger at 0.1796 • Fib support 0.1560 Below 0.195, pressure increases sharply and sellers regain control. ⸻ Short-Term Outlook The structure remains bullish above 0.2074, and a breakout above 0.2467 will likely attract new buyers and unlock upside toward 0.30–0.35. Below 0.195, the trend weakens and risk shifts toward 0.1560.
John_Isige
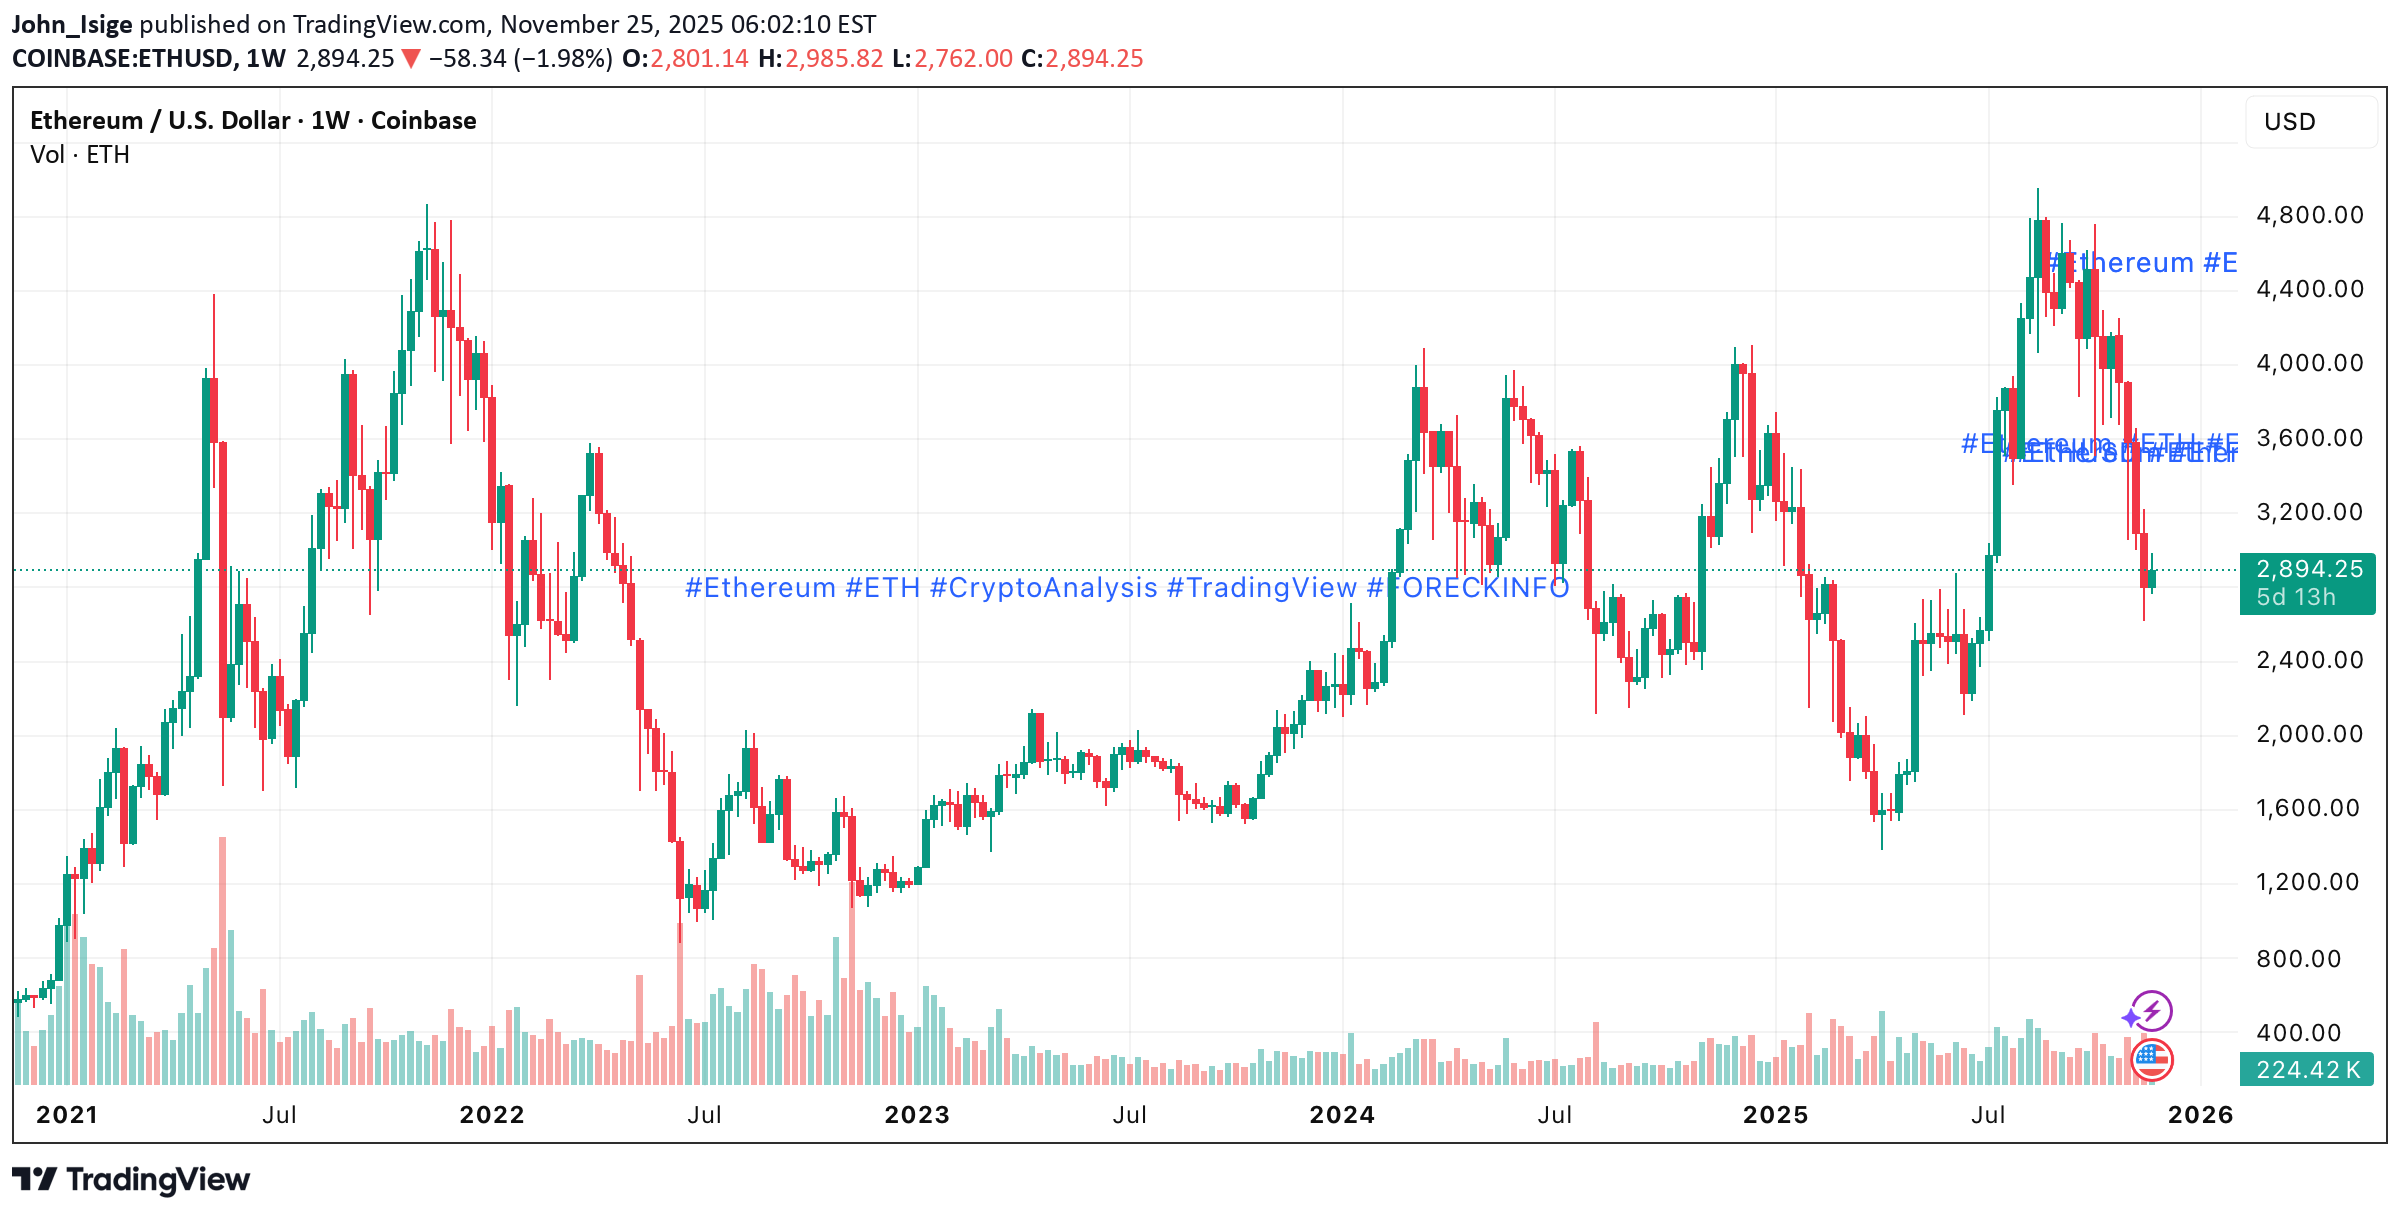
ETH/USD — Bearish Breakdown Toward 2,500
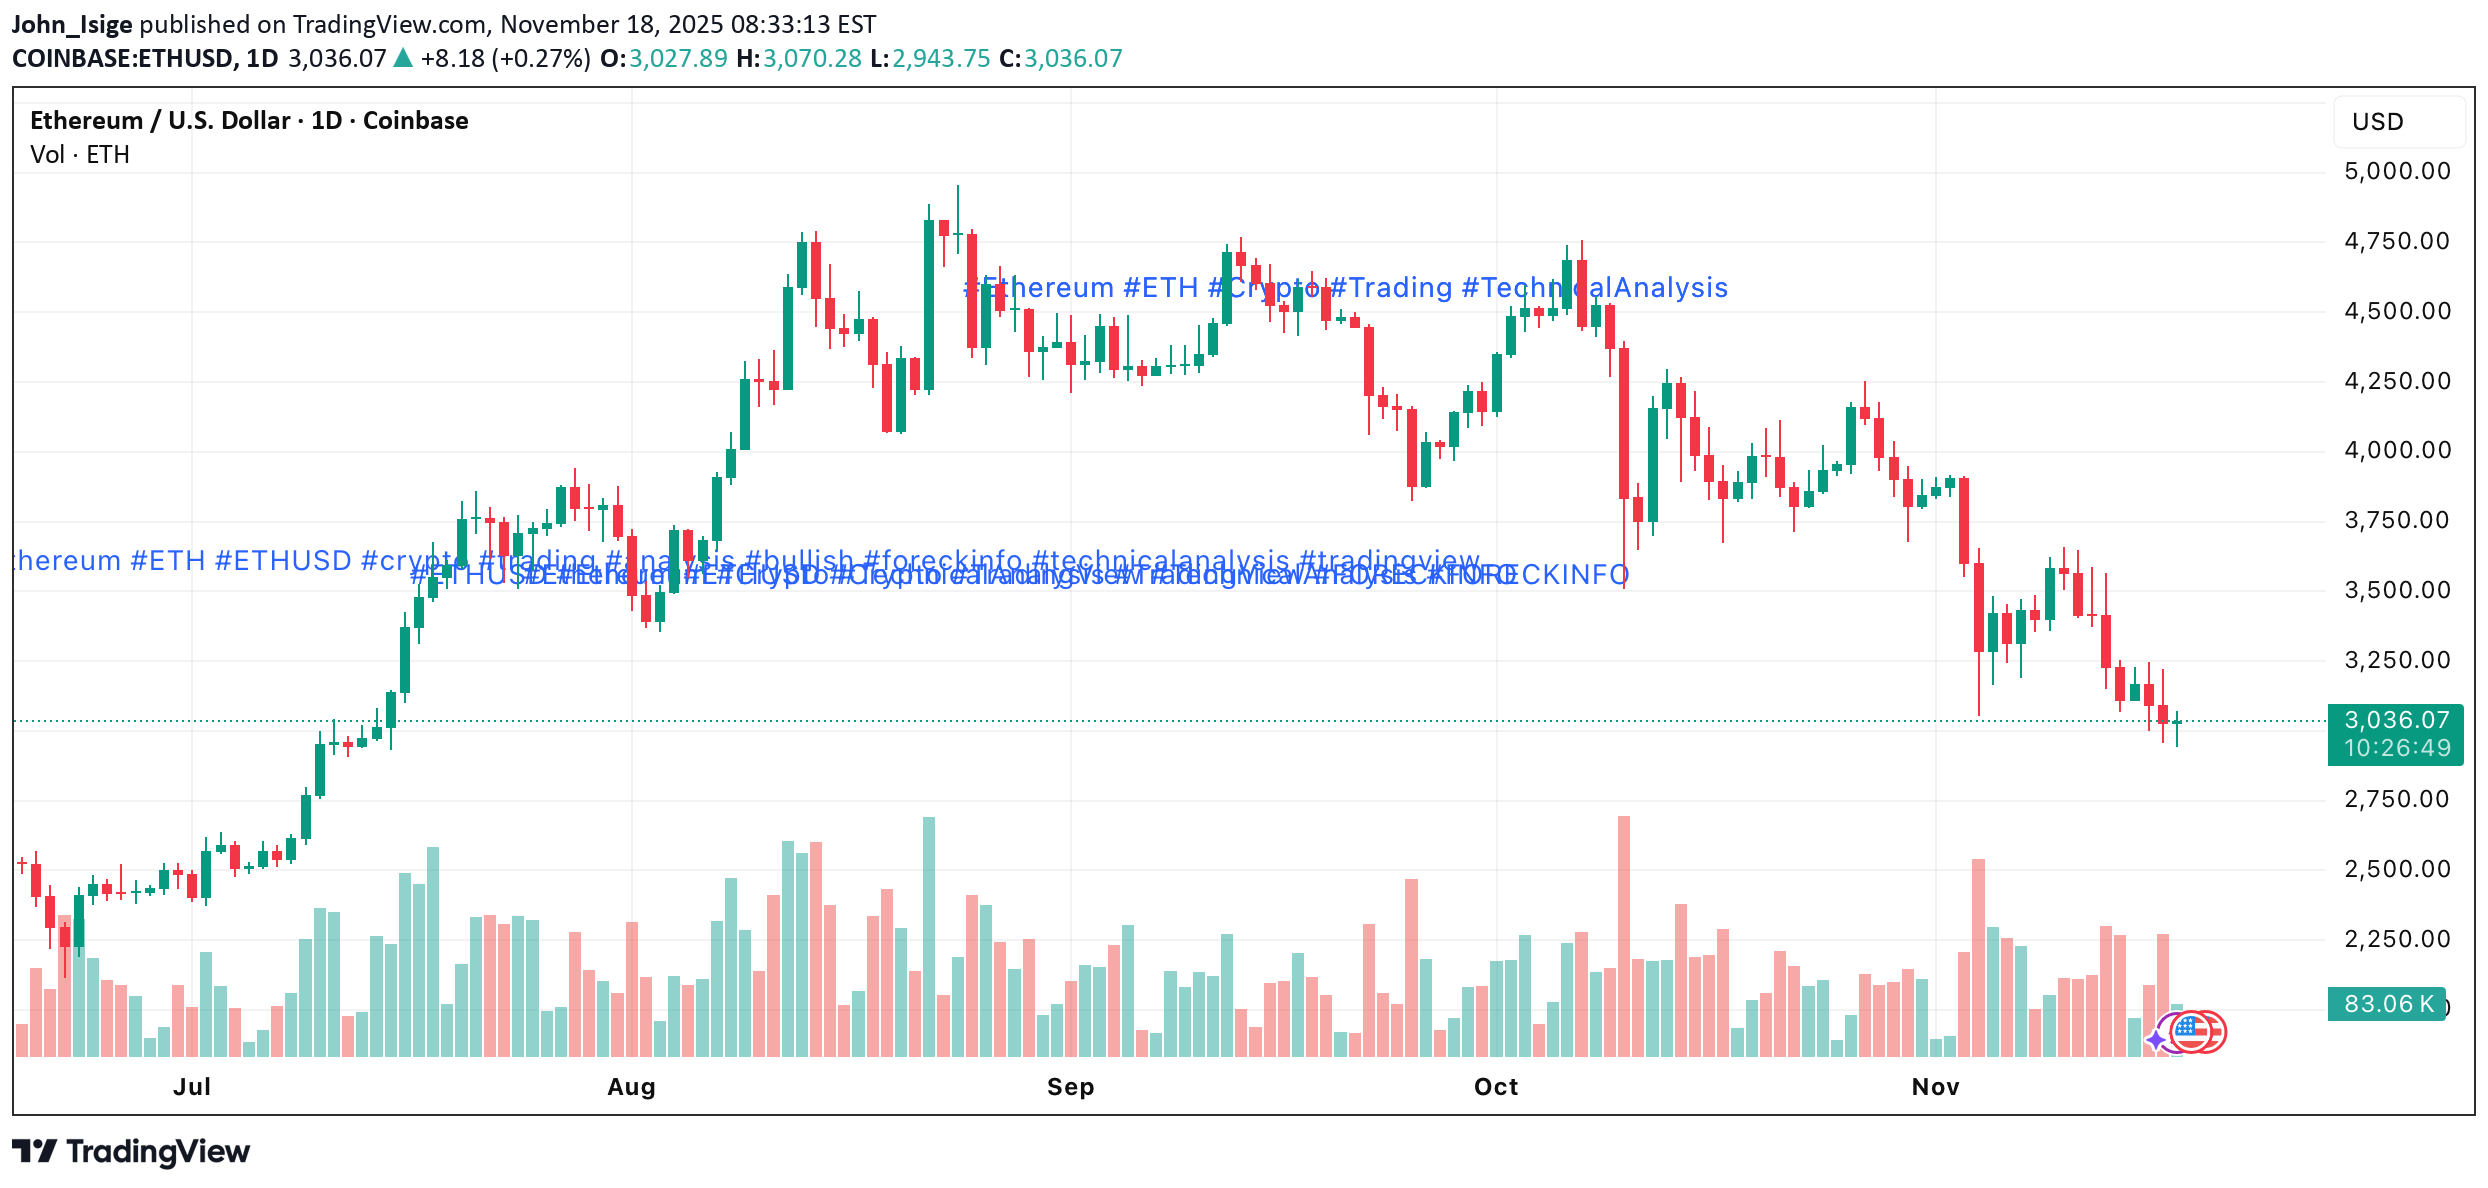
Ethereum extended its decline last week and broke below 3,125 (Murray [2/8]), updating the July low with a drop to 2,950. The market remains dominated by risk-off sentiment as the Fed signals the possibility of pausing rate cuts in December, geopolitical tension increases, and uncertainty around AI-driven tech investments grows. The Fear & Greed Index sits at 11 (extreme fear), while ETF outflows intensified: • ETH ETFs: –$1.4B (≈7% of AUM) • BTC ETFs: –4% On-chain activity also confirms weakening demand: ETH deposits fell 13% to a four-month low, and weekly DEX volume declined 27% to $17.4B. The fundamental backdrop continues to favor the bears. ⸻ Technical Setup ETH/USD broke below its descending channel and consolidated under 3,125, opening a clear path to deeper downside targets: Bearish Structure • Price trades below the mid-Bollinger band • Bollinger Bands point downward • MACD expands in the negative zone • Stochastic remains flat inside oversold conditions Unless ETH reclaims 3,750, the trend remains decisively bearish. ⸻ Key Levels Resistance: 3,750 · 4,375 · 5,000 Support: 3,125 · 2,500 · 2,187 ⸻ Trading Plan 🔻 Primary Scenario — SELL STOP • Entry: 2,960 • TP1: 2,500 • TP2: 2,187 • SL: 3,300 • Bias: bearish continuation • Timeframe: Weekly (5–7 days) 🔼 Alternative Scenario — BUY STOP • Entry: 3,770 • TP1: 4,375 • TP2: 5,000 • SL: 3,360 • Bias: reversal only above 3,750 ⸻ ETH remains in a strong downtrend after losing the 3,125 support zone. A move below 2,960 confirms continuation toward 2,500 → 2,187, while only a breakout above 3,750 would signal a potential trend reversal.
John_Isige
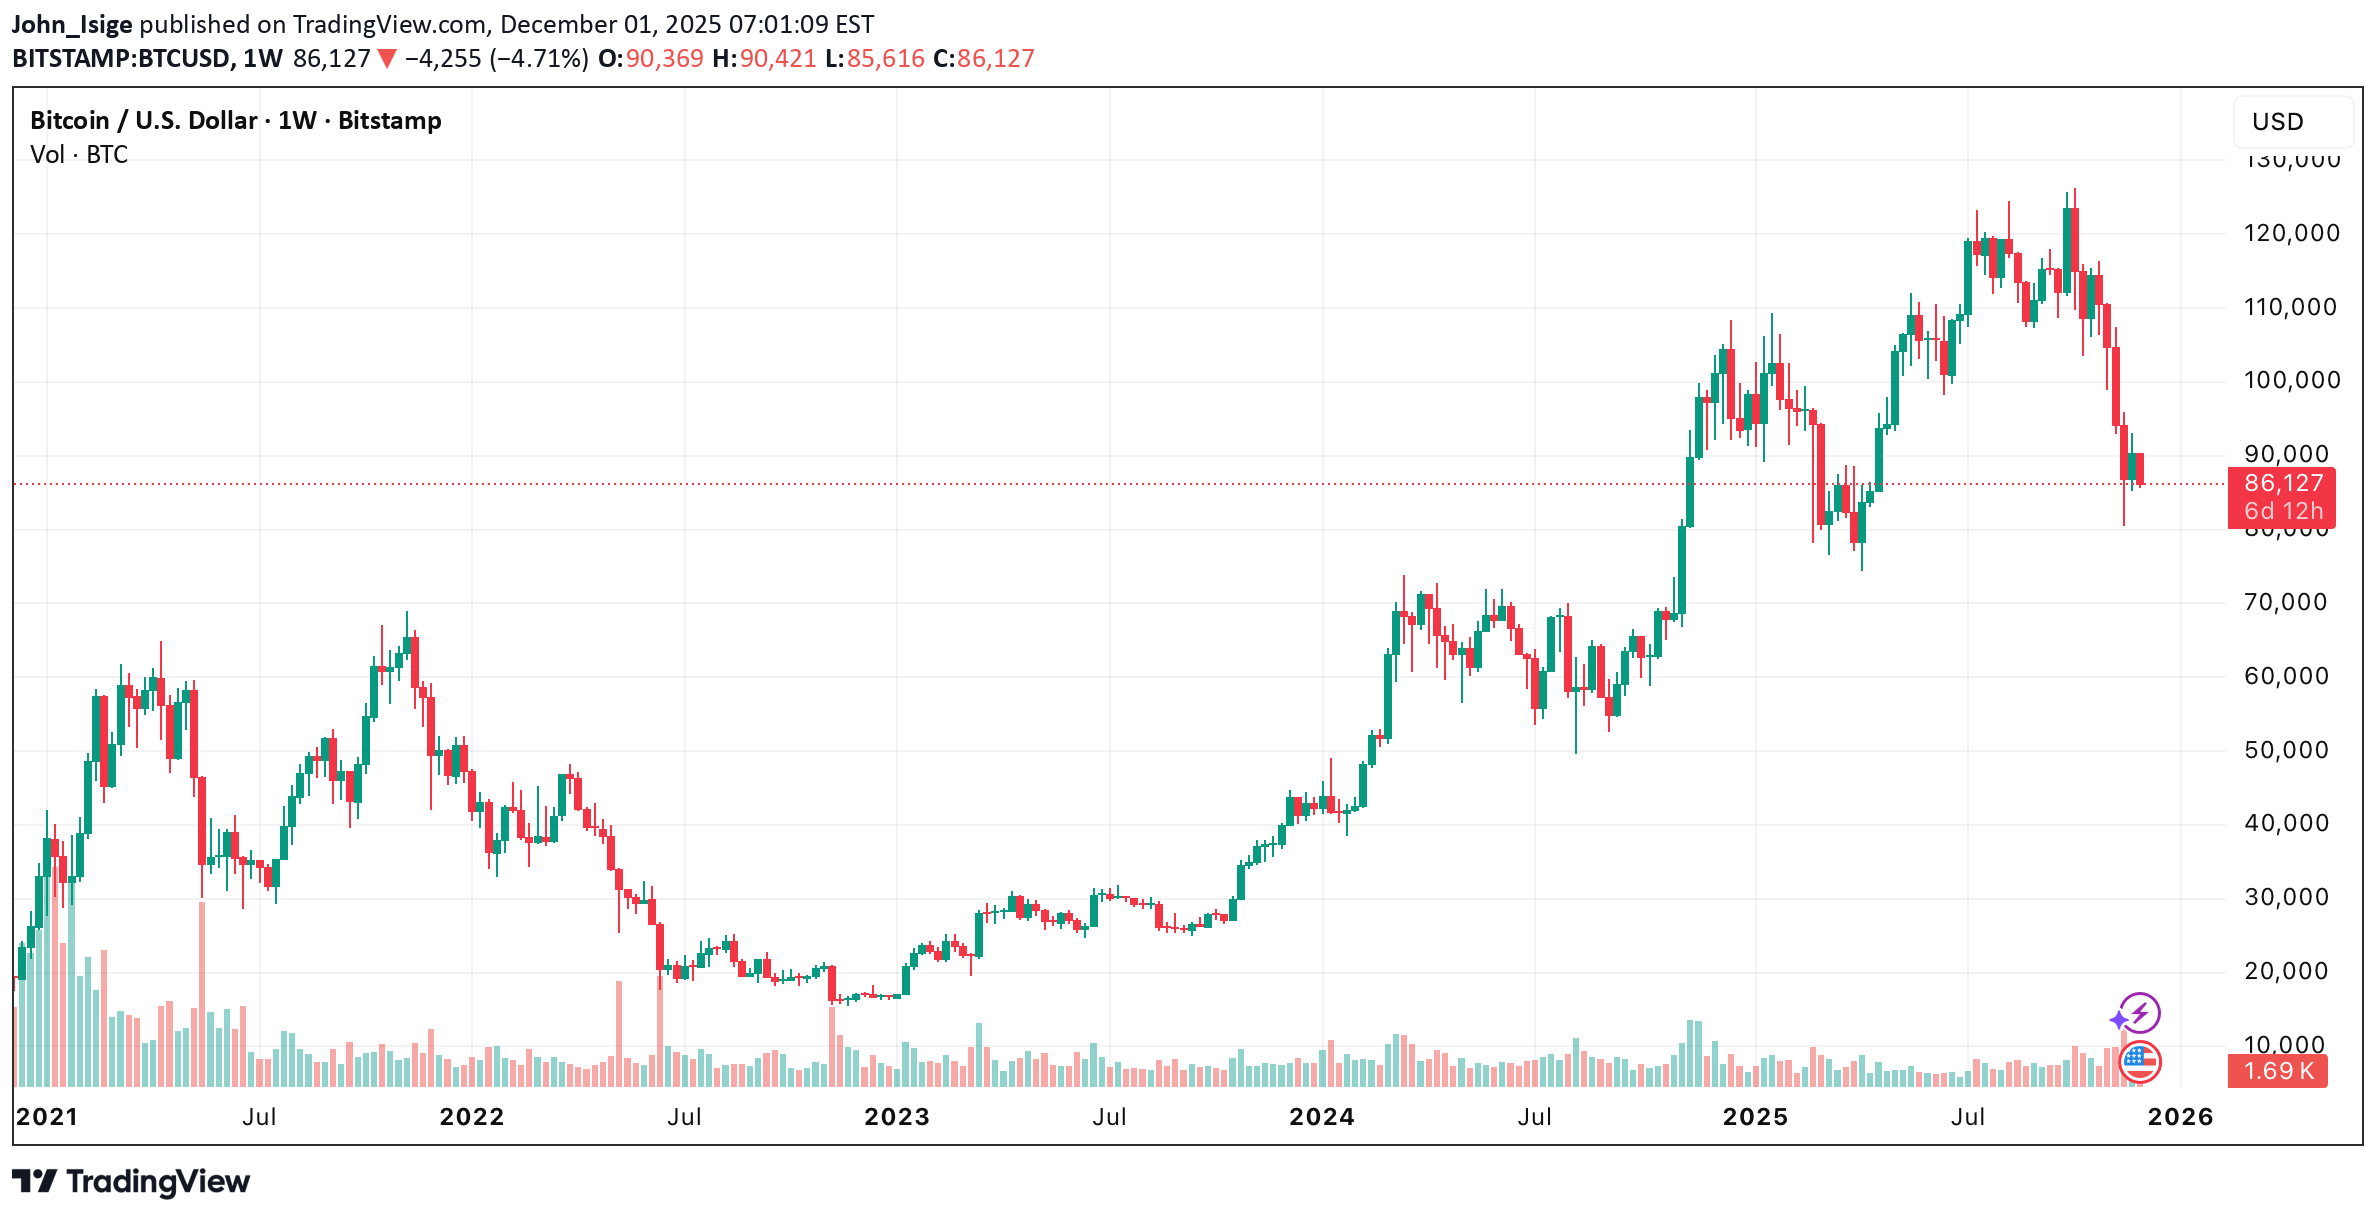
BTC/USD — Bitcoin Loses Almost All Yearly Gains as Downtrend Dee
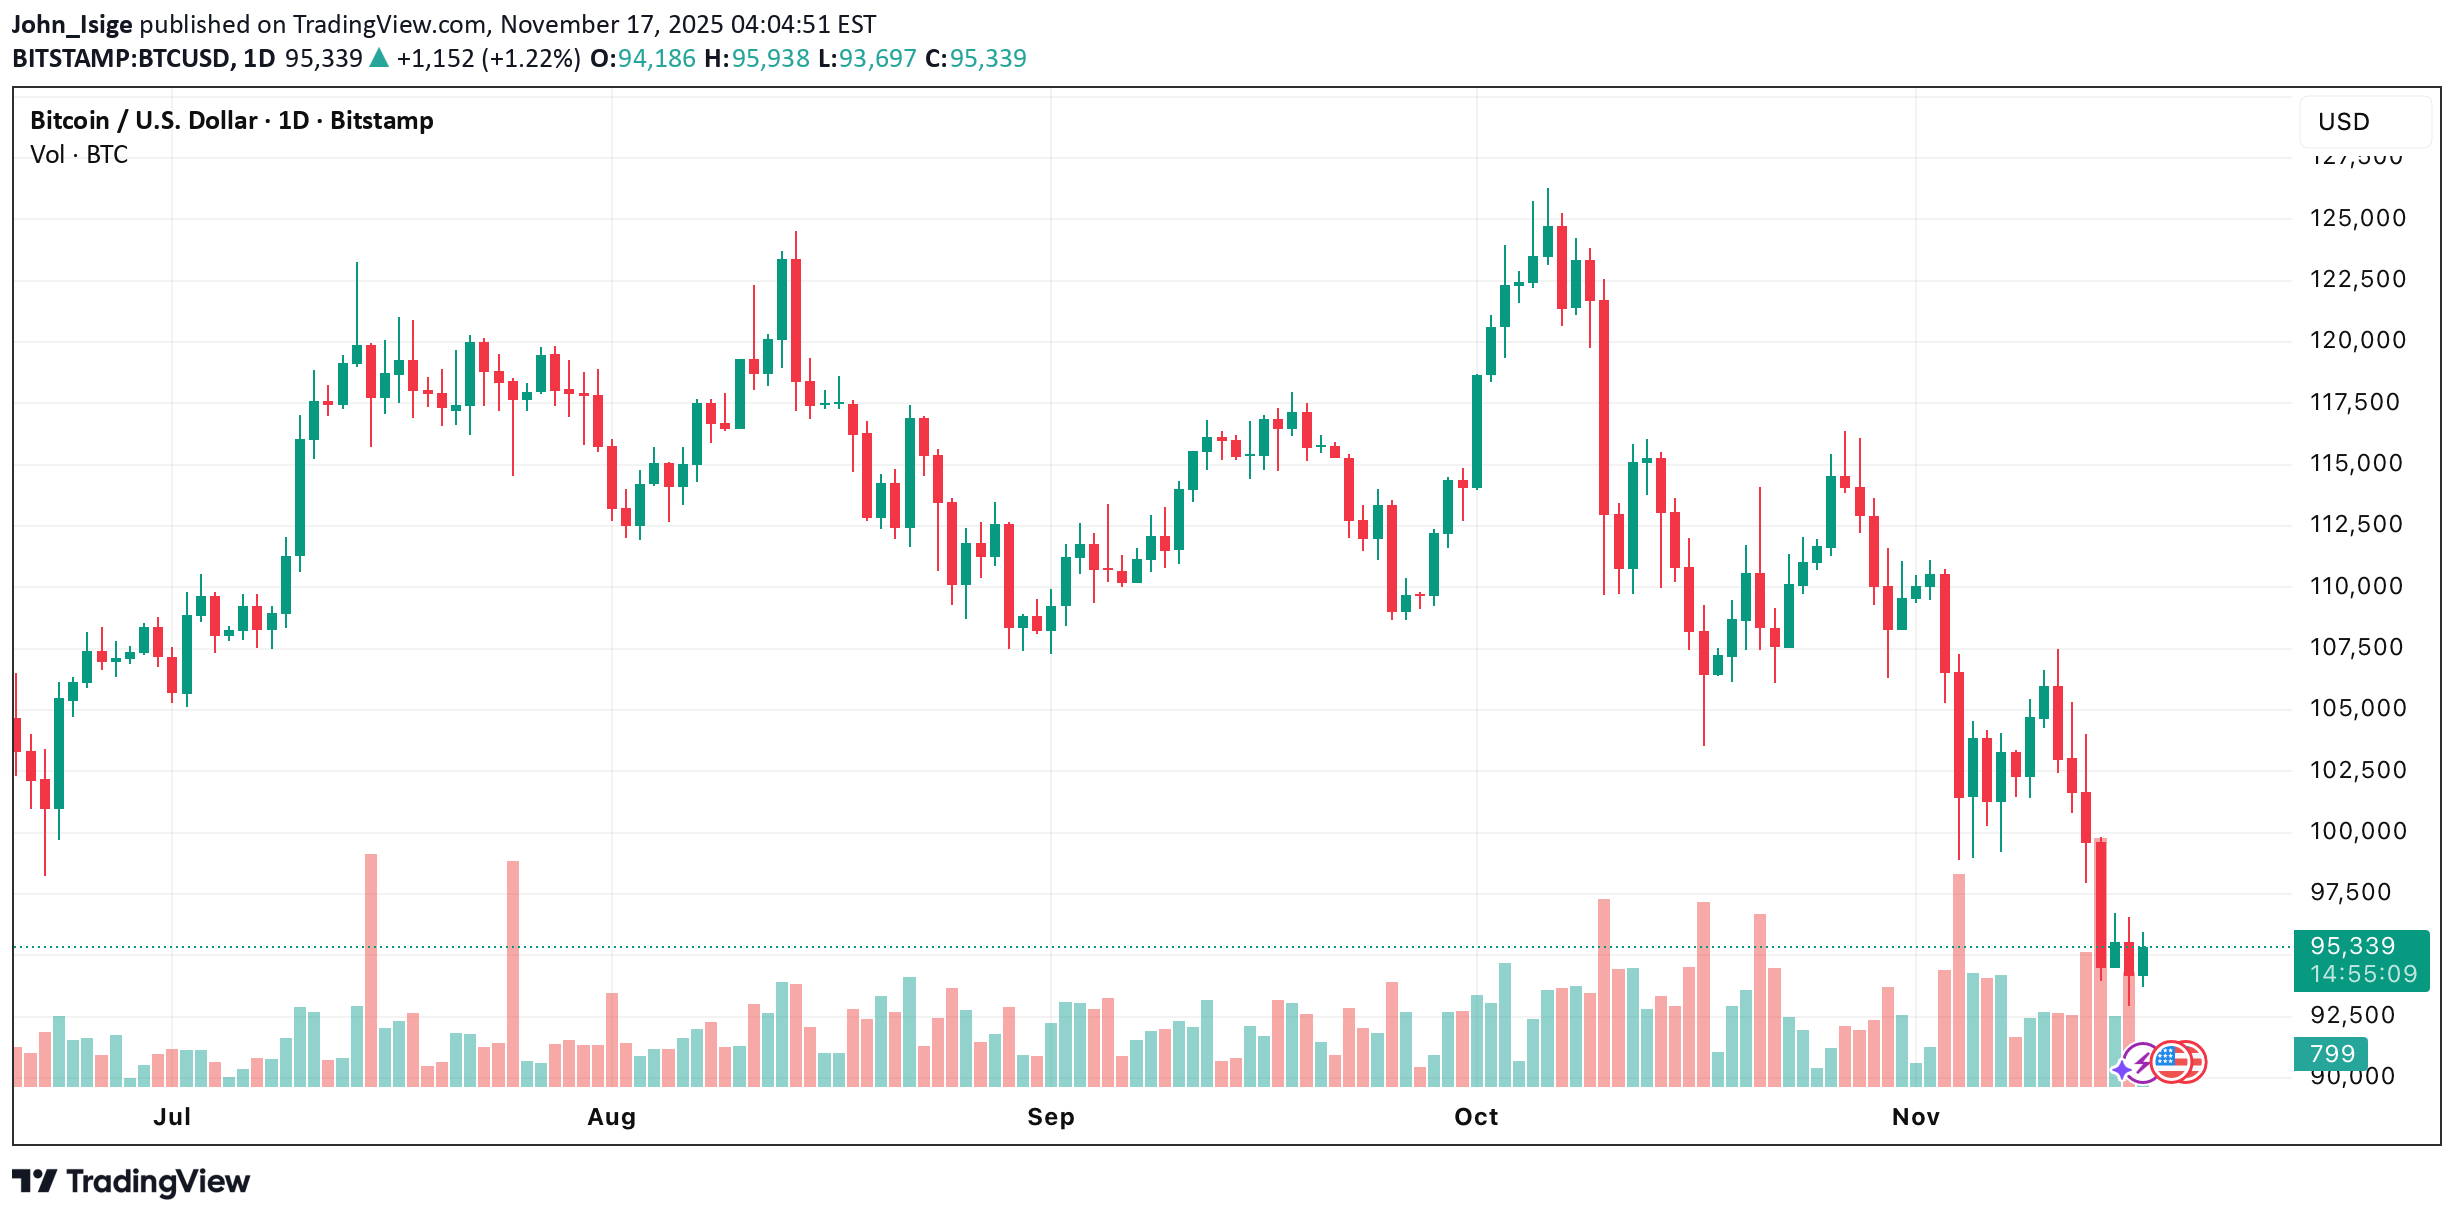
BTC/USD fell to 93,750 (Murray –1/8) last week, wiping out nearly all gains accumulated this year. The decline was driven by two major factors: 1. Fed pause risk grows — dollar strengthens The probability of a December rate cut has dropped to 49%, according to CME FedWatch. Even previously dovish members — such as Boston Fed’s Susan Collins — now support a pause to assess the impact of earlier cuts. A stronger USD continues to pressure risk assets, including Bitcoin. 2. Profit-taking from large investors After the post-election crypto rally driven by the crypto-friendly Trump administration, major holders began locking in profits. Fear & Greed Index: • 14 (“Extreme Fear”) now • 10 over the weekend ETF outflows: • –$1.636B from Bitcoin ETFs over the last 3 sessions → confirming sustained selling pressure. ⸻ Technical Picture BTC/USD is attempting to break below the descending channel, moving under its lower boundary. A confirmed breakdown below 93,750 (Murray –1/8) would accelerate the bearish trend. On the weekly timeframe, price has fallen below the 50-week MA, which previously acted as major dynamic support — increasing the probability of deeper declines. Indicators • Bollinger Bands: pointing downward → trend pressure remains bearish • MACD: expanding in the negative zone • Stochastic: exiting oversold, allowing a short-term bounce — but limited upside Overall, momentum remains strongly bearish. ⸻ Key Support & Resistance Levels Resistance • 100,000 • 106,250 • 112,500 Support • 93,750 • 87,500 • 81,250 ⸻ Trading Scenarios (Weekly) Base Scenario — SELL STOP Entry: 93,400 TP1: 87,500 TP2: 81,250 Stop-loss: 98,200 Bias: bearish continuation Horizon: 5–7 days ⸻ Alternative Scenario — BUY STOP Entry: 100,500 TP1: 106,250 TP2: 112,500 Stop-loss: 95,200 Bias: bullish reversal only above 100,000 ⸻ TradingView-Style Summary Bitcoin remains in a strong downtrend after losing dynamic weekly support and breaking near-critical levels. A move below 93,750 opens the way toward 87,500 → 81,250, while only a breakout above 100,000 would signal the first signs of recovery.
Disclaimer
Any content and materials included in Finbeet's website and official communication channels are a compilation of personal opinions and analyses and are not binding. They do not constitute any recommendation for buying, selling, entering or exiting the stock market and cryptocurrency market. Also, all news and analyses included in the website and channels are merely republished information from official and unofficial domestic and foreign sources, and it is obvious that users of the said content are responsible for following up and ensuring the authenticity and accuracy of the materials. Therefore, while disclaiming responsibility, it is declared that the responsibility for any decision-making, action, and potential profit and loss in the capital market and cryptocurrency market lies with the trader.