XRP
XRP
| Trader | Signal Type | Profit Price/Stop Loss Price | Publish Time | View Message |
|---|---|---|---|---|
 DEXWireNewsRank: 52 | BUY | Profit Price: Not specified Stop Loss Price: Not specified | 11/21/2025 | |
 FenzoFxBrokerRank: 267 | SELL | Profit Price: Not specified Stop Loss Price: Not specified | 11/20/2025 | |
 KooshiCryptoGemRank: 160 | BUY | Profit Price: Not specified Stop Loss Price: Not specified | 11/20/2025 | |
 isahebdadiRank: 807 | SELL | Profit Price: Not specified Stop Loss Price: Not specified | 4 hour ago | |
 MoonriseTARank: 1487 | SELL | Profit Price: Not specified Stop Loss Price: Not specified | 6 hour ago |
Price Chart of XRP
Profit 3 Months :
Signals of XRP
Filter
Sort messages by
Message Type
Trader Type
Time Frame

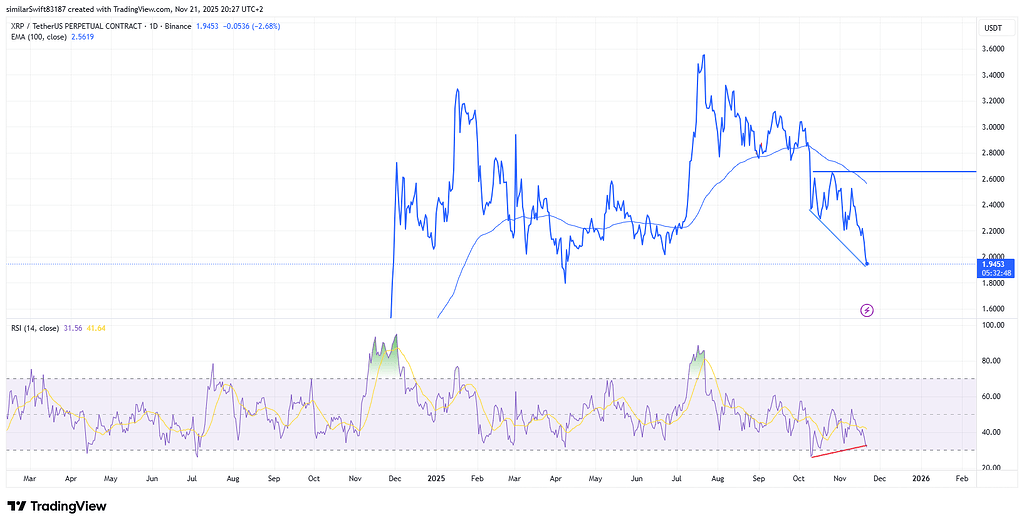
CryptoColugo
Before you panic - check out the patterns in the chart
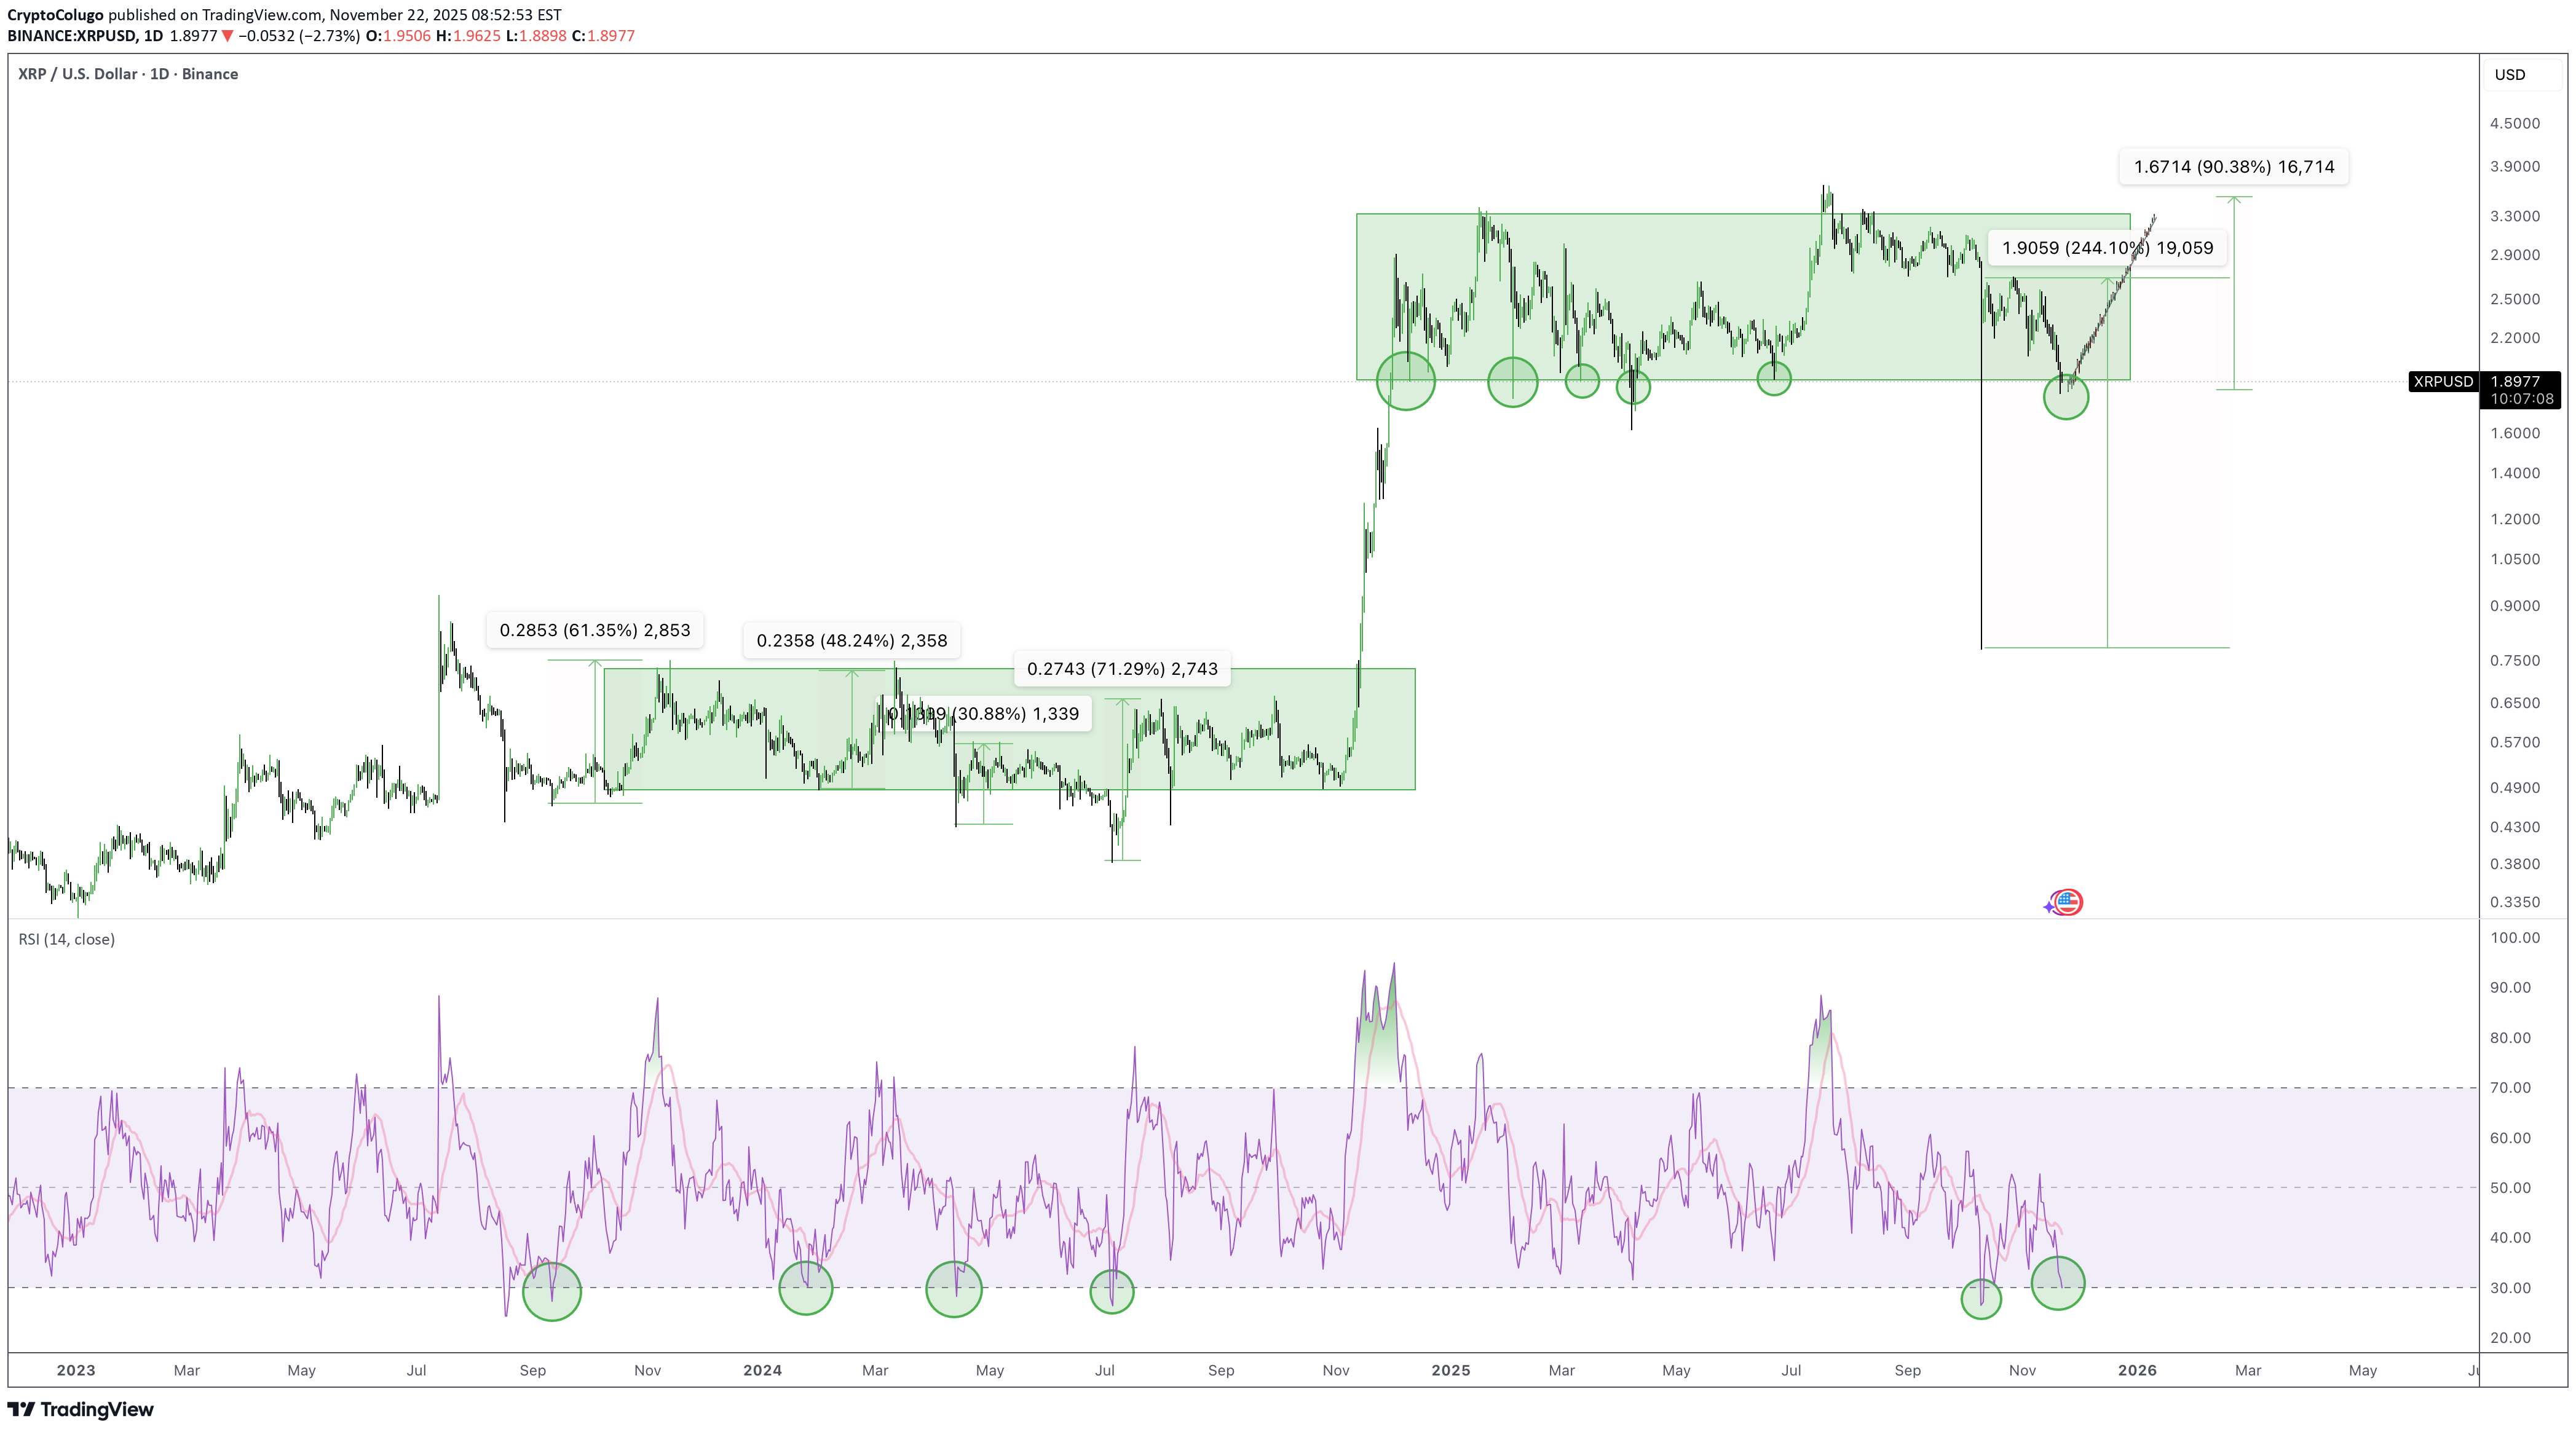
XRP at the daily timeframe. The RSI is almost oversold, the last 5 times when price went oversold and was at around the 30 level, we saw a huge rally. If we take the average of the last 5 times when the RSI was this oversold, then we could see a price rice of 90%. Strangely we are then exactly back at resistance of the channel. Oversold + at support levels makes buyers to step in the game. Will this time be different?

mazloomseyedmohammad79
XRPUSDT TRADE
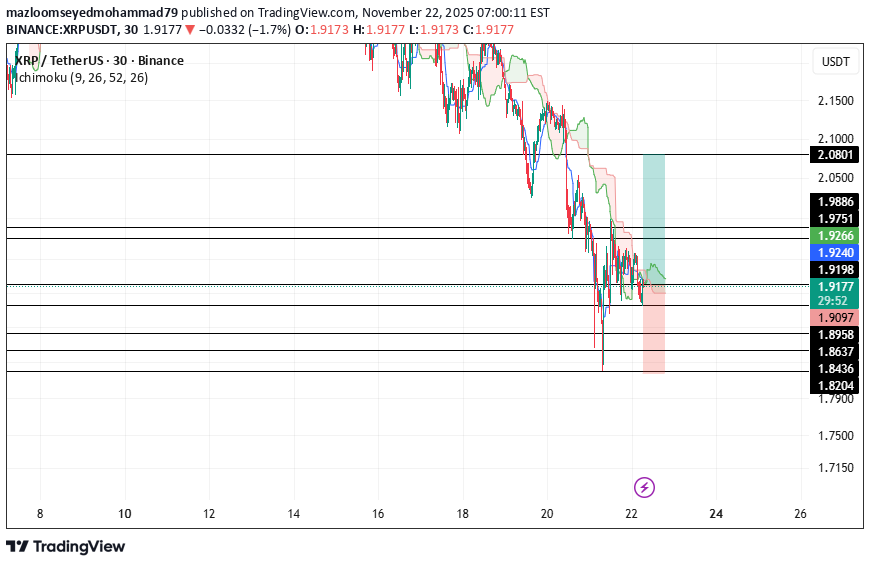
ENTRY:1.9191 TO 1.8437 SL:1.8178 TP:2.080 R/R=1.5 **Please observe capital management.**

XRP USDT SHORT SIGNAL
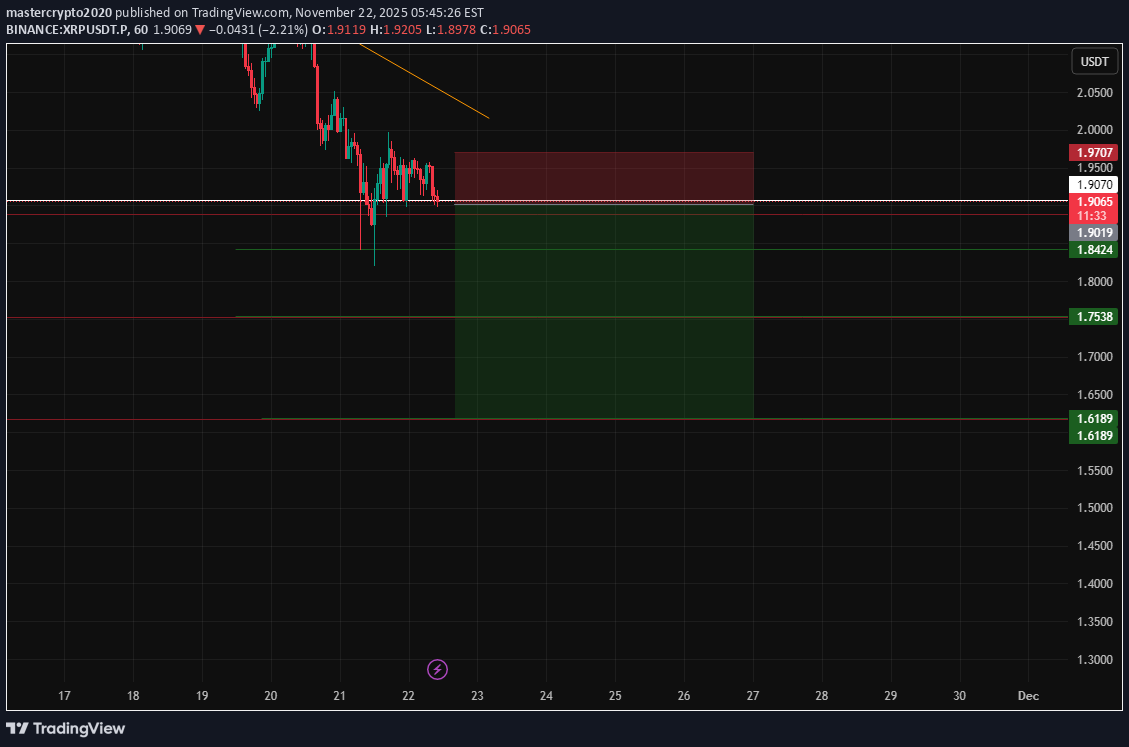
--- 📢 Official Trade Signal – XRP/USDT 📉 Position Type: SHORT 💰 Entry Price: 1.9000 --- 🎯 Take-Profit Targets (Partial Exits) TP1 = 1.8424 TP2 = 1.7538 TP3 = 1.6190 TP4 = — TP5 = — TP6 = — --- 🛑 Stop-Loss: 1.9800 📊 Timeframe: — ⚖️ Risk/Reward Ratio: 4.11 💥 Suggested Leverage: 5× – 10 --- 🧠 Technical Analysis Summary XRP is showing strong bearish signals after repeated rejection near the 1.95–2.00 resistance area. The price structure is shifting into a downward trend, with lower highs forming across lower timeframes. Key confirmations for this SHORT setup: Major resistance rejection at the 2.00 psychological level Breakdown of intraday support near 1.88 Increasing bearish momentum and downside liquidity gaps RSI and trend indicators showing weakening bullish strength TP targets align with key demand zones and liquidity pools from previous market structure The move toward 1.8424 and 1.7538 is supported by strong bearish continuation patterns. --- ⚙️ Trade Management Rules ✔️ Take partial profit at TP1 ✔️ Move Stop-Loss to Break-Even once TP1 is hit ✔️ Trail SL lower as price approaches TP2 and TP3 ✔️ Avoid any re-entry if SL at 1.98 is hit ✔️ Use proper risk per trade — no overexposure --- ⚠️ Important Risk-Management Note After hitting TP1, move SL to the Entry Price immediately. This eliminates risk and protects your capital. ❗ If the price reaches TP1 and later reverses back to break-even, this is not a loss — it is proper professional trade management. 🔐 Capital protection always comes before profit targets. --- 📌 TradingView Hashtags #XRPUSDT #XRP #CryptoSignal #ShortSetup #TechnicalAnalysis #TradingView #FuturesTrading #Altcoins #ProSignal ---
isahebdadi
XRP at a Make-or-Break Moment: Rebound Ahead or Major Breakdown?
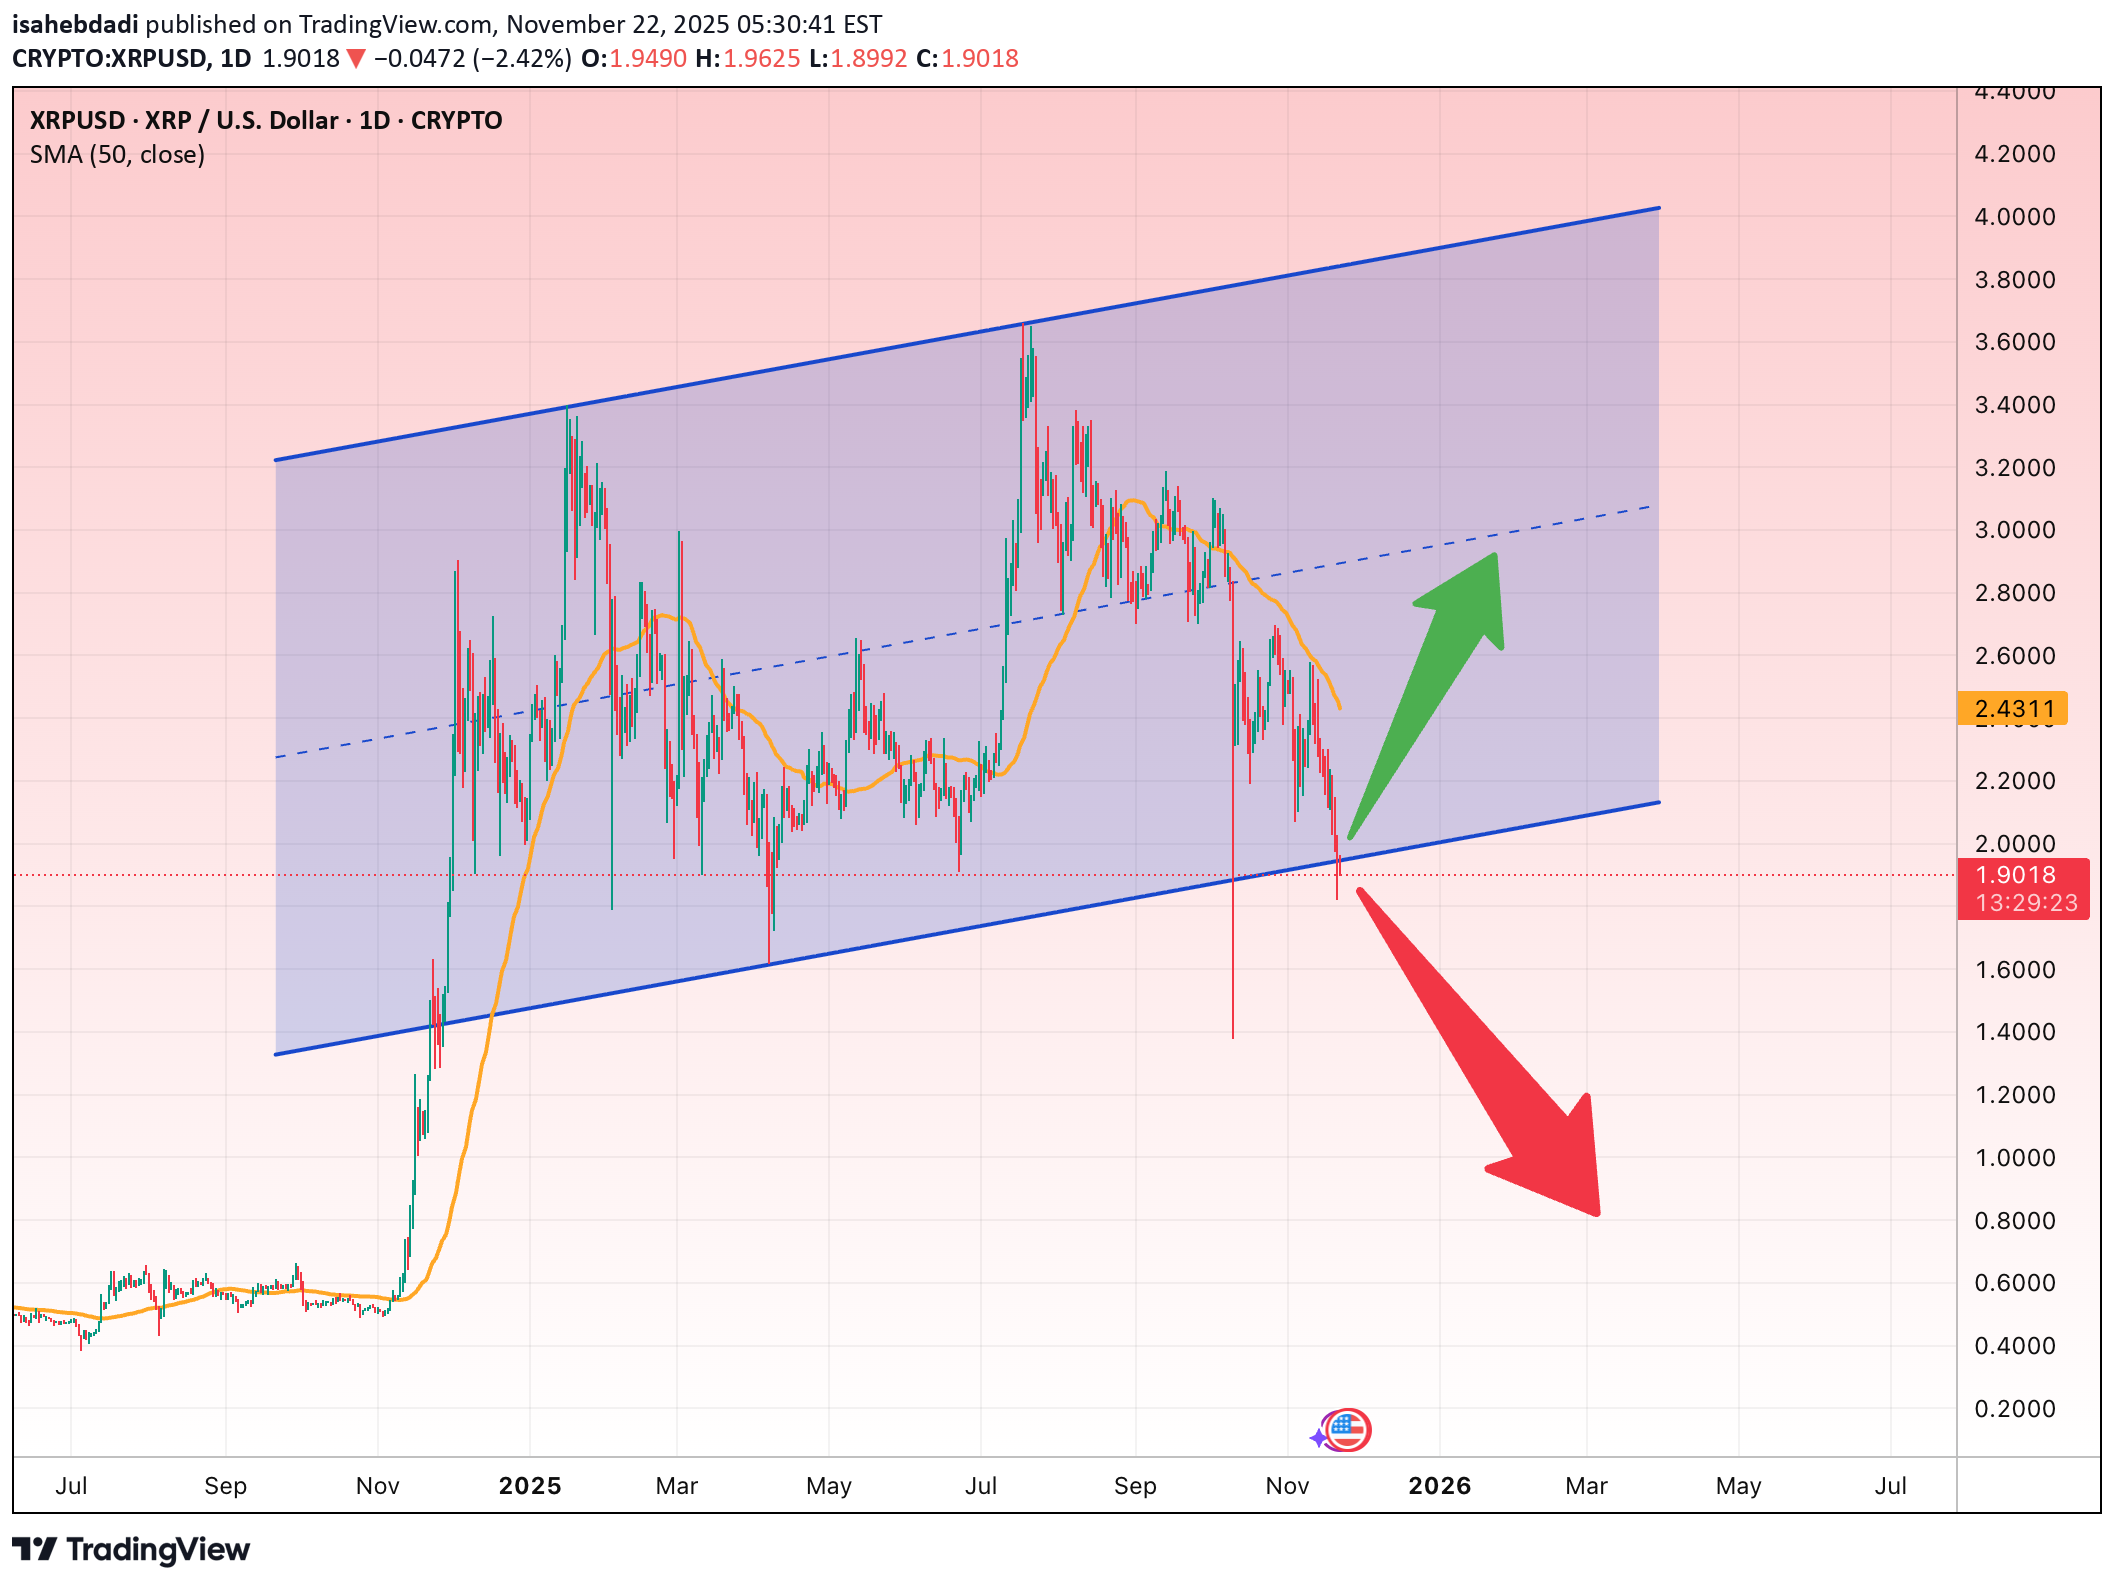
XRP has now reached the lower boundary of its long-term ascending channel, a level that has historically triggered either strong bullish reversals or major breakdowns. This area represents the true decision point between continuation of the uptrend or a potentially deep correction. Technical Overview Structure • Price has been moving inside a broad ascending channel for more than a year. • It is currently testing the channel support. • The 50-day SMA is above the price → bearish pressure still present. Bullish Scenario (if the channel support holds) If XRP stabilizes above 1.90–1.95: Targets: • Target 1: $2.43 • Target 2: $2.85 • Target 3: $3.20 • Major Target: Channel top near $4.00 Conditions for confirmation: ✔ Holding the lower channel line ✔ Reclaiming the 50-day SMA Bearish Scenario (if the channel support breaks) A daily close below $1.85 would confirm a breakdown. Targets: • Target 1: $1.60 • Target 2: $1.28 • Final Target: $1.00 or lower This scenario becomes active if the channel fails. Suggested Stop-Loss For long positions: $1.85 For short positions (after breakdown confirmation): $2.05
MoonriseTA
Monthly Crypto Analysis: Ripple (XRPUSD) – Issue 105
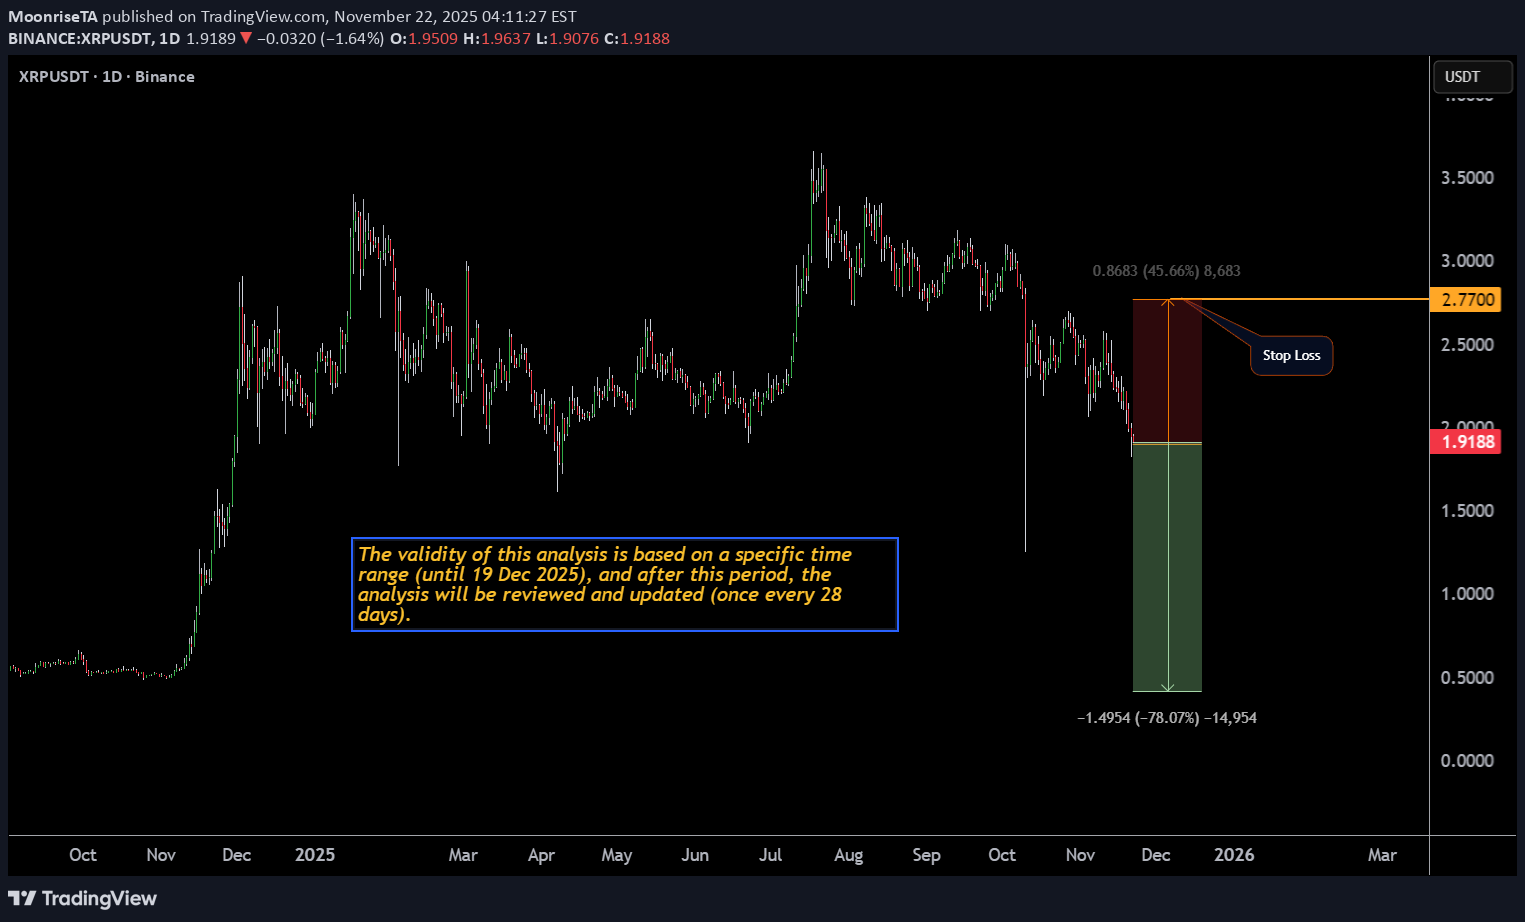
The analyst expects Ripple’s price to decline by the specified end time, based on quantitative analysis. The take-profit level only highlights the potential price range during this period — it’s optional and not a prediction that the market will necessarily reach it. You don’t need to go all-in or use leverage to trade wisely. Allocating just a portion of your funds helps keep overall risk low and ensures a more sustainable approach. Our strategy is built on institutional portfolio management principles, not the high-risk, all-in trading styles often promoted on social media. Results are evaluated over the entire analysis period, regardless of whether the take-profit level is reached. -The validity of this analysis is based on a specific time range (until 19 Dec 2025), and after this period, the analysis will be reviewed and updated (once every 28 days).

BorrowedClothes
XRPUSD testing monthly 20EMA support
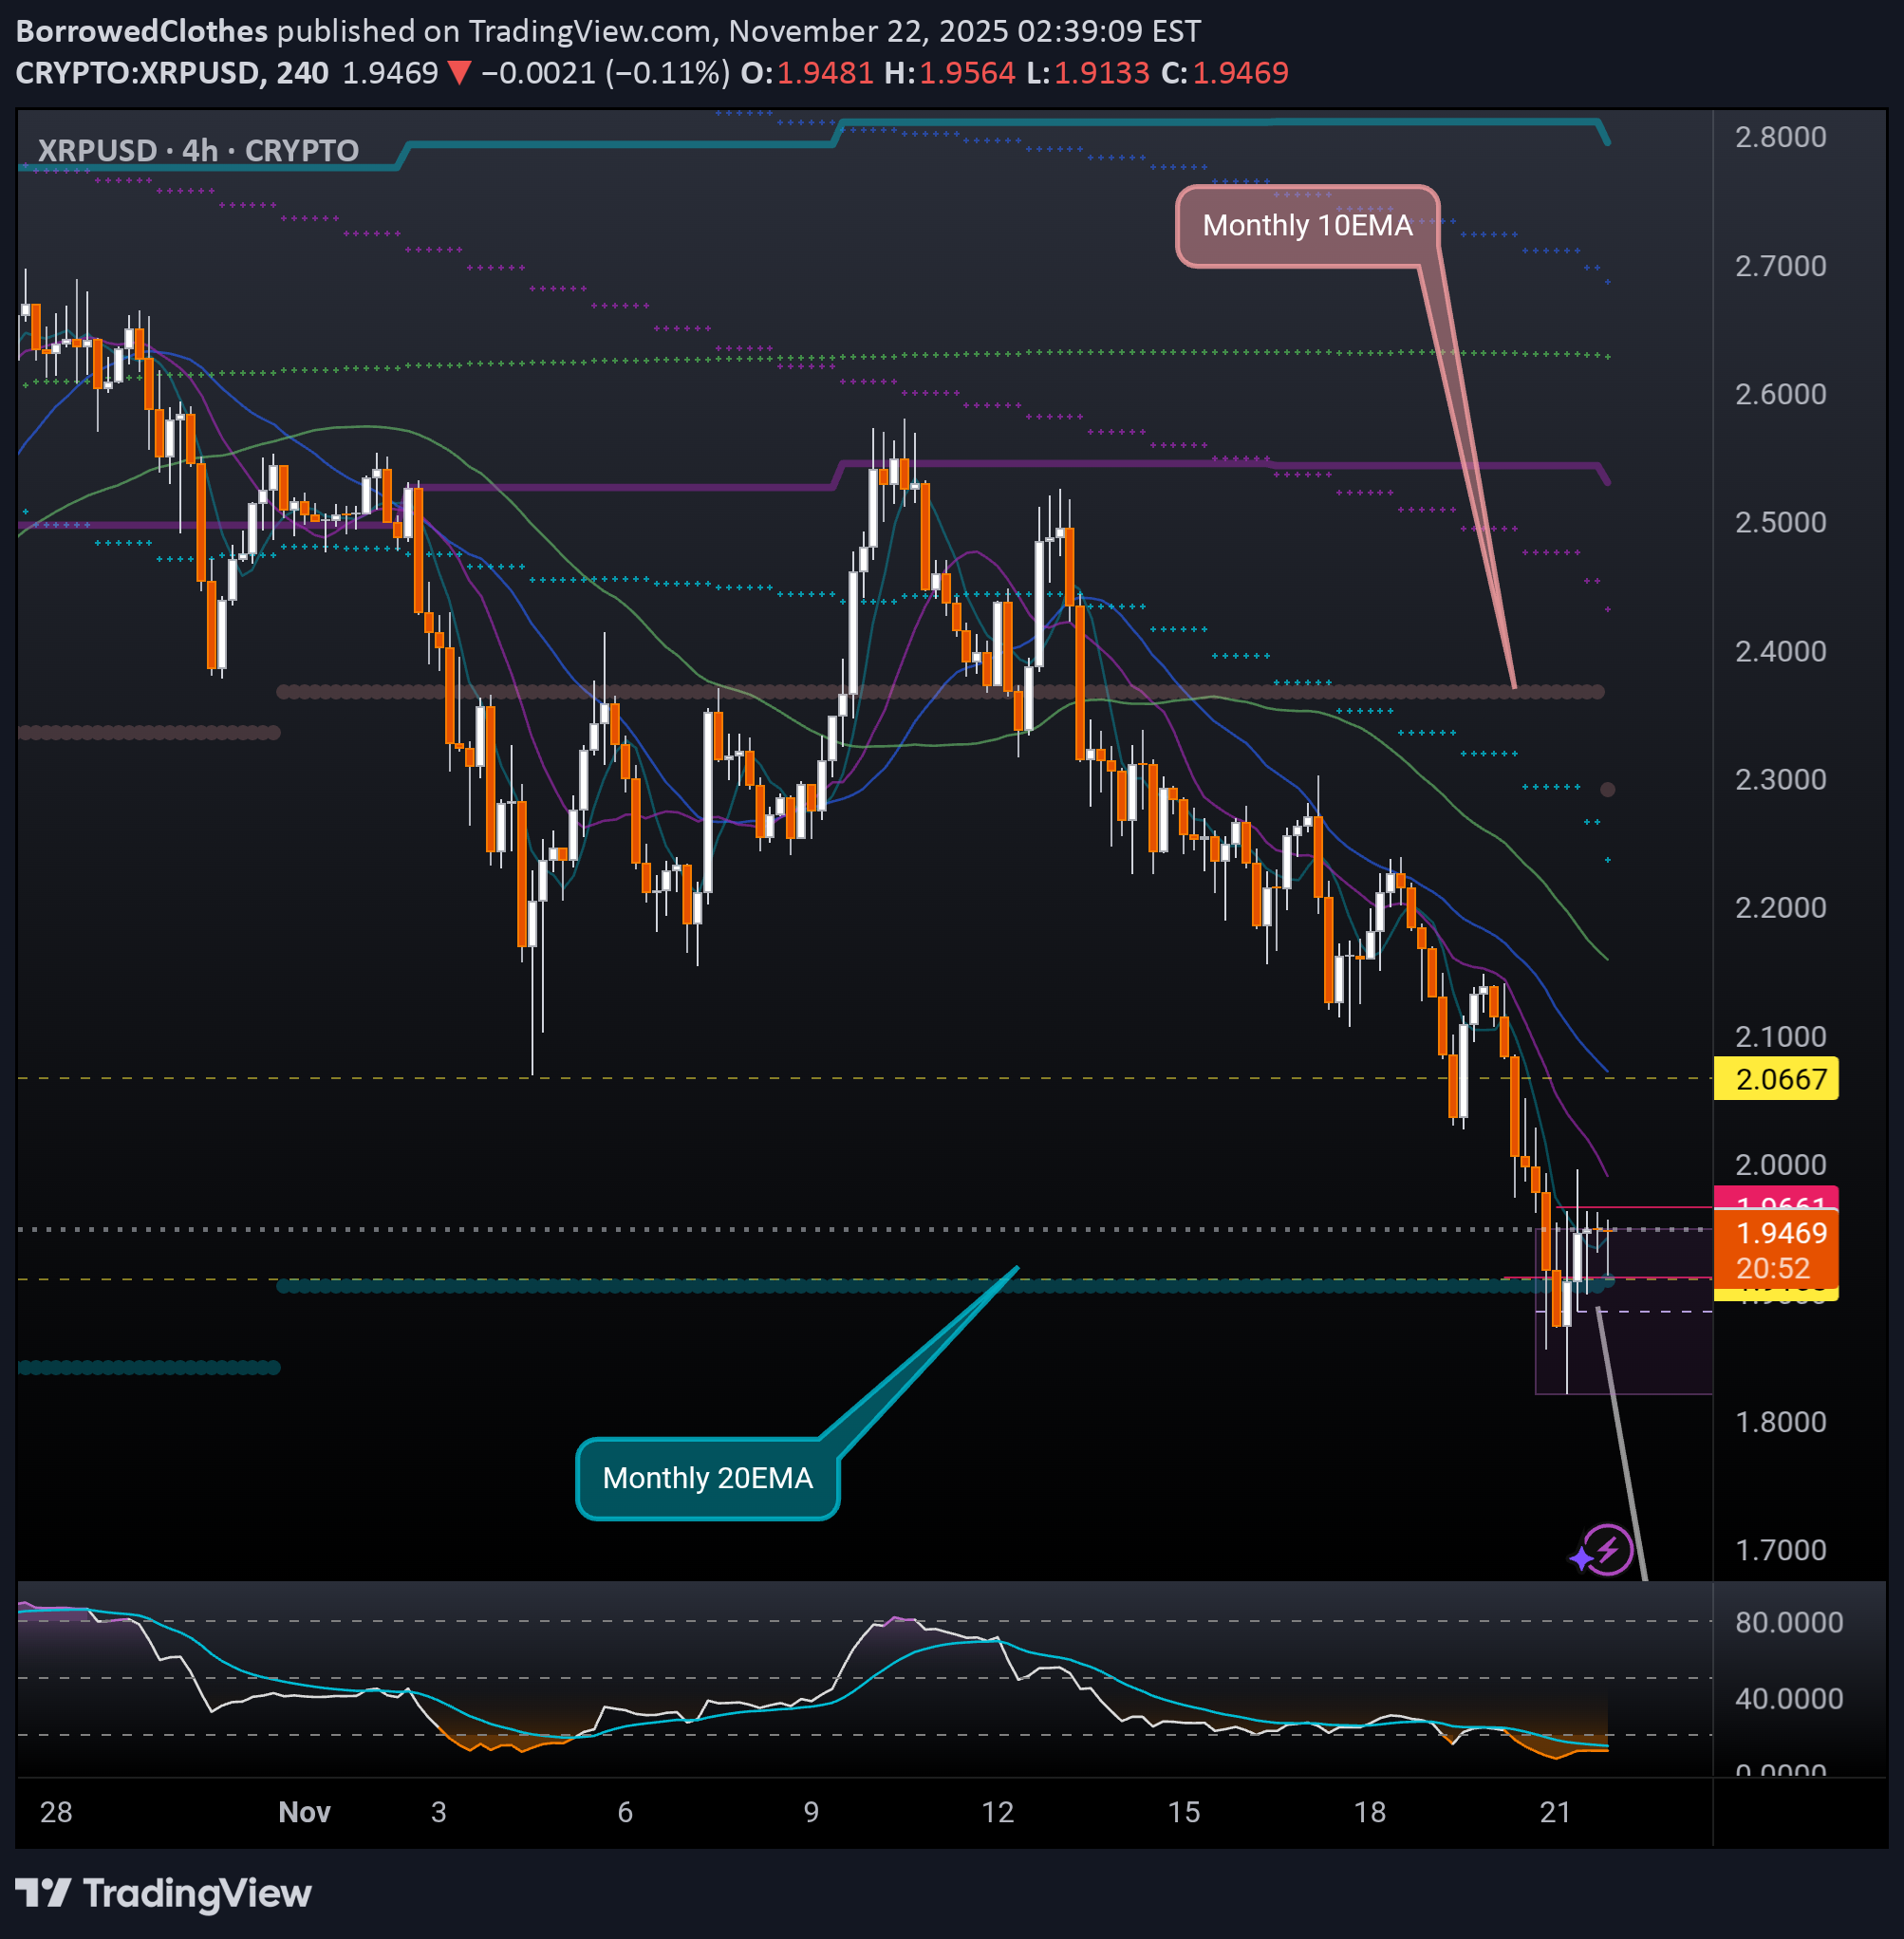
Critical area for XRP bulls. If the Monthly 20EMA holds (overlayed on this 4H chart) we could see price retrace to the high 2.20s/low 2.30s to test the resistance at the Monthly 10EMA. Needless to say that the RSI is oversold on multiple time frames but with the algorithm set to "sell off" the RSI has become useless for now. As always, on a play like this, tight SL and sniper entries.

XRP/USDT 1H – Sacred Geometry Time Update (Nov 21, 2025)
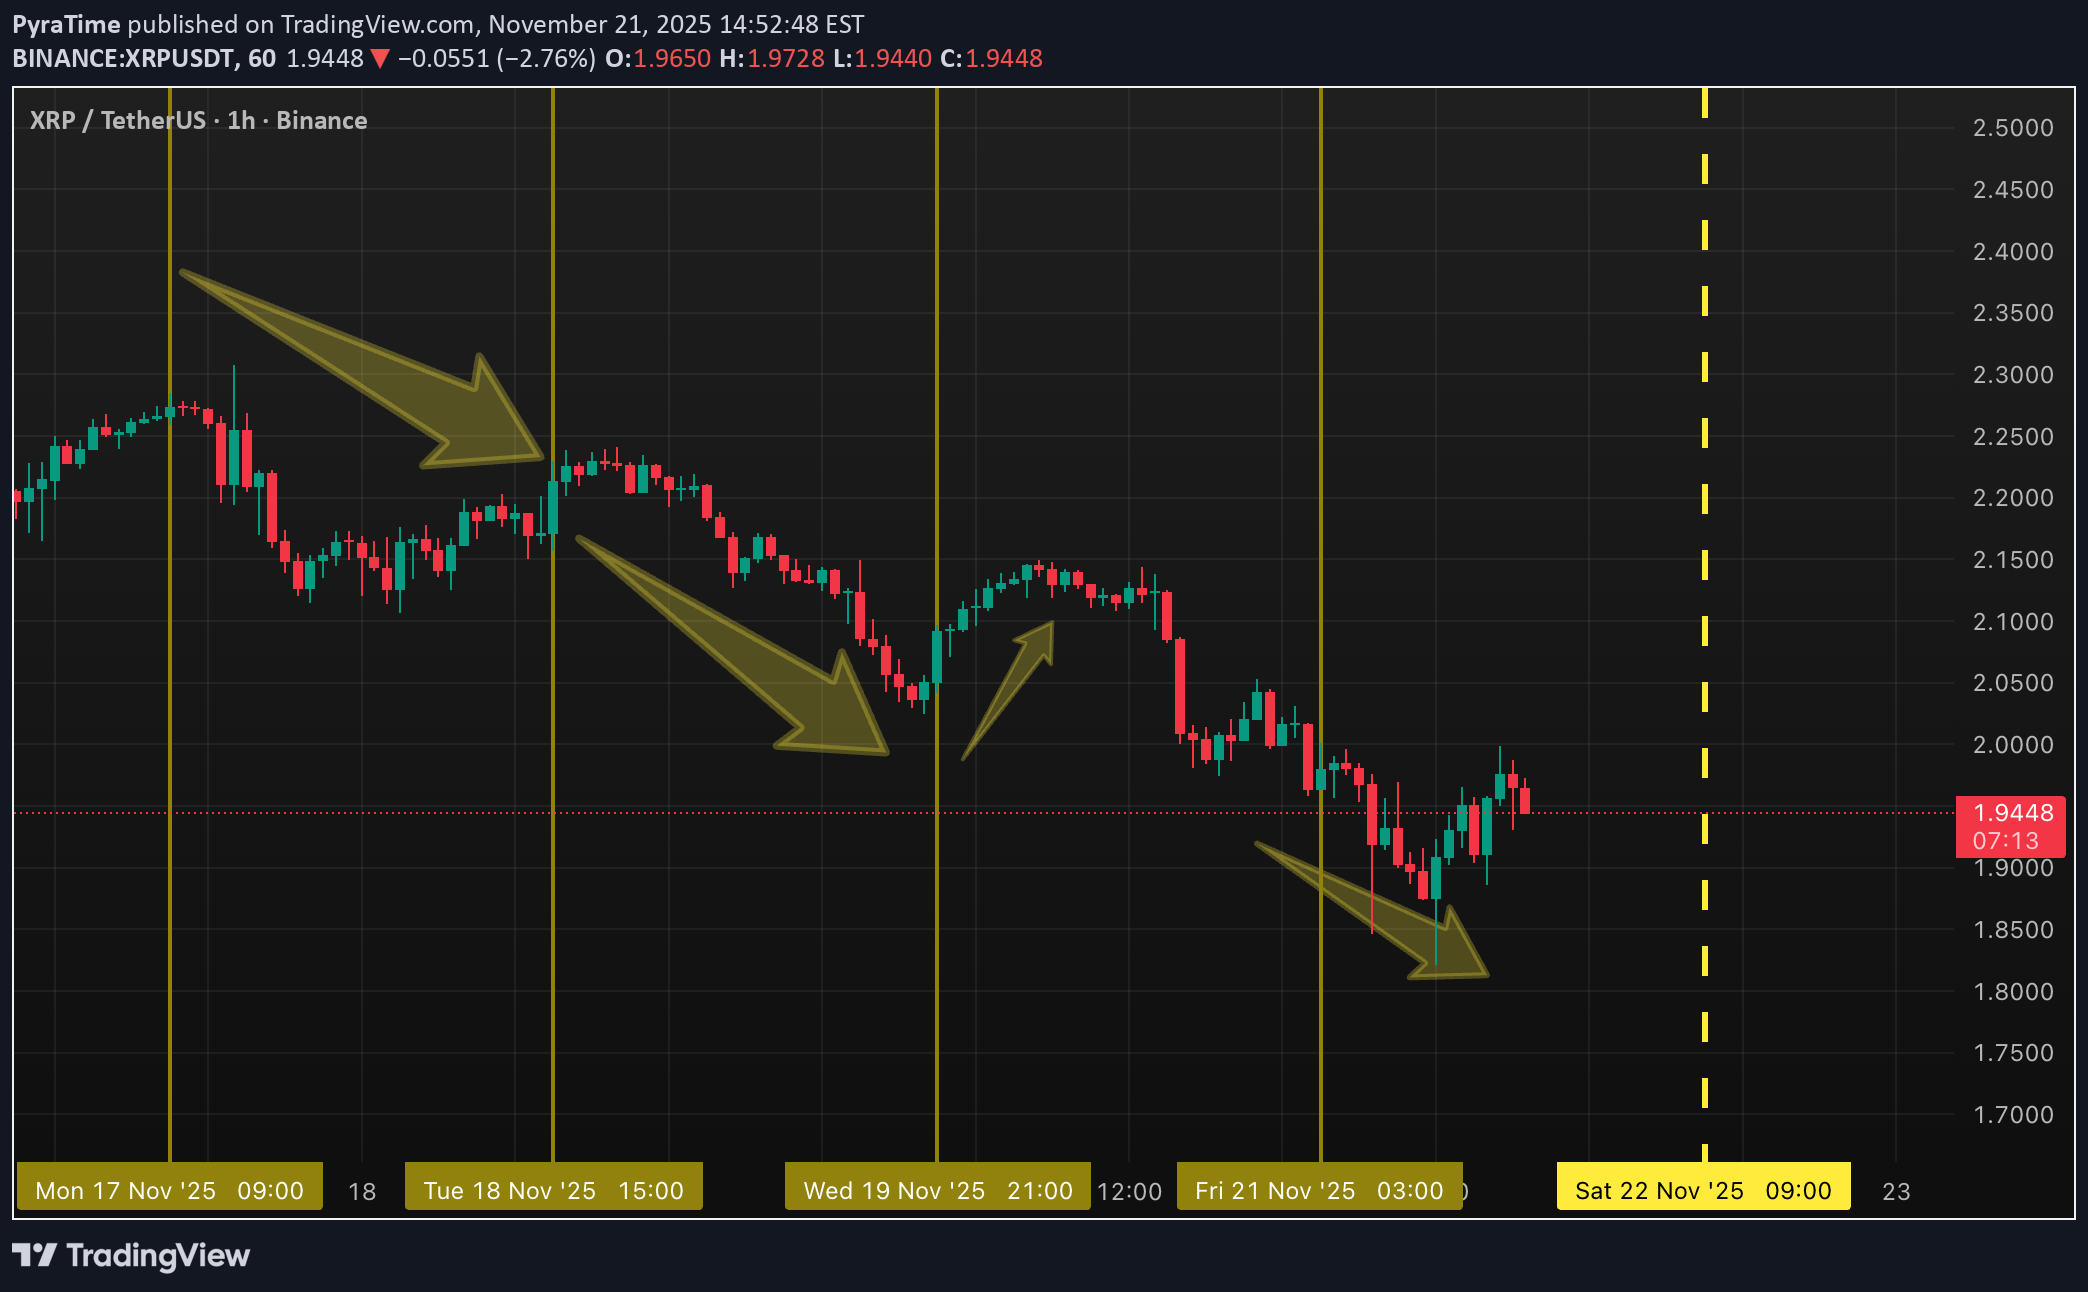
Current price: ~$1.95 Low today: $1.82 The last three visible reversals all landed exactly on the same forward-projected time grid (derived from one fixed ancient ratio – no repainting, no settings). The recent drop from ~$2.15 stopped dead on the most recent line and bounced hard. Next high-probability time window opens tomorrow: Sat 22 November – 09:00 UTC In oversold conditions like this (RSI <30, heavy selling exhaustion), these time confluences have repeatedly produced sharp reversals across XRP, BTC, Gold, ES, etc. Personal bias: watching for a potential snap-back long if we get a confirmed 1H close above $1.98 into that window. Targets if it triggers: $2.05 → $2.12 → $2.20 stretch Stop below today’s low. The trend is down. I'm not calling a bottom. I am saying that these lines have an amazing success rate at predicting reversals or acceleration points. Not financial advice – just sharing a geometric timing pattern that keeps lining up perfectly. Curious how one 4500-year-old constant can do this? Happy to explain in the comments. #XRP #Ripple #Gann #SacredGeometry #TradingView

سالار خبازخدایی
مشاهده واگرایی در ریپل در تایم فریم 1 ساعته حاکی از احتمال صعود این ارز دارد .همچنین از لحاظ سطوح حمایتی این ارز در زون حمایتی قرار گرفته و پیشنهاد می شود با احتیاط و حتما یک پله خرید…

SETLifeTrading
XRP all time high
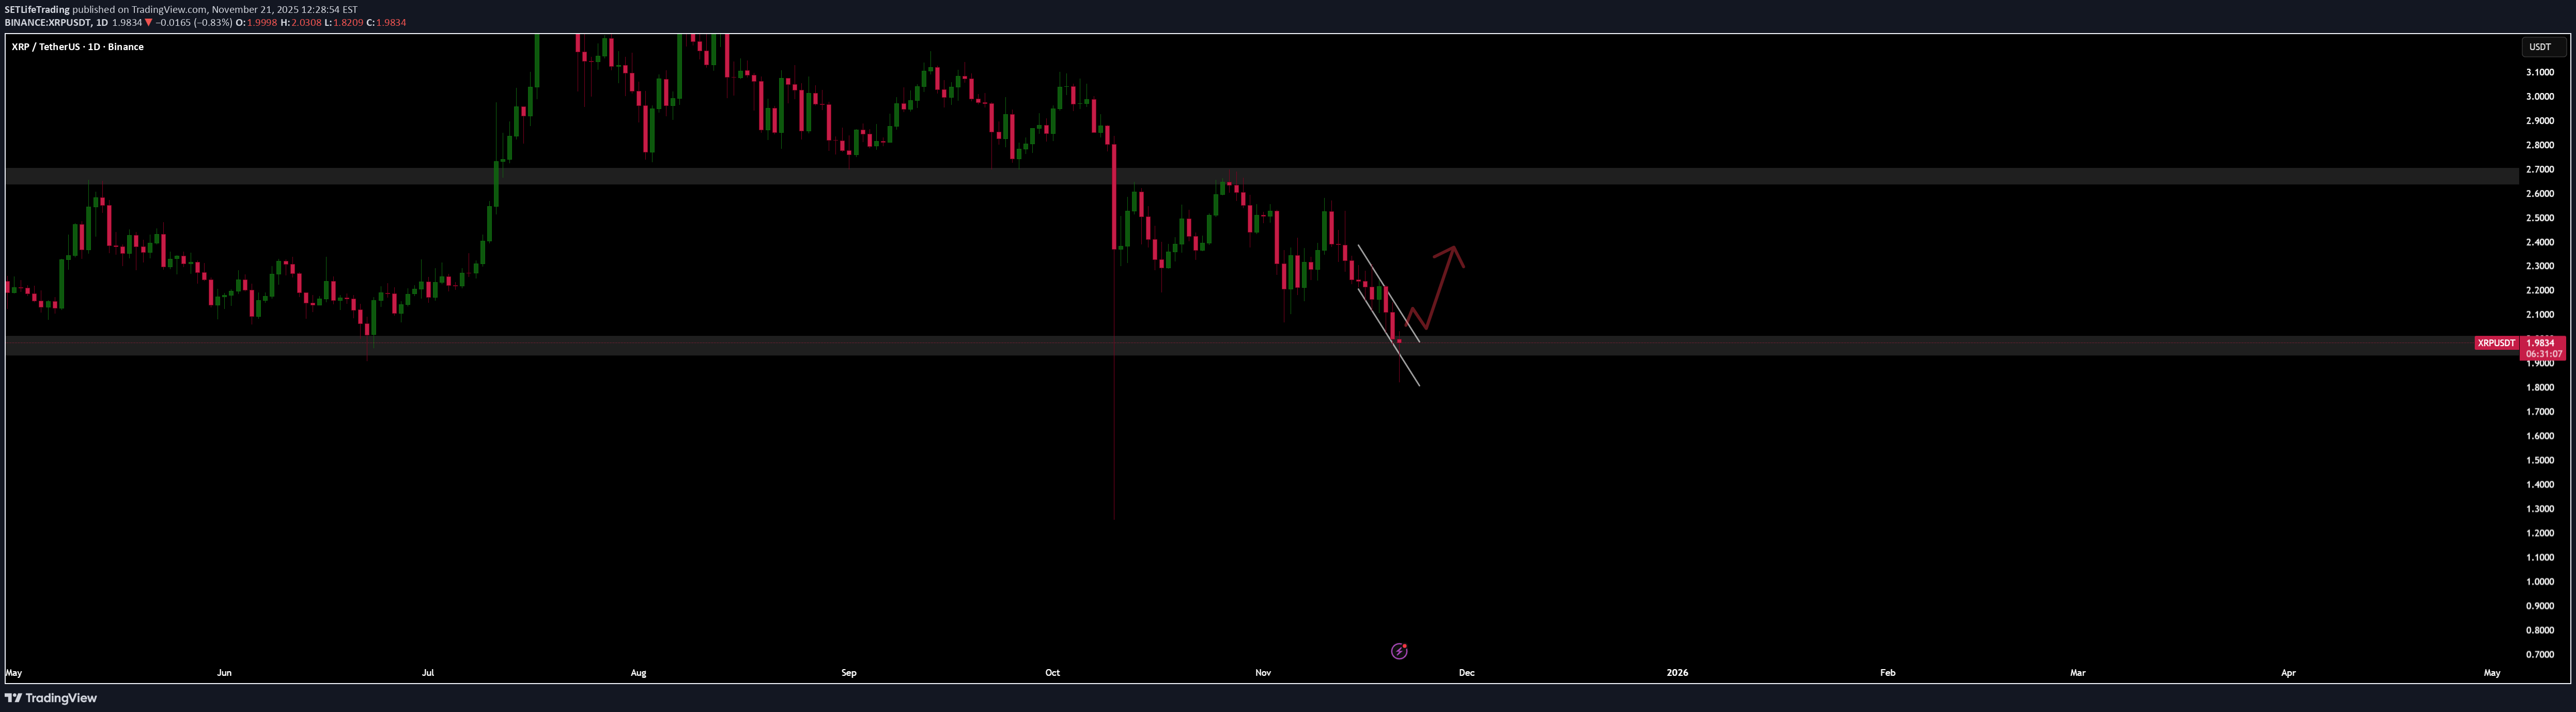
XRP is starting to reverse. Next week could be the week when it starts climbing to reach and break all time highs before or beginning of NEW YEARS.

miljedtothemoon
XRPUSDT.P - November 22, 2025
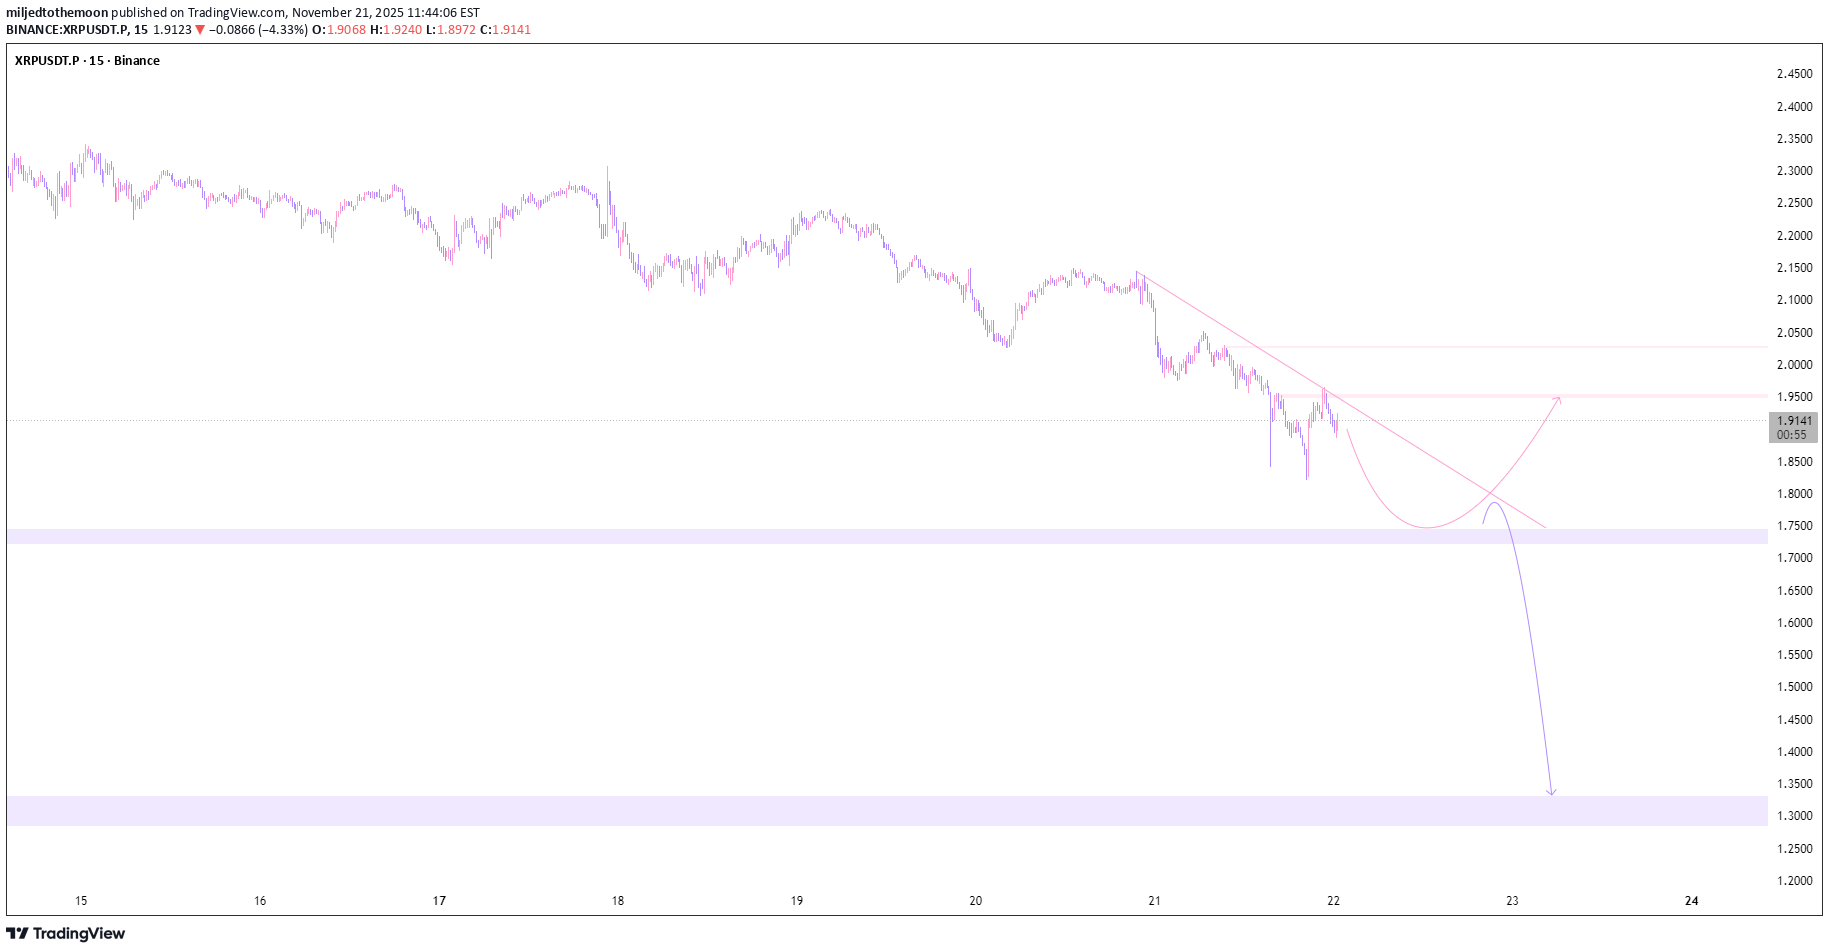
The chart for XRPUSDT shows a sustained downtrend, confirmed by a descending trendline and a consistent pattern of lower highs and lower lows. Price action is currently consolidating below the trendline, with resistance around 1.95 and key support marked near 1.72 and 1.32. Momentum remains bearish; a failed recovery above resistance could trigger a sharp move down to the next support zone. If buyers regain control and break above the trendline, a short-term reversal toward 1.95 is possible, but overall trend structure favors sellers.
Disclaimer
Any content and materials included in Finbeet's website and official communication channels are a compilation of personal opinions and analyses and are not binding. They do not constitute any recommendation for buying, selling, entering or exiting the stock market and cryptocurrency market. Also, all news and analyses included in the website and channels are merely republished information from official and unofficial domestic and foreign sources, and it is obvious that users of the said content are responsible for following up and ensuring the authenticity and accuracy of the materials. Therefore, while disclaiming responsibility, it is declared that the responsibility for any decision-making, action, and potential profit and loss in the capital market and cryptocurrency market lies with the trader.