
ETH
Ethereum
| Trader | Signal Type | Profit Price/Stop Loss Price | Publish Time | View Message |
|---|---|---|---|---|
 FalconLineTradingRank: 6 | BUY | Profit Price: ۵٬۰۵۹ Stop Loss Price: Not specified | 11/6/2025 | |
 ManiMarketsRank: 289 | SELL | Profit Price: Not specified Stop Loss Price: Not specified | 7 hour ago | |
 CRYPTOMOJO_TARank: 285 | BUY | Profit Price: Not specified Stop Loss Price: Not specified | 14 hour ago | |
 PouyanFaRank: 216 | BUY | Profit Price: Not specified Stop Loss Price: Not specified | 15 hour ago | |
 CryptoChartDailyRank: 21 | BUY | Profit Price: Not specified Stop Loss Price: Not specified | 16 hour ago |
Price Chart of Ethereum
Profit 3 Months :
Signals of Ethereum
Filter
Sort messages by
Message Type
Trader Type
Time Frame

AltcoinPiooners
$ETH Descending Trendline Pressure – Bounce Setup?
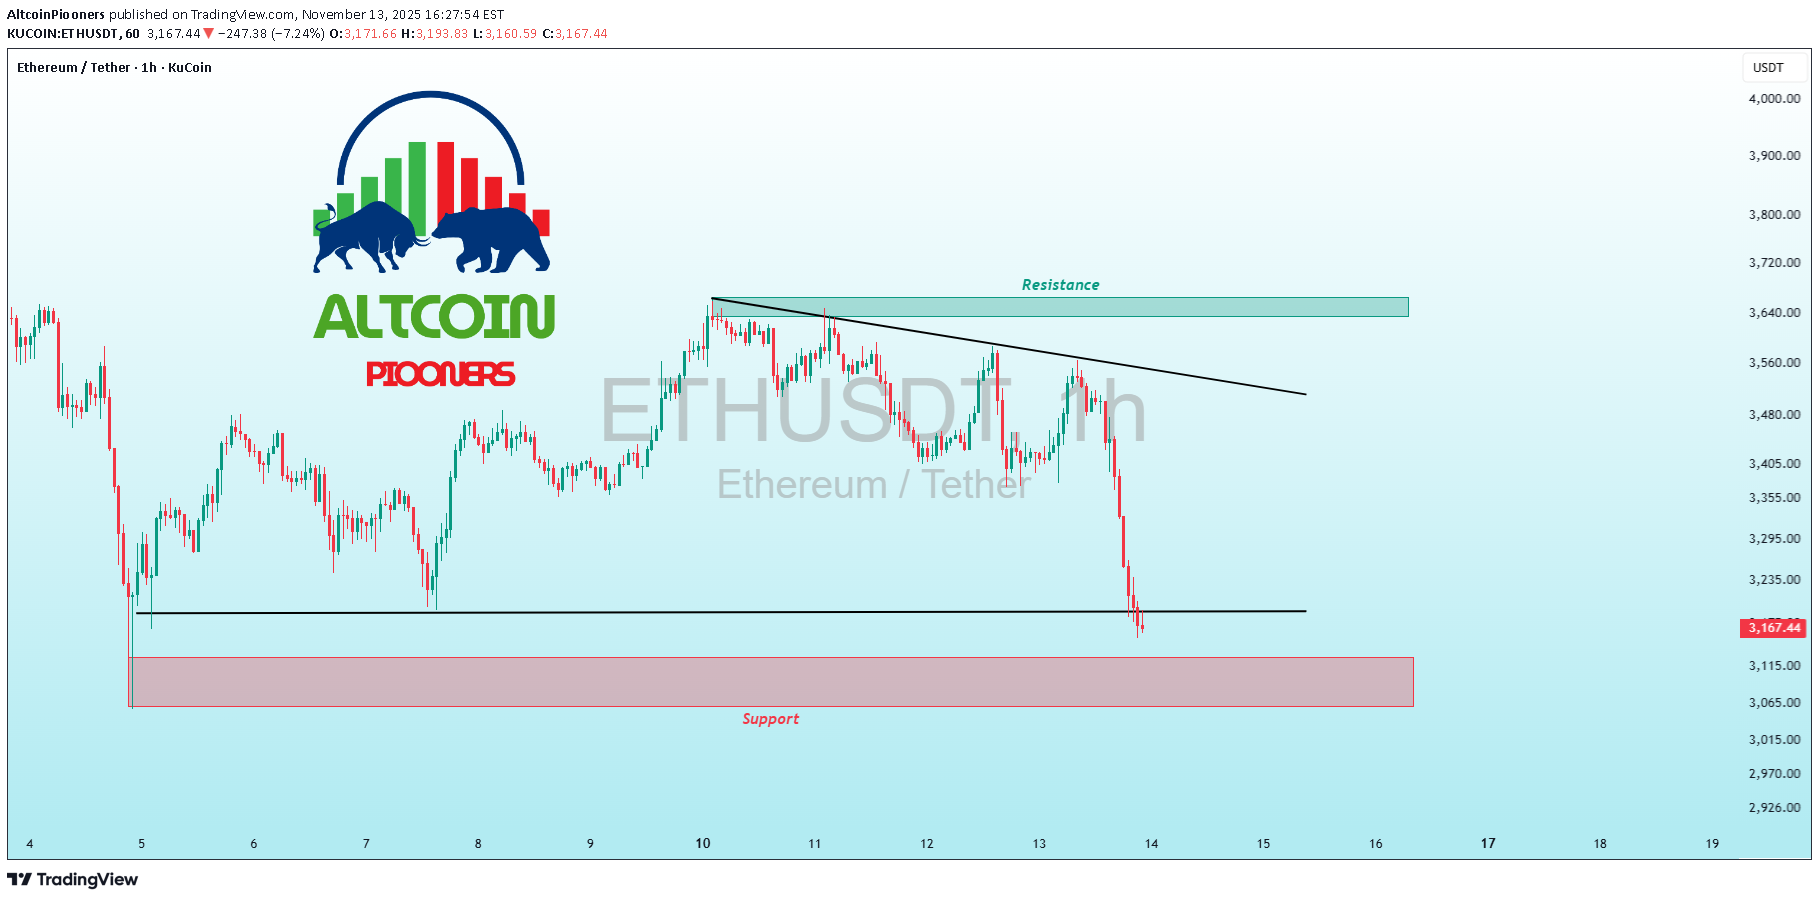
ETHUSDT ETH Descending Trendline Pressure – Bounce Setup? Current trend: ETH's tracing a sharp downtrend from 4K highs, now slamming the 3,176 support with a wedge-like compression—sellers dominating but volume fading hints at exhaustion 🛡️. Hold support? Likely yes; prior lows and 200 EMA confluence could spark buyers if wicks hold. Breakout above resistance? Watch 3,900 flip on close—could reverse to 4,100 if trendline breaks bullishly 🚀. Dip risk? Sharp to 3,000 on breach, fueled by BTC correlation. Target: Upside 3,500 on defense; downside 3,050 buffer. Indicators tracking: RSI (32, oversold snap), Trendline slope, and MACD histogram curl 📉. #ETHTrading #CryptoWedge #AltcoinPioneers
Ozymandias1998
ETHUSD long trade activated

In my opinion EThUSD has a great potential to benefit from the seasonal trend in November and December, when compared to Bitcoin on ETHBTC chart it also show momentum. The daily and weekly trends are also strong so a reverseal is the most probable move here. The stoploss and targets are showed in the chart.

Wyckognito
Ethereum | Redistribution in the Making
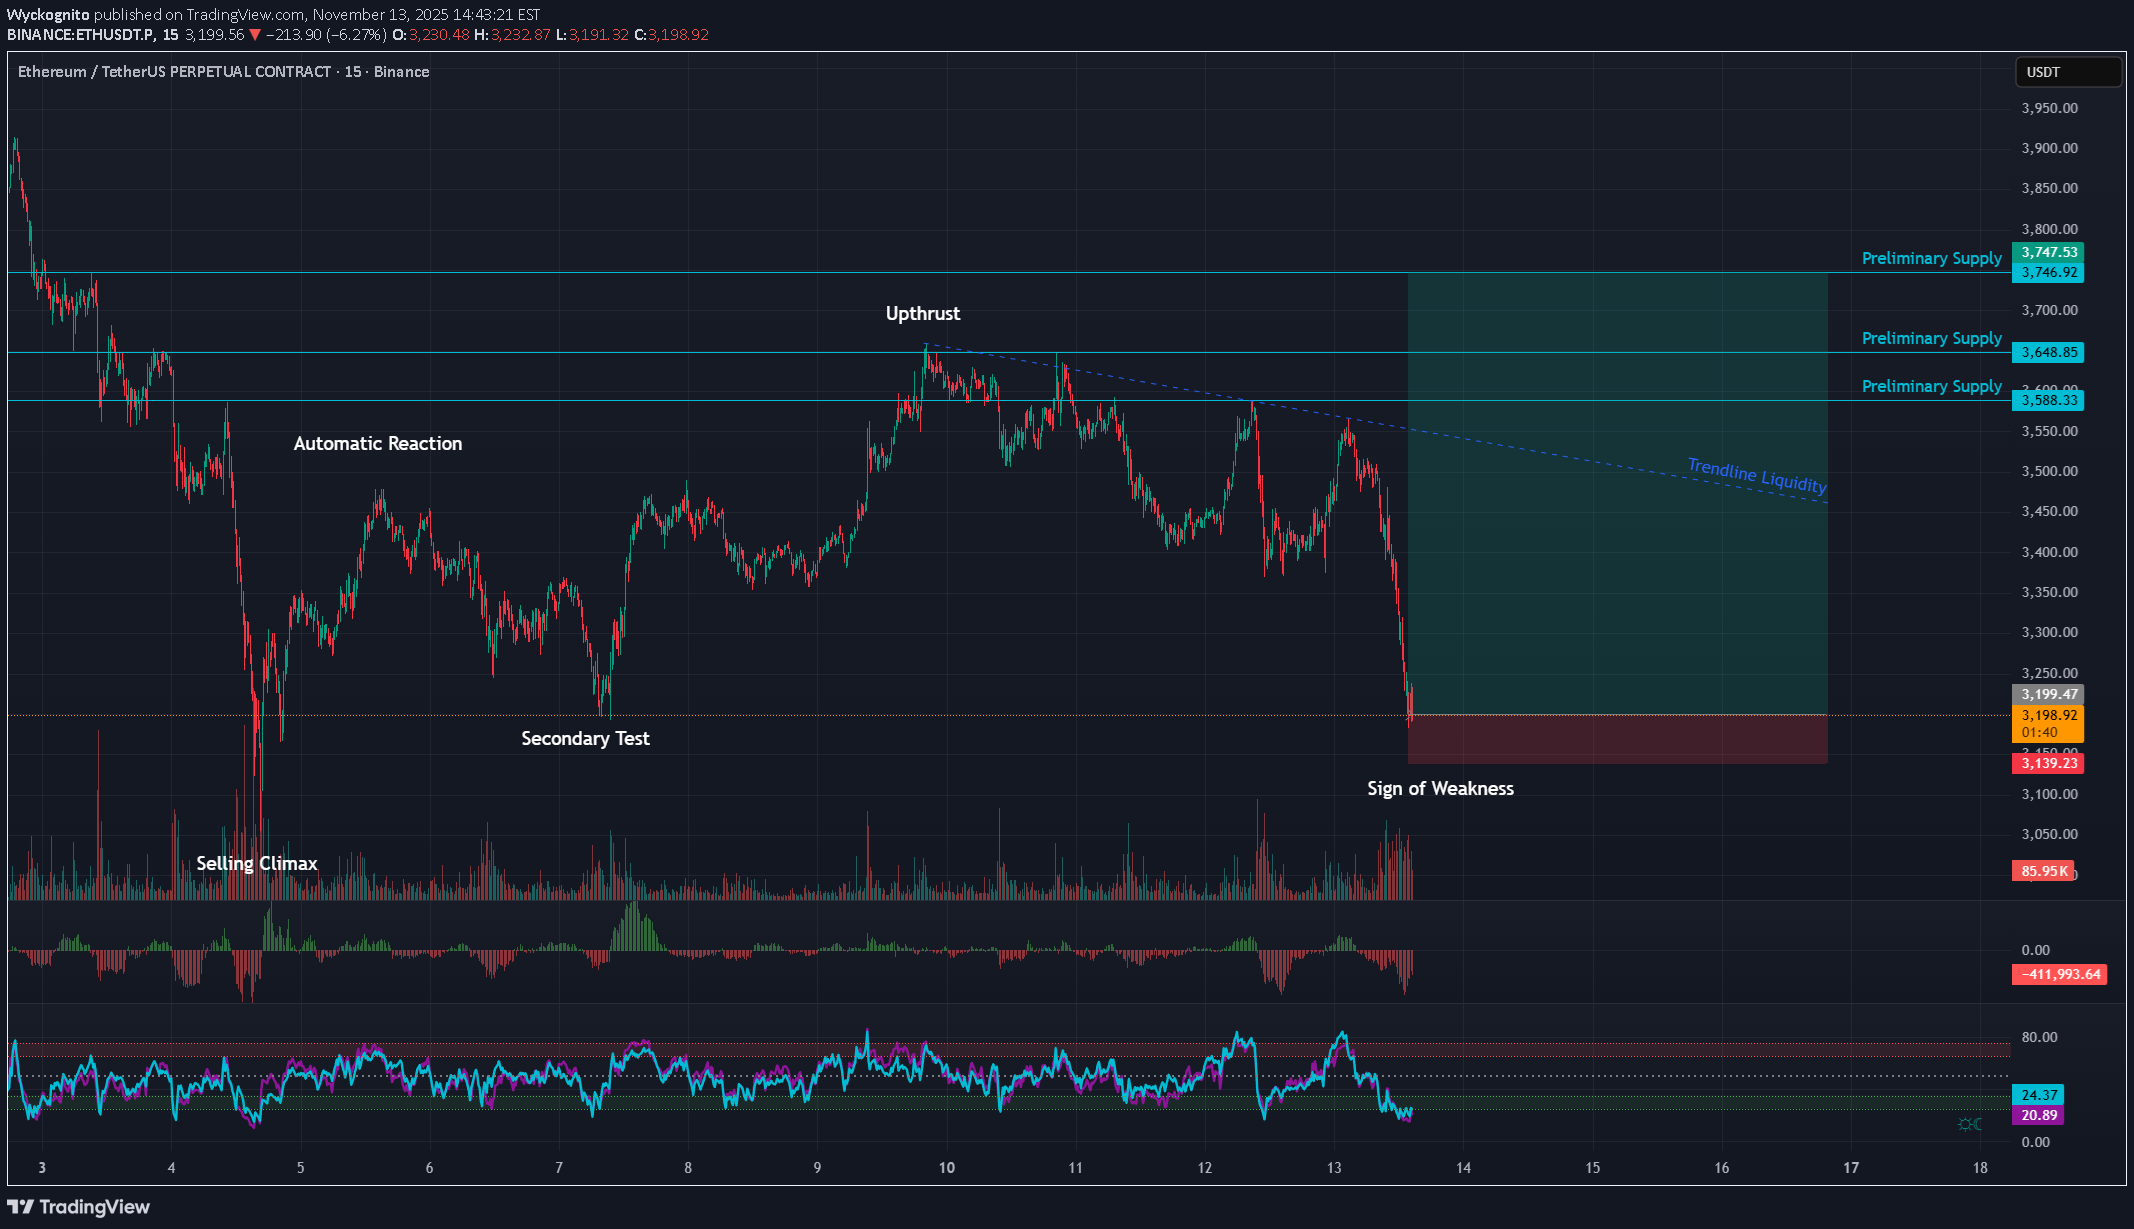
Ethereum is carving out what appears to be a redistribution structure, but the context hints we may still need one more push upward, possibly a Last Point of Supply (LPSY) or even a UTAD (Upthrust After Distribution), before the markdown phase resumes. Wyckoff Structure Overview: Selling Climax (SC) and Automatic Reaction (AR) defined the lower boundary. Secondary Test (ST) confirmed demand depletion. Upthrust (UT) established resistance and began drawing a trendline of liquidity across the highs. The recent Sign of Weakness (SOW) confirms heavy supply entering, but price action is extended and could retrace to relieve pressure. The PSY zone between $3,580–$3,740 remains untested, aligning with both a liquidity pool and potential LPSY/UTAD territory. That’s where we’ll likely see whether this range completes redistribution or transforms into an even broader distribution with a deceptive final trap. Volume and CVD Analysis During the SOW, volume spiked — strong selling pressure confirmed. Yet CVD is diverging, showing aggressive sellers losing momentum while absorption quietly builds. If we see a sharp rebound on weak delta, that will likely be smart money offloading into strength — the signature of an LPSY or UTAD. The Lunar Influence We’re in Lunar Day 23, during the Last Quarter Moon in Virgo — a cosmic rhythm often tied to misleading signals, short-lived reversals, and exaggerated reactions. This phase tends to produce fakeouts that look like Signs of Strength or Signs of Weakness, but are actually exhaustion moves or liquidity grabs before the real continuation. In Wyckoff terms, Lunar Day 23 energy often shows Phase C deception, which could be a UTAD disguised as a breakout or a terminal shakeout before markdown. What to Watch Next Rebound on declining volume → potential LPSY/UTAD forming. Failed rally into the PSY zone with increased spread down-bars → confirmation of redistribution continuing. Strong bullish delta with no follow-through → likely fake strength under Lunar Day 23 conditions.

reiiss7
ETH 1k to 3.4k

Today the market has shown its hand, I think it will drop now. There was some local accumulation, but only up to the supply zone. It was a difficult situation to predict. Anyway, for ETH, many will buy at 1200's , 1300's , 1400's and be forced to sell at the bottom. It may even go under 1k but this is low enough for low leverage or spot.

RayHanBros
ETH LONG
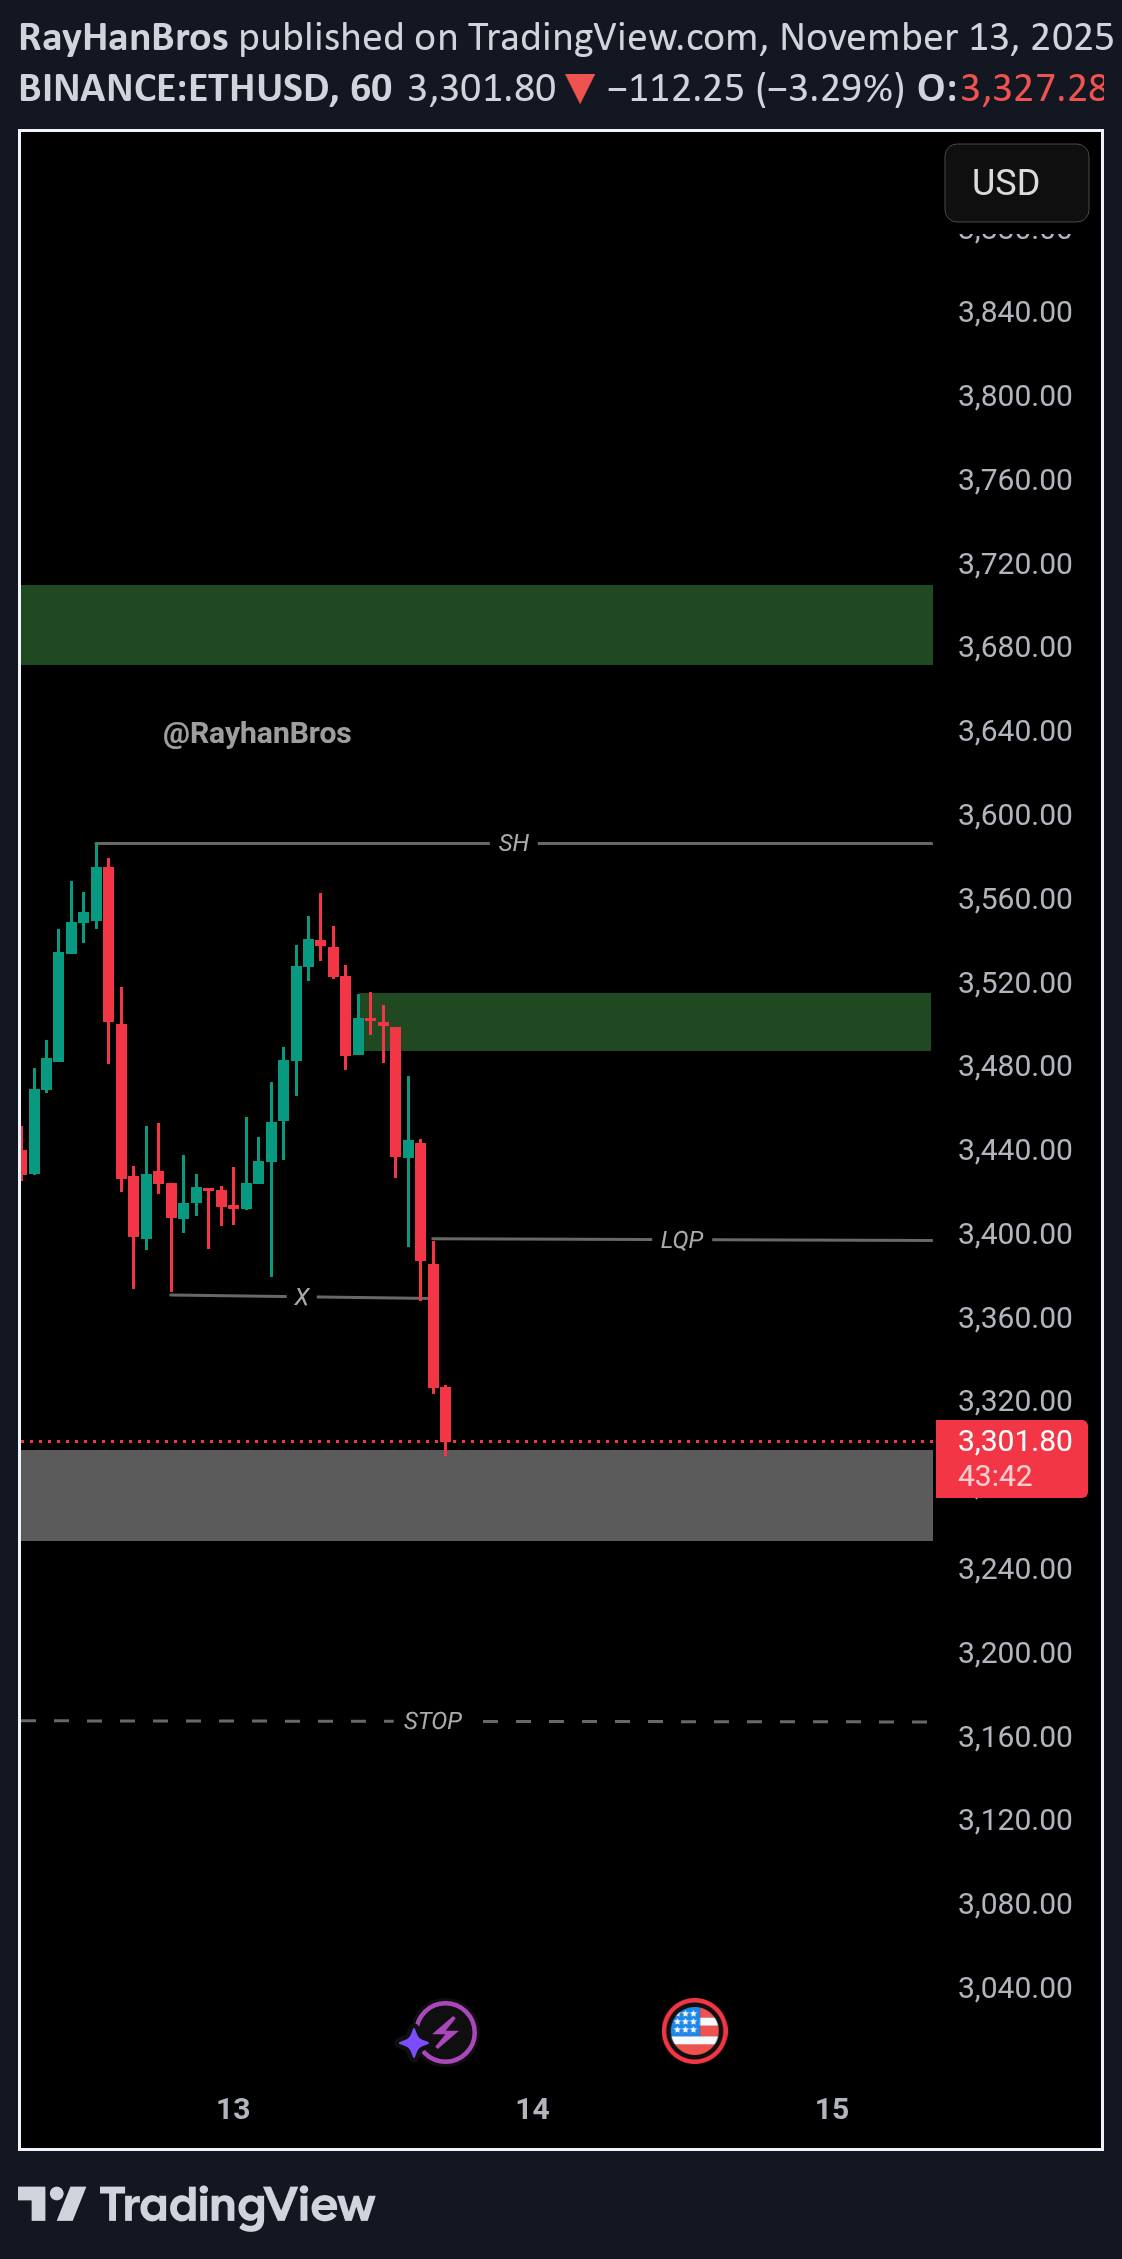
🟢 Entry : 3300$ - 3360$ 🎯 Targets : 1) 3370$ 2) 3450$ 3) 3550$ 4) 3700$+ 🔴 Stop : Blw 3180$

illuminati_K027
ETH Failed to Join BTC Rally — Now Entering Wave 2 Downtrend?
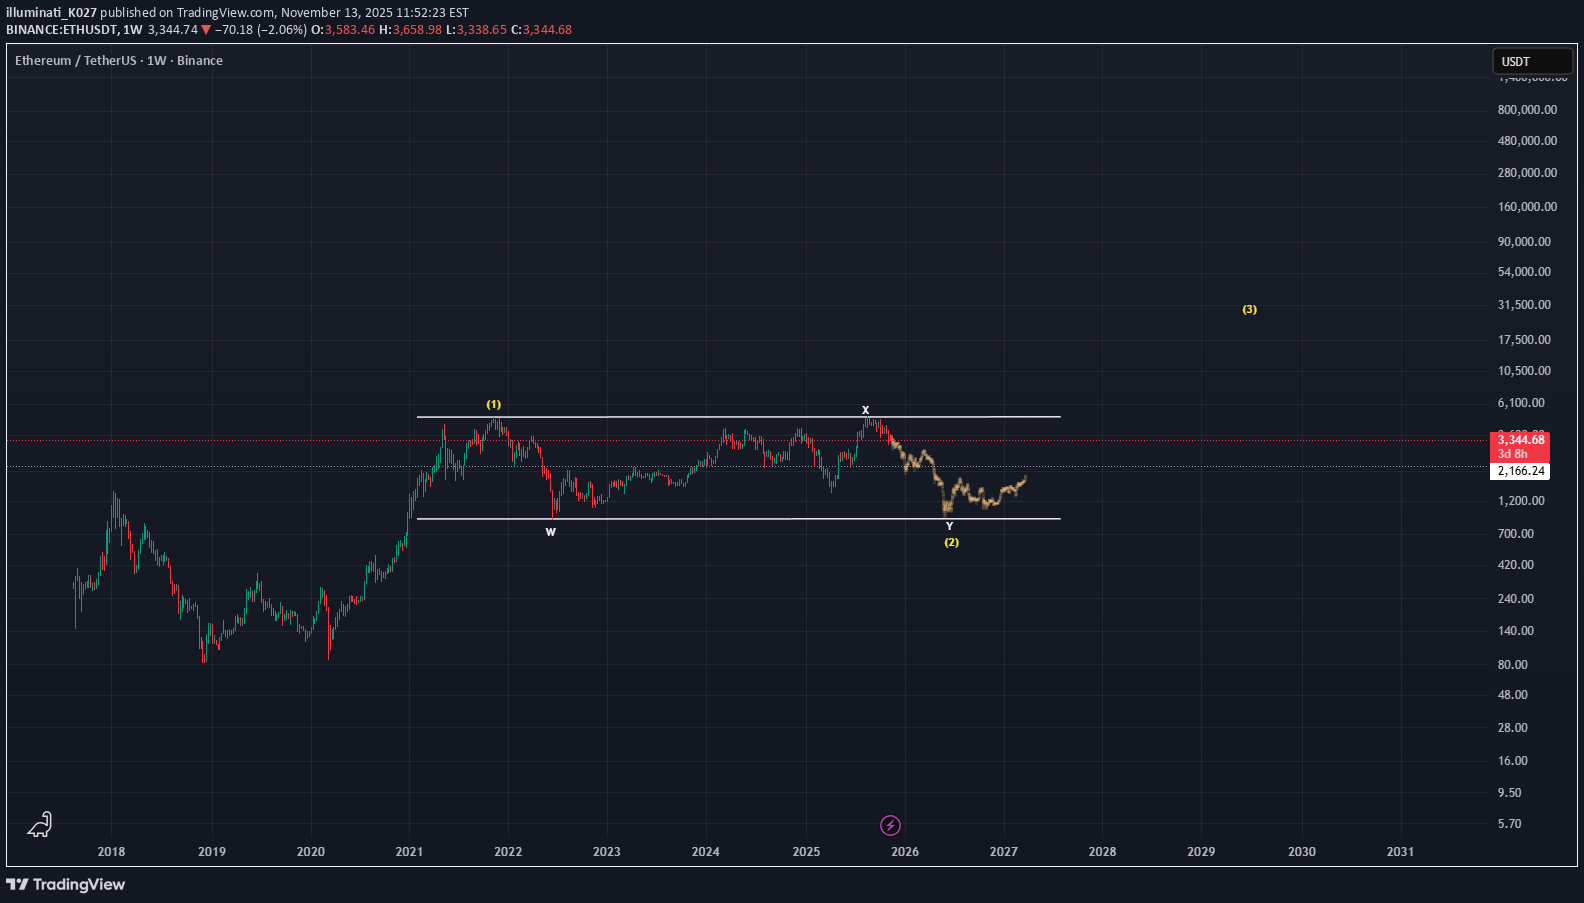
While Bitcoin has been in a major bullish wave, Ethereum has only formed an X-wave (a corrective bounce, not a true impulse). ETH now appears to be entering the early stage of a Wave 2 decline alongside BTC. Don’t get fooled by short-lived rebounds.

BTC ETH It's Decision Time!

BTC ETH should be deciding which direction to move to by next week. We need DAILY CLOSINGS above green resistance and Downtrend Line OR below red support to confirm in which direction it will move to next. The odds are that it's a BREAKOUT back to ATH with ETH, perhaps, maybe, blasting higher into January. BTC might not blast too much higher just yet. If the price does not breakout of the Downtrend Line rather quick, things could turn really ugly again next week.
ManiMarkets
ETHUSD: Caught in a Downtrend Triangle Below Key Targets

📉 ETHUSD: Caught in a Downtrend Triangle Below Key Targets – What's Next for Ethereum? Timeframe: 4-Hour Chart Ethereum (ETHUSD) is currently trading around $3,440. The price is showing clear signs of bearish pressure, trapped within a developing pattern after failing to sustain higher levels. Current Price Action & Trend Analysis: Ethereum has been in a sustained downtrend since hitting peaks in late October, marked by a series of lower highs. The most recent attempt at a recovery was firmly rejected at the 3700 'Upside 1st Target' zone around November 10th-11th. Since this rejection, ETHUSD has been consolidating, largely operating below a prominent red descending trendline that acts as dynamic resistance. The price is currently hovering around the 3350 'Deciding Area', which appears to be acting as immediate support. However, repeated rejections from the descending trendline (forming a potential descending triangle or wedge pattern) highlight the persistent selling pressure. While the price has found temporary bounces from this 'Deciding Area', the inability to break the overhead trendline suggests continued weakness. Key Resistance Levels: Descending Red Trendline: This dynamic trendline, currently just above the 3500 mark, is the most immediate obstacle for any bullish recovery. A breakout above this would be the first hint of shifting momentum. 3700 Upside 1st Target: This was the recent high point before the current leg down and represents a significant resistance level that bulls need to overcome to regain conviction. 3850 to 3950 1st Key Resistance & 4085: These higher resistance zones are currently out of immediate reach but remain significant hurdles for a broader trend reversal. 4200 to 4300 Strong Resistance: This major overhead resistance marks the area of the previous peak and would require a substantial bullish impulse to challenge. Key Support Levels: 3350 Deciding Area: This grey zone is acting as immediate support. Sustained trading below this area would be a clear bearish signal. 3200 Downside 1st Target: Should the 'Deciding Area' fail to hold, the chart identifies 3200 as the 'Downside 1st Target'. This level could attract buyers but also represents a critical breakdown point. 3000 Key Support Level: This strong psychological and technical support level would come into play if 3200 is breached. It represents a last line of defense for the broader mid-term bullish structure. Bullish Scenario: For Ethereum to turn bullish in the short term, it needs to decisively break above the descending red trendline and then firmly reclaim the 3700 'Upside 1st Target' with strong volume. This would invalidate the current bearish pattern and suggest a potential move towards higher resistance levels. Bearish Scenario: The prevailing bearish sentiment suggests a higher probability of continued downward movement. Failure to break the descending trendline and a decisive break below the 3350 'Deciding Area' would likely open the path to test the 3200 'Downside 1st Target'. A breach of 3200 could lead to a rapid descent towards the 3000 'Key Support Level'. Conclusion: Ethereum is currently at a critical juncture, struggling under a bearish trendline and clinging to the 3350 'Deciding Area' support. The immediate future for ETHUSD hinges on whether it can break out of this descending formation to the upside, or if continued selling pressure will push it towards the 3200 and 3000 support levels. Traders should watch for a clear break from the current consolidation pattern to confirm the next directional move. Disclaimer: The information provided in this chart is for educational and informational purposes only and should not be considered as investment advice. Trading and investing involve substantial risk and are not suitable for every investor. You should carefully consider your financial situation and consult with a financial advisor before making any investment decisions. The creator of this chart does not guarantee any specific outcome or profit and is not responsible for any losses incurred as a result of using this information. Past performance is not indicative of future results. Use this information at your own risk. This chart has been created for my own improvement in Trading and Investment Analysis. Please do your own analysis before any investments.

ROY_TRADER_007
ETHUSD TRADE SATUP READ CAPTION

Enter Layer This blue box marks the entry zone for a long trade — between around $3,427–$3,440. The expectation: price might retest this area before moving upward. Traders wait for price to touch or slightly dip into this box before entering. ⚪ Stop Trade Area This grey area near $3,369 is the stop-loss zone. If price drops below this level, it invalidates the bullish idea — exit the trade to prevent larger losses. Profit Targets Target Point First: around $3,478 → Conservative first target; a likely area of initial resistance. Target Point 2nd: around $3,545 → Intermediate target if bullish momentum continues. Last Target Point: around $3,563–$3,565 → Final take-profit zone, marking the full bullish move.

RSI_Trading_point
ETH/USD (1H timeframe) ...
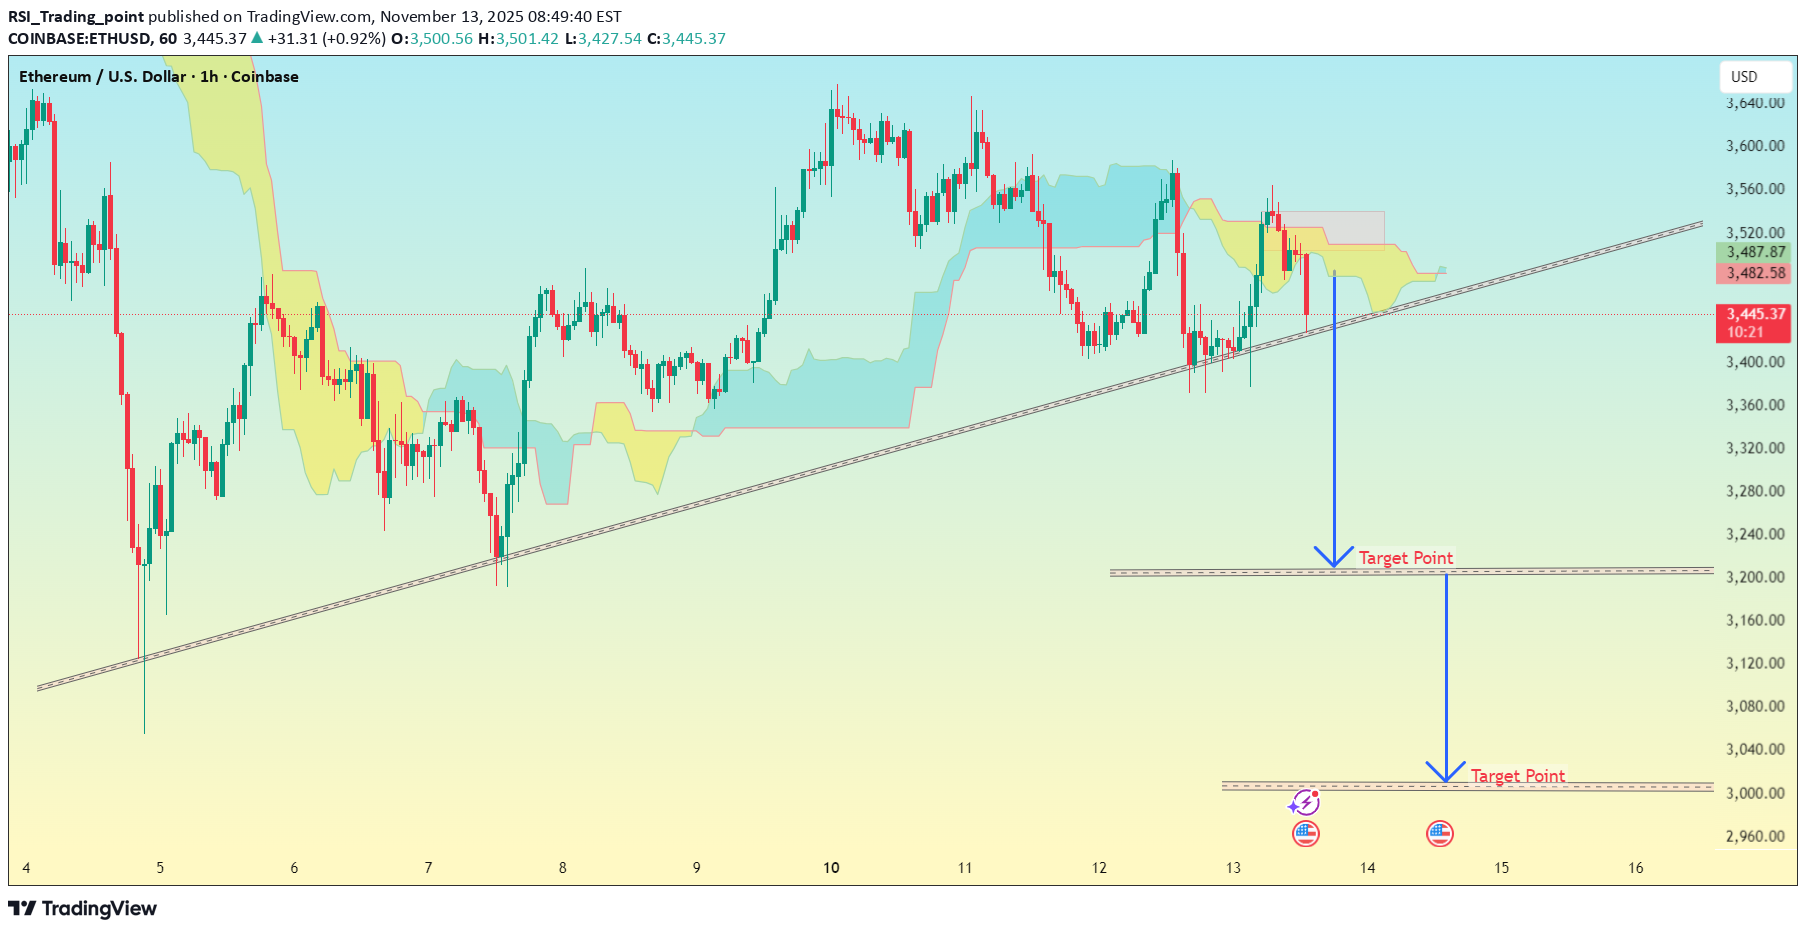
ETH/USD (1H timeframe) on Coinbase, and it’s clearly showing a raisin trendline test with two downside “Target Points” already drawn. Let’s break it down: --- 🔍 Chart Analysis Price is $3,441, sitting right on the ascending trendline. Ichimoku Cloud is turning bearish (price below the cloud). Trendline break looks likely — momentum is weak and candles are closing below the cloud. Two target zones (downside) are marked on my chart. --- 📉 Bearish Breakdown Scenario If ETH breaks and closes below the ascending trendline (~$3,440 area): First Target (TP1): around $3,230 – $3,250 → This aligns with previous horizontal support and midpoint of the last bounce. Second Target (TP2): around $3,000 – $3,050 → This is my deeper support zone — the next strong demand level on the chart. --- ⚠ Invalidation / Stop-Loss If ETH closes back above $3,520 – $3,540, that would invalidate the bearish move (trendline reclaim + cloud flip). --- 🧭 Trade Summary Entry (Breakdown): Below 3,440 TP1: 3,240 TP2: 3,020 SL: 3,540trade active
Disclaimer
Any content and materials included in Finbeet's website and official communication channels are a compilation of personal opinions and analyses and are not binding. They do not constitute any recommendation for buying, selling, entering or exiting the stock market and cryptocurrency market. Also, all news and analyses included in the website and channels are merely republished information from official and unofficial domestic and foreign sources, and it is obvious that users of the said content are responsible for following up and ensuring the authenticity and accuracy of the materials. Therefore, while disclaiming responsibility, it is declared that the responsibility for any decision-making, action, and potential profit and loss in the capital market and cryptocurrency market lies with the trader.