
XMR
Monero
| Trader | Signal Type | Profit Price/Stop Loss Price | Publish Time | View Message |
|---|---|---|---|---|
 tradecityproRank: 5345 | BUY | Profit Price: Not specified Stop Loss Price: Not specified | 11/8/2025 | |
 The_Traders_HouseRank: 15622 | SELL | Profit Price: Not specified Stop Loss Price: Not specified | 11/20/2025 | |
 ColdBloodedCharterRank: 34625 | BUY | Profit Price: Not specified Stop Loss Price: Not specified | 11/15/2025 | |
 CryptoNuclearRank: 34639 | BUY | Profit Price: Not specified Stop Loss Price: Not specified | 11/15/2025 | |
 The_Alchemist_Trader_Rank: 34773 | BUY | Profit Price: Not specified Stop Loss Price: Not specified | 11/5/2025 |
Price Chart of Monero
Profit 3 Months :
Signals of Monero
Filter
Sort messages by
Message Type
Trader Type
Time Frame
Monero Wave Analysis – 20 November 2025
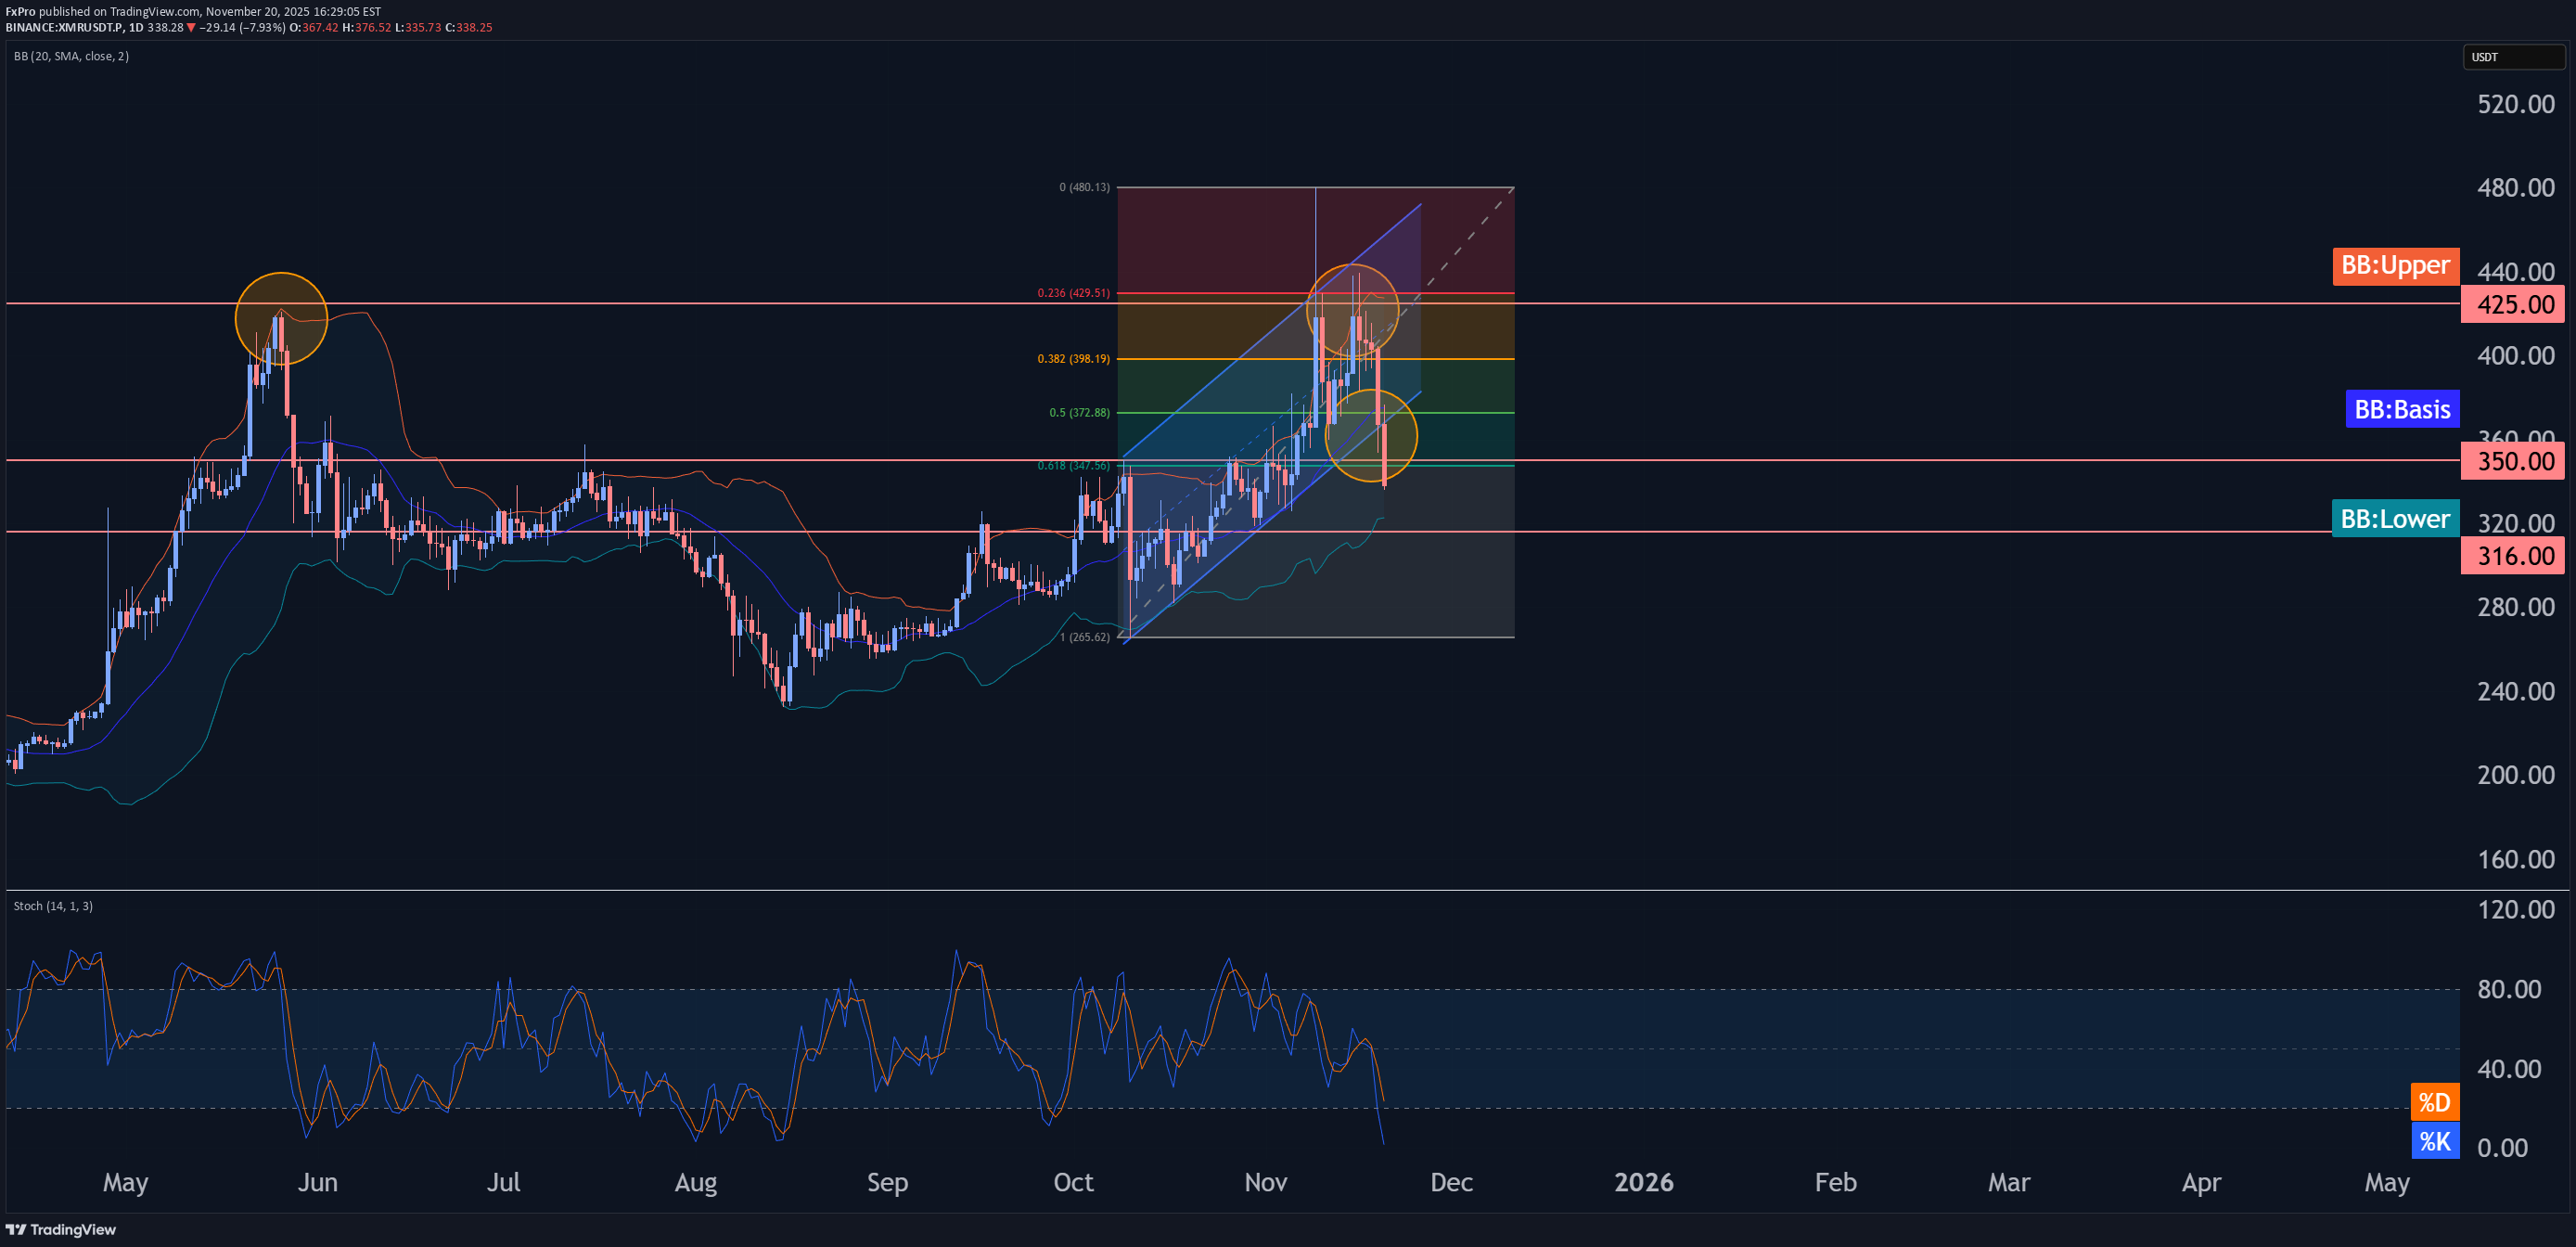
- Monero broke pivotal support level 350.00 - Likely to fall to support level 316.00 Monero cryptocurrency recently broke the pivotal support level 350.00 intersecting with the 61.8% Fibonacci correction of the upward impulse from the start of October. The breakout of the support level 350.00 accelerated the active impulse wave c – which started earlier from the powerful resistance level 425.00. Monero can be expected to fall further to the next support level 316.00, former low of wave iv from the start of November.
The_Traders_House
XMRUSDT: short setup from daily support at 353.53
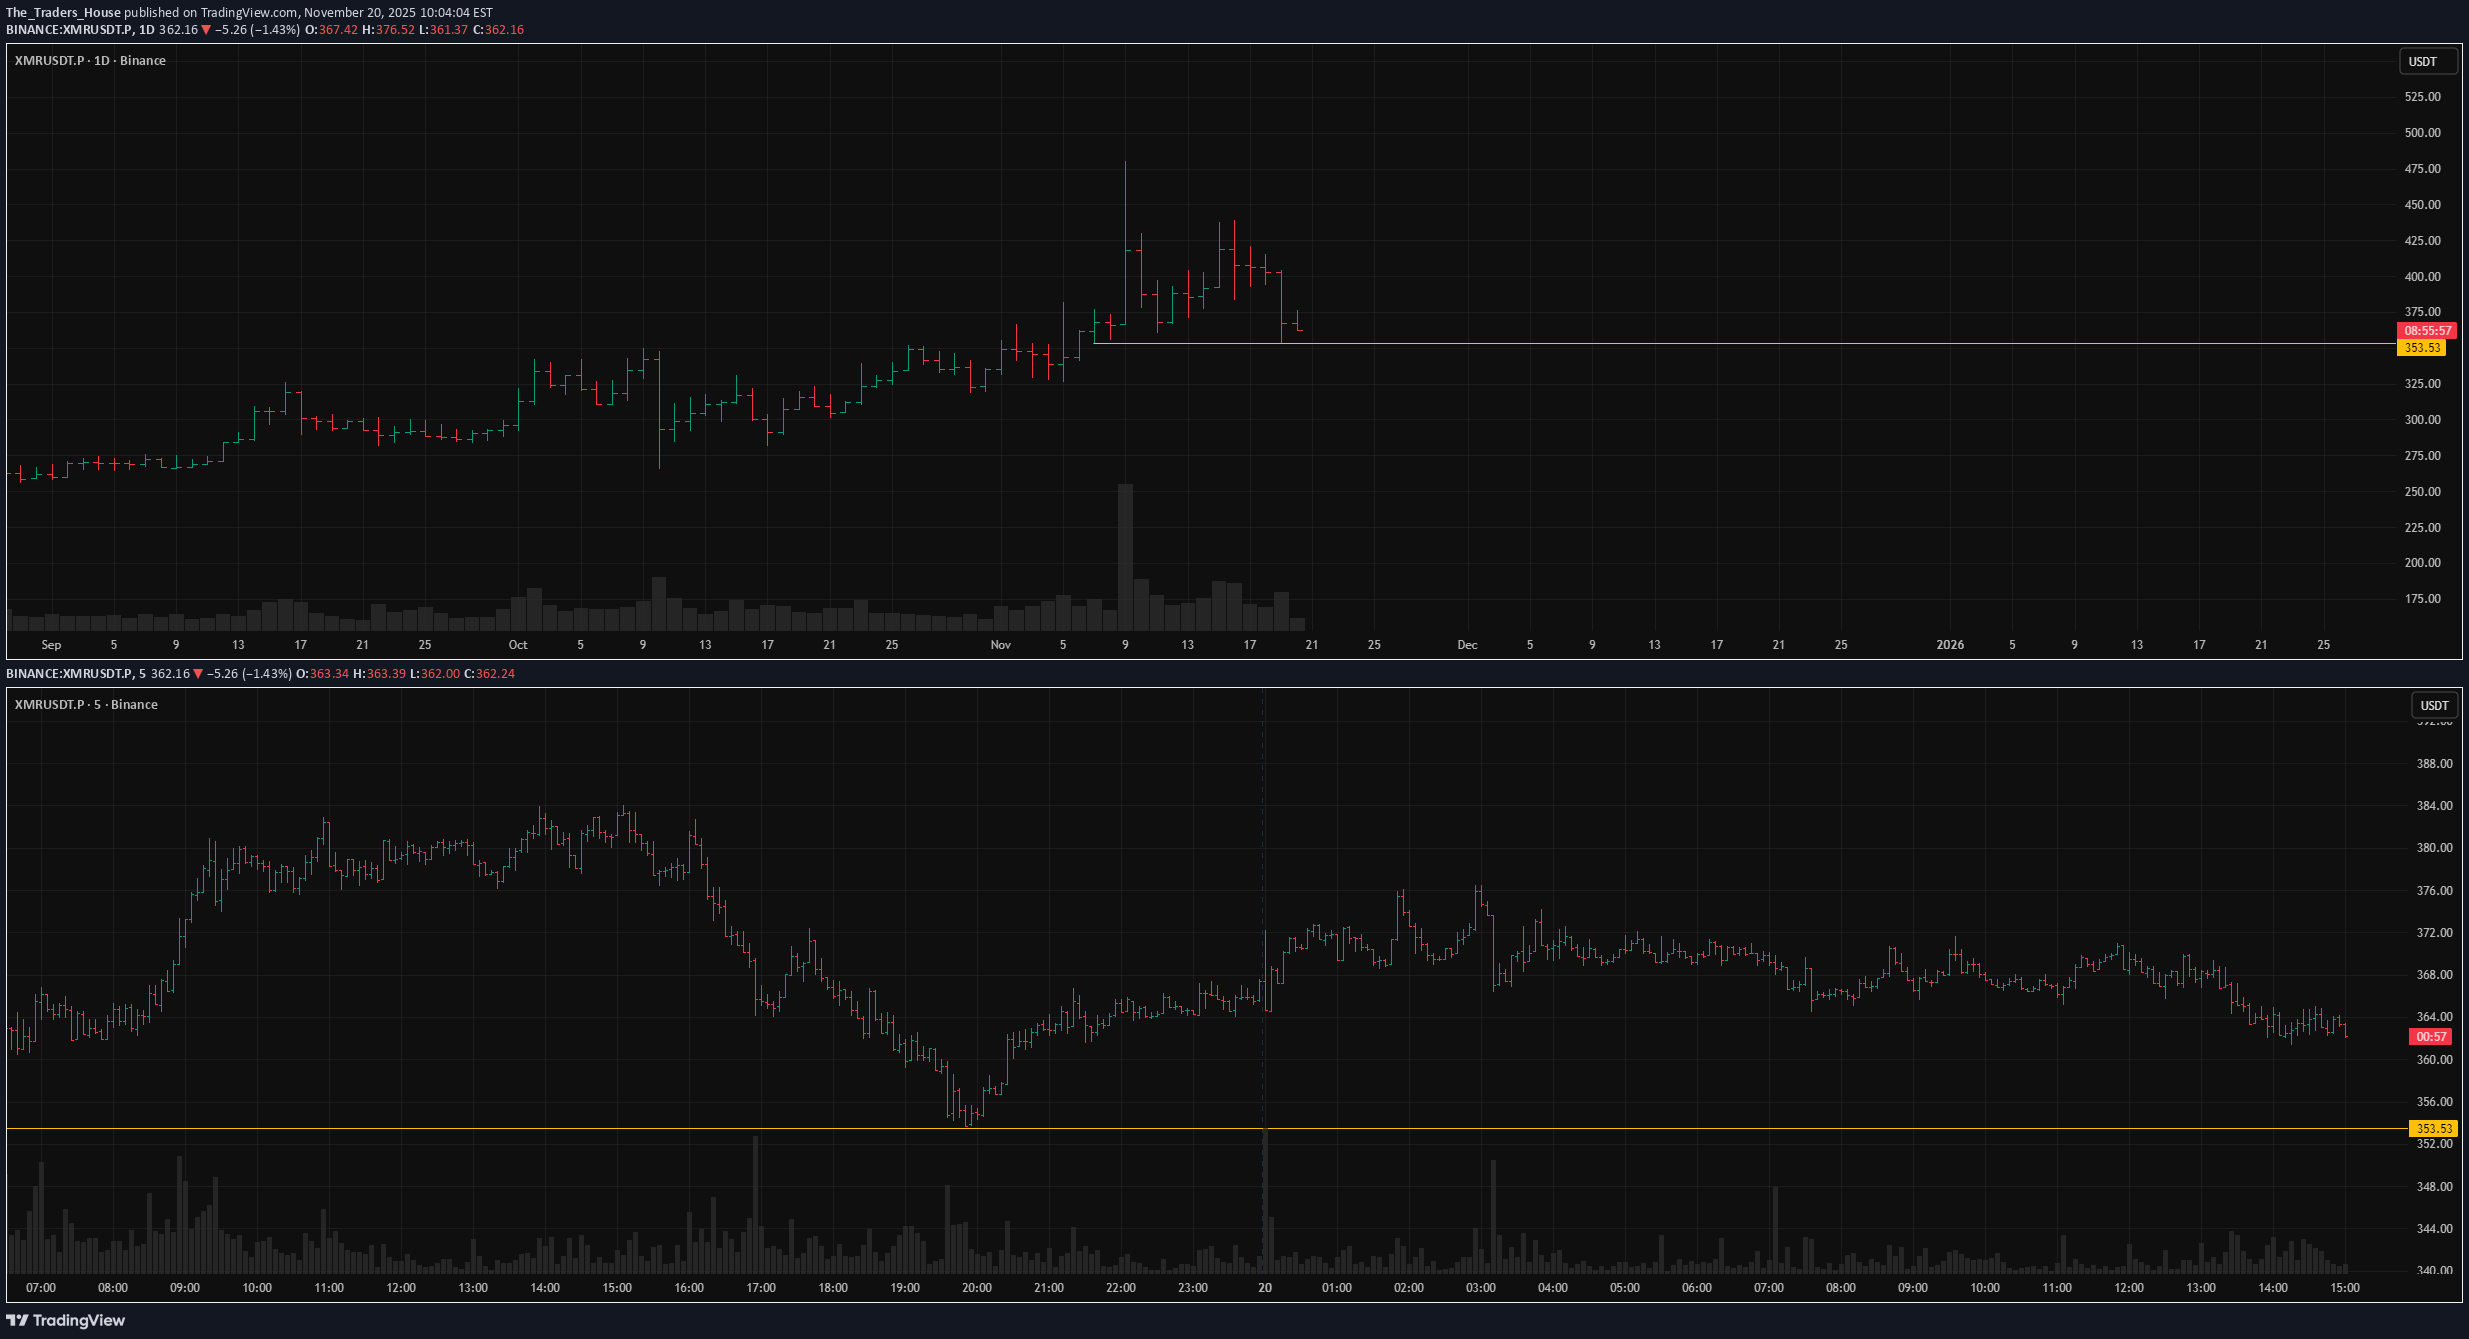
XMRUSDT.P is respecting the 353.53 level very well. Yesterday we saw two bounces, with the correction getting smaller each time. Throughout today, we've seen consolidation above the level with a gradual drift lower. This is a good signal: it suggests the seller is confidently and calmly moving the price in their direction, absorbing the buyers' limit orders along the way. If this type of price action continues right up to the level — that’s ideal. If volatility spikes, it spoils the picture a bit, and we’ll have to watch how the price behaves after the volatility settles. Key factors for this scenario: Volatility contraction on approach Momentum stall at the level Immediate retest Repeated precise tests of the level Consolidation with price compression Closing near the level Closing near the bar's extreme Factors that contradict this scenario: Heavy congestion zone ahead Was this analysis helpful? Leave your thoughts in the comments and follow to see more.

XMR USDT LONG SIGNAL
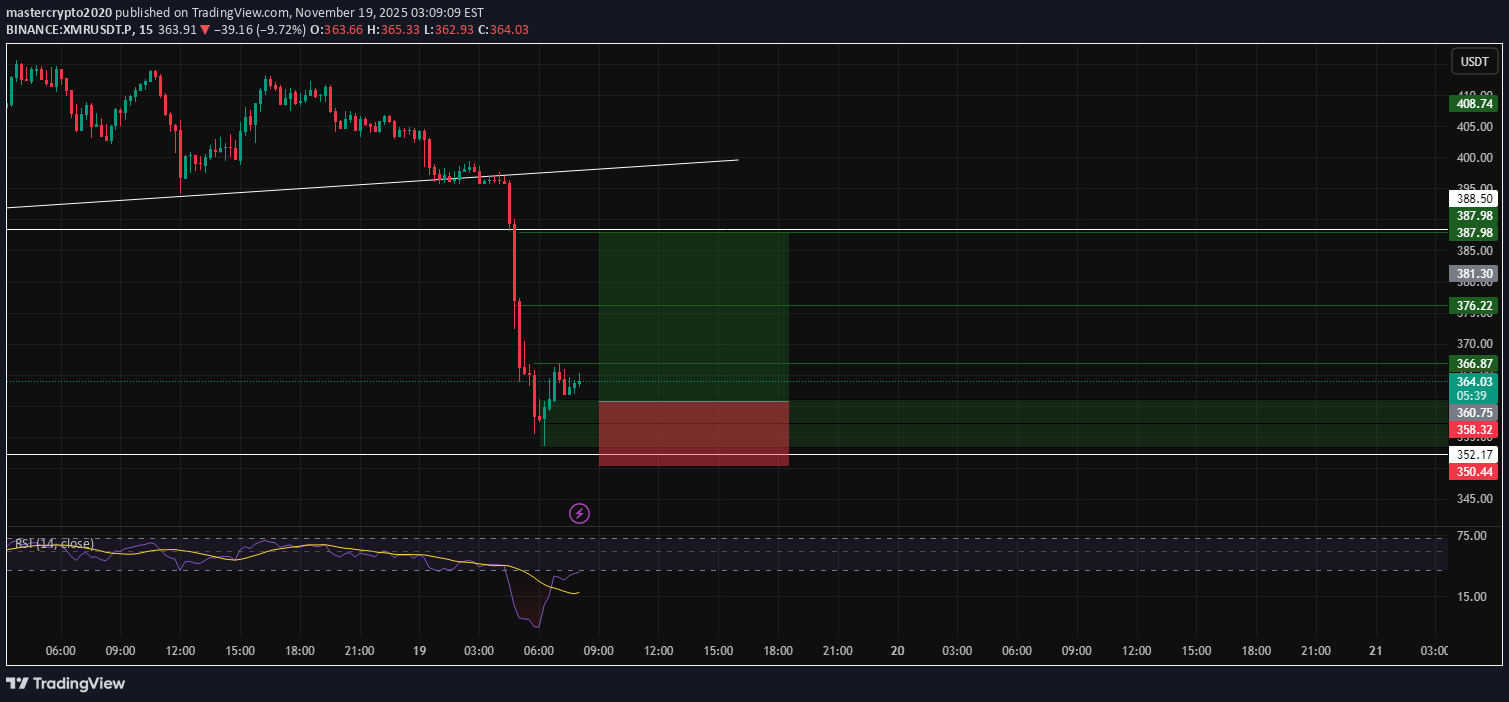
--- 📢 Trade Signal – XMR/USDT 📈 Position Type: Long 💰 Entry Price: 360.75 --- 🎯 Take-Profit Targets (Partial Exits) TP1 = 366.00 TP2 = 376.20 TP3 = 387.95 TP4 = — TP5 = — TP6 = — --- 🛑 Stop-Loss: 350.40 📊 Timeframe: — ⚖️ Risk/Reward Ratio: 2.64 💥 Suggested Leverage: 5× – 10× --- 🧠 Technical Analysis Summary XMR is bouncing strongly from the 350–355 support range, forming a clean bullish short-term structure. The 360.75 entry sits inside an optimal demand zone, with bullish momentum building on lower timeframes. A confirmed break above 366 opens the path toward 376 and 388, where liquidity clusters and major resistance levels sit. Momentum indicators show improving buyer strength. --- ⚙️ Trade Management Take partial profit at TP1 Move Stop-Loss to Break Even after TP1 hits Trail SL as price approaches TP2–TP3 Avoid re-entry if price closes below 350.40 --- ⚠️ Disclaimer This signal is for educational purposes only. Always apply proper risk management. --- 📌 Hashtags for TradingView #XMR #XMRUSDT #CryptoSignal #TradingView #LongSetup #Altcoins #TechnicalAnalysis #FuturesTrading ---

TheCryptoGoon
XMR MONERO Bullish Move Up
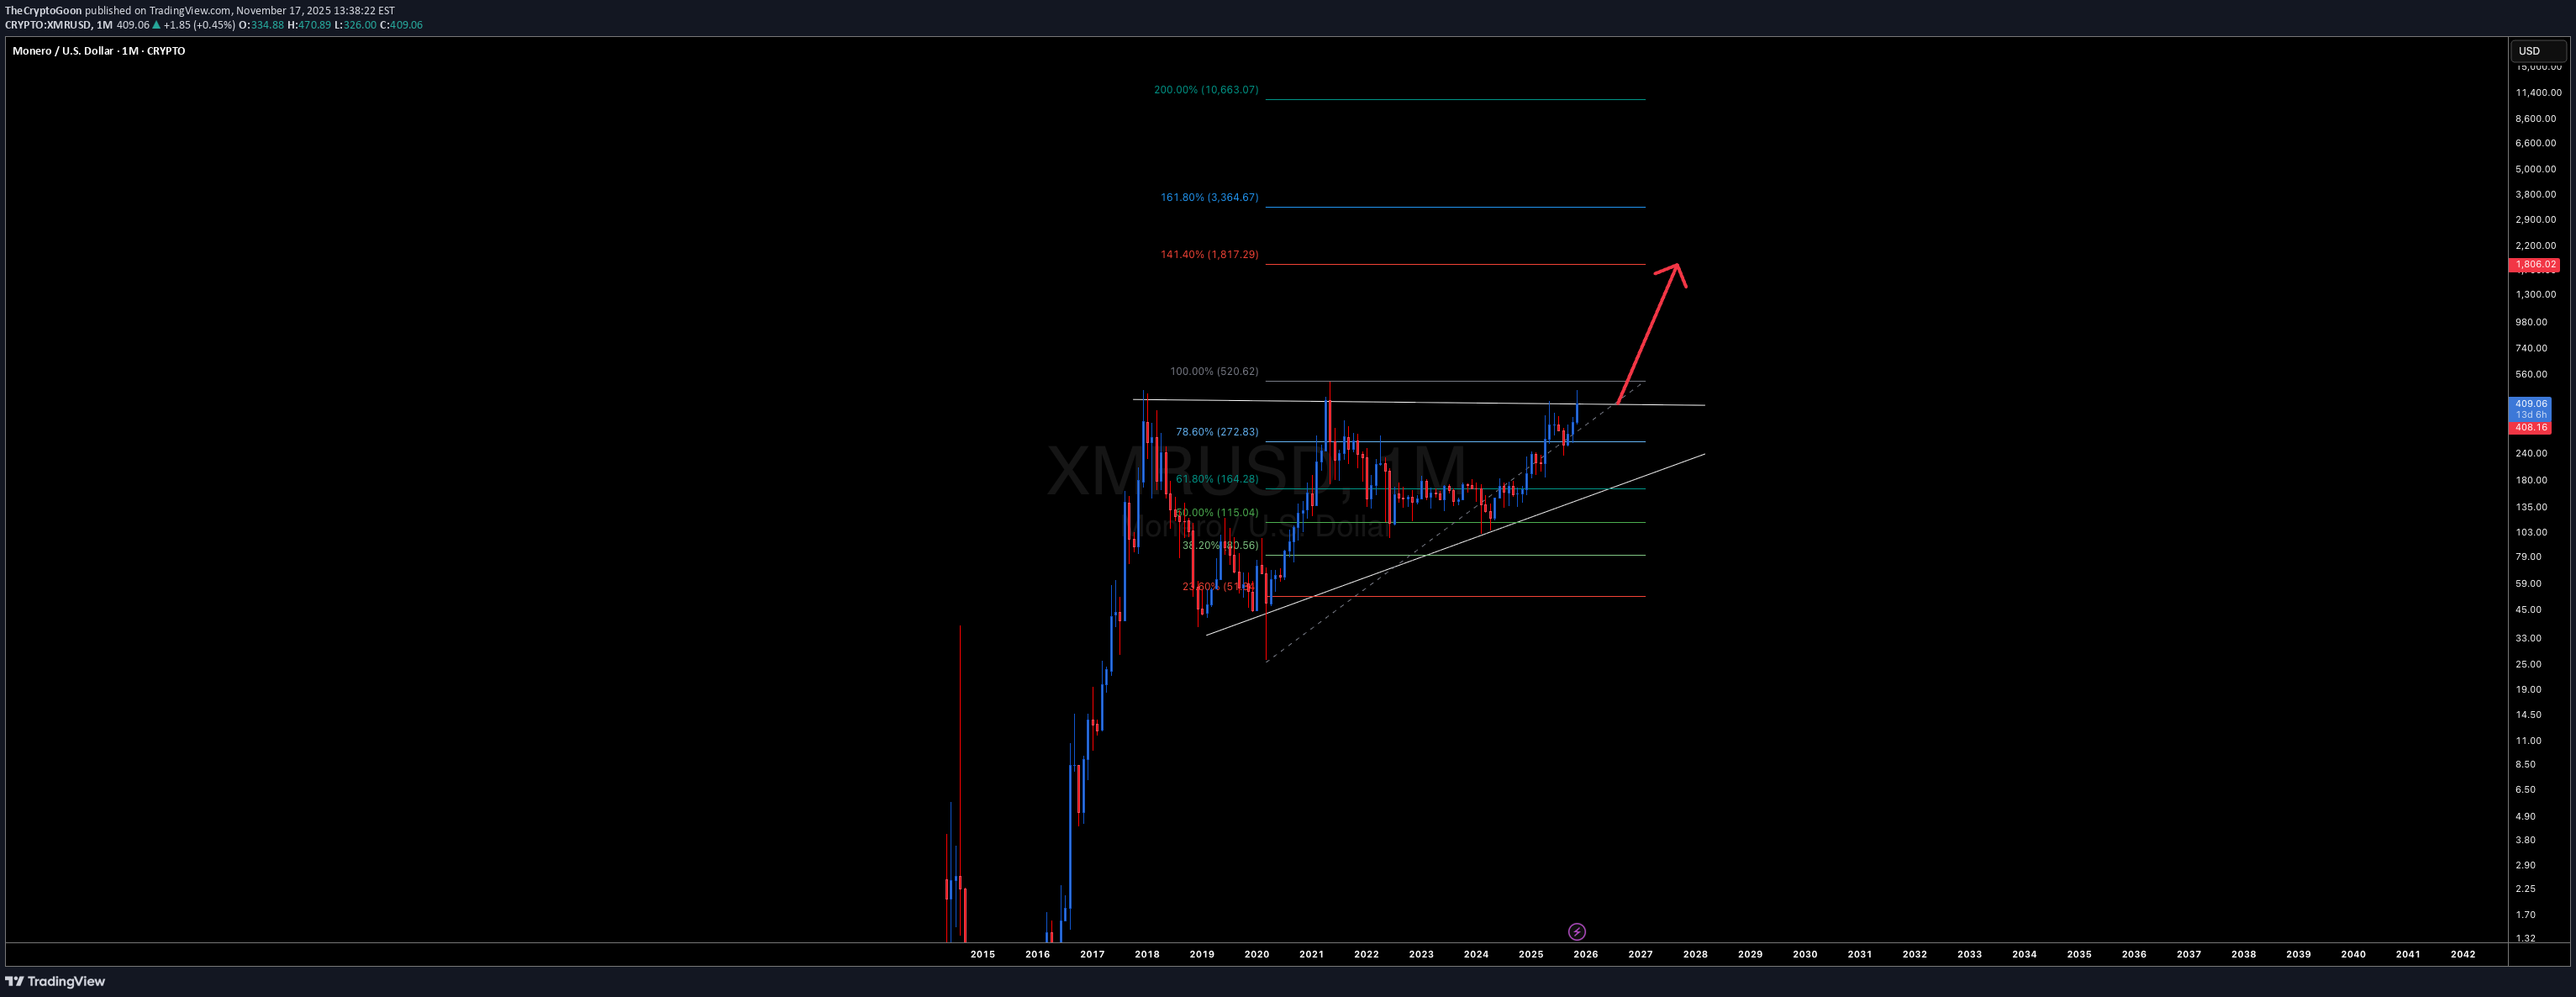
XMR Monero is currently in bullish triangle pattern. If It breaks above current resistance I am looking for it to go to the 141.00% Fib level as the first price target.
XMR USDT LONG SIGNAL
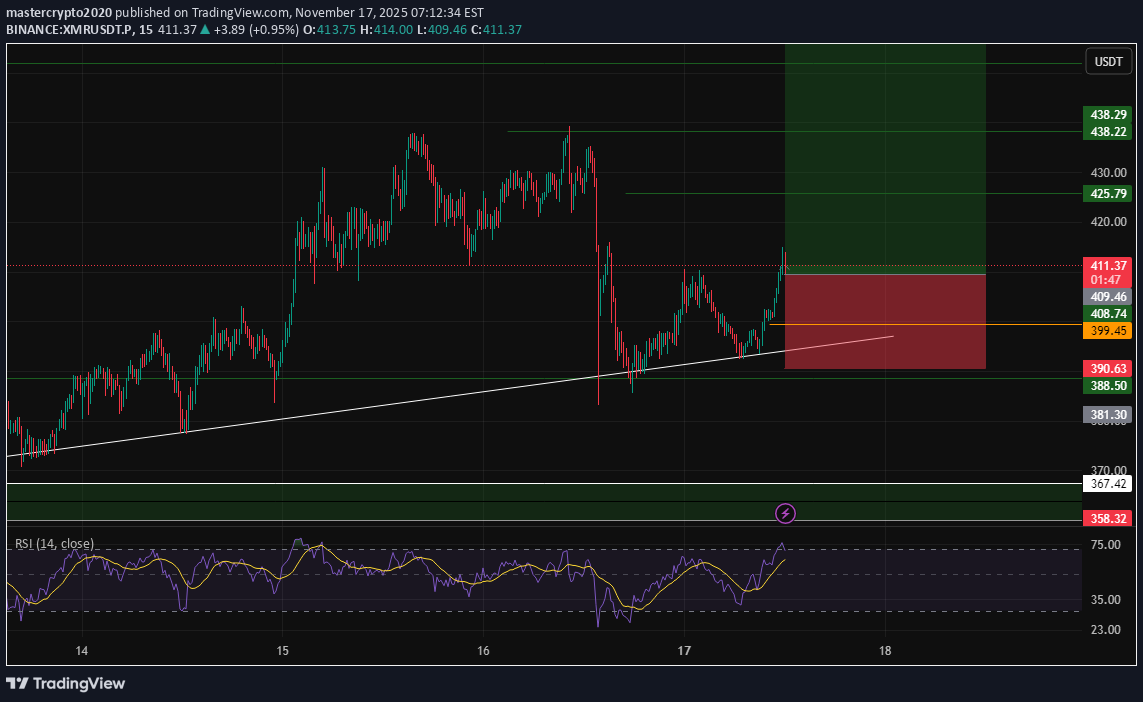
--- 📢 Trade Idea: XMR/USDT Type: Long Entry Zone: 399.84 – 409.38 --- 🎯 Take-Profit Targets (Partial Exits): • TP1 = 425.79 • TP2 = 438.22 • TP3 = 452.33 • TP4 = 467.97 • TP5 = 487.50 • TP6 = — --- 🛑 Stop-Loss: 389.85 ⏱ Timeframe: 15m ⚖️ R/R Ratio: 4.12 💥 Suggested Leverage: 5×–10× --- 🧠 Technical Analysis Summary: XMR is holding strong support inside the 399–409 demand zone, showing bullish reaction and accumulation. Break above 425.7 may trigger momentum toward 438 → 452 → 468, with extended targets near 487. RSI is rising from oversold conditions and the price is reclaiming EMA20/EMA50 — confirming a potential bullish continuation wave. --- ⚙️ Trade Management Tips: • Take partial profit at TP1 and move SL to entry. • From TP2–TP5, use a trailing stop for safety. • Avoid entry if price closes below 389.8. --- ⚠️ Disclaimer: For educational purposes only — manage your capital responsibly. --- 📌 Hashtags for TradingView: #XMRUSDT #Monero #CryptoSignal #TechnicalAnalysis #TradingView #FuturesTrading #Altcoins #CryptoSetup ---
ColdBloodedCharter
$XMR (DAILY): HIDDEN BULL RSI divergence, PRICE DISCOVERY
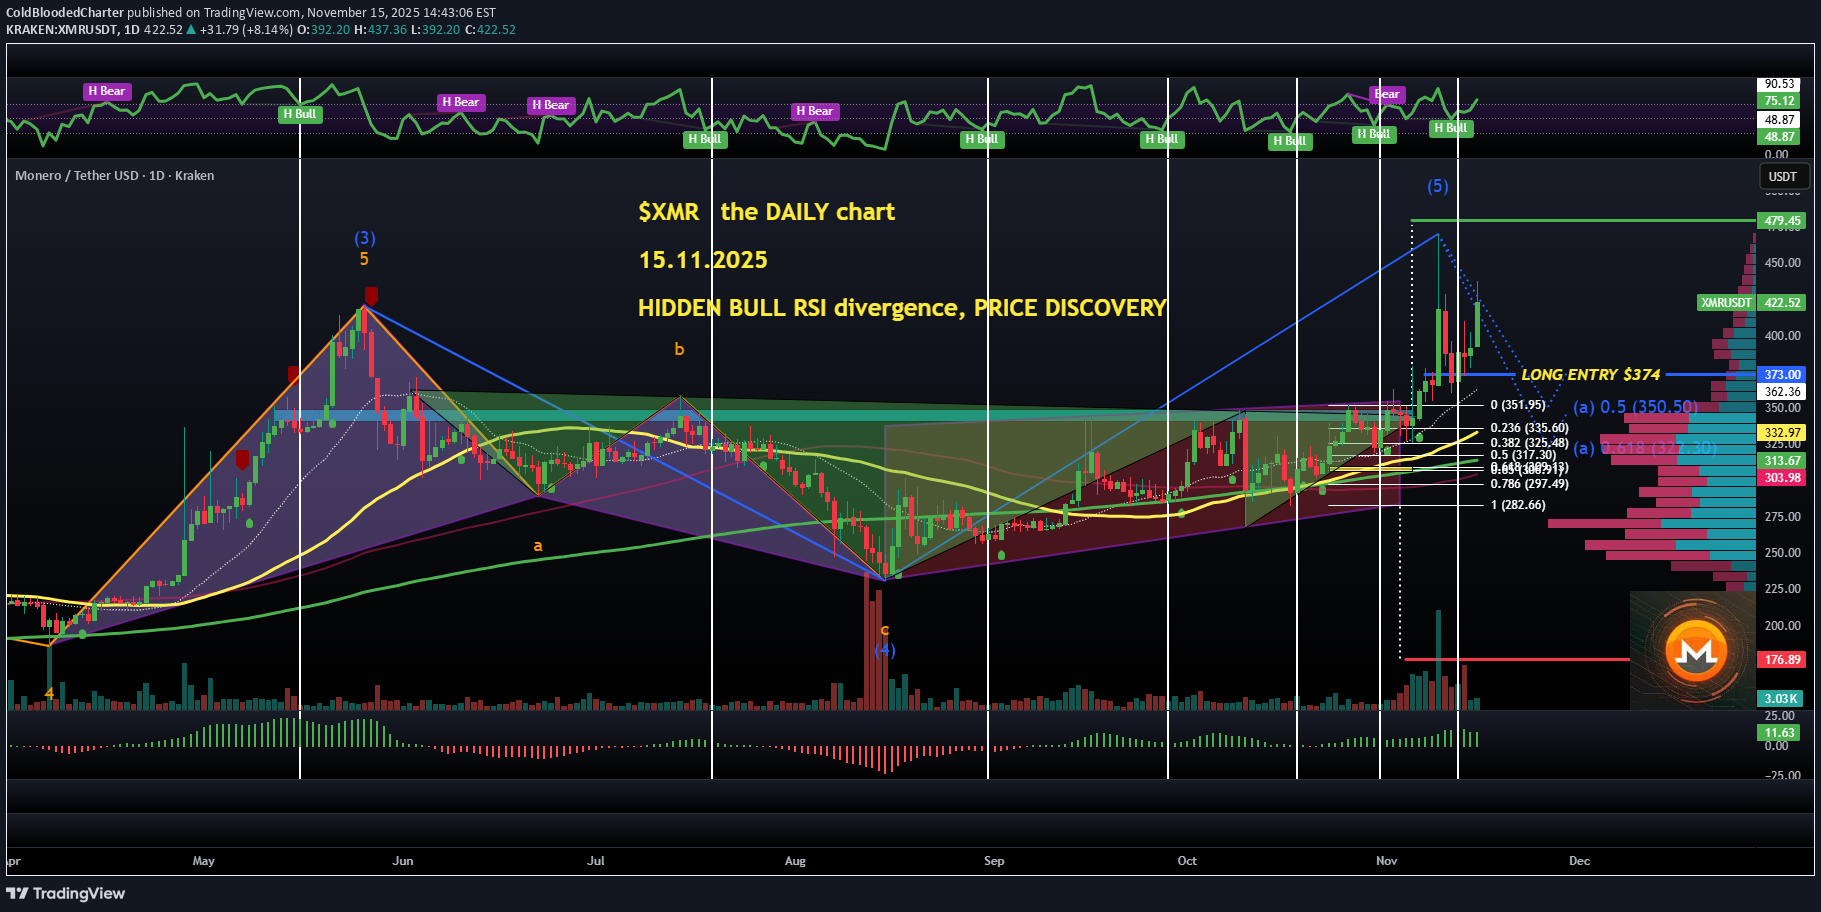
Day 8 in this XMR long position ($374) and obviously this is my only leveraged LONG. My first TP was placed 1% below the INVERTED HEAD&SHOULDERS target ($475) and missed by $5, literally - so unlucky, as the new ATH was established at $470. The DAILY chart is still in WAVE 5 and we've seen yet another HIDDEN BULL RSI divergence (horizontal lines; 5 out of the previous 6 of these divergences led to rallies and RSI crossing above 90). Currently RSI = 75, a bit overbought but with enough room for a solid rally. The 4-HOUR and 8-HOUR charts also show the active WAVE 5 with two most probable targets: $477 and $549. So, my 3 partial TAKE PROFIT levels remain: $475, $544, and a moonbag. STOP LOSS strategy has been adjusted a bit: I'm going to manually close in 3 parts below the 50 MA ($333 atm and rising = a superb dynamic SUPPORT). #Monero is an asset I'm currently the most bullish on - and have been for weeks, as you know. Nothing has changed. 👽💙

pullbacksignal
Monero : Continuing the upward trend

Trading Setup: A Trading Signal is seen in the XMRUSDT Monero (4h) Traders can open their Buy Trades NOW ⬆️Buy now or Buy on 404.0 ⭕️SL @ 375.0 🔵TP1 @ 464.0 🔵TP2 @ 489.9 🔵TP3 @ 537.9 What are these signals based on? Classical Technical Analysis Price Action Candlesticks Fibonacci RSI, Moving Average , Ichimoku , Bollinger Bands Risk Warning Trading Forex, CFDs, Crypto, Futures, and Stocks involve a risk of loss. Please consider carefully if such trading is appropriate for you. Past performance is not indicative of future results. If you liked our ideas, please support us with your likes 👍 and comments .

PraveenTrader1
XMRUSDT – Clean SMC + Price Action Analysis
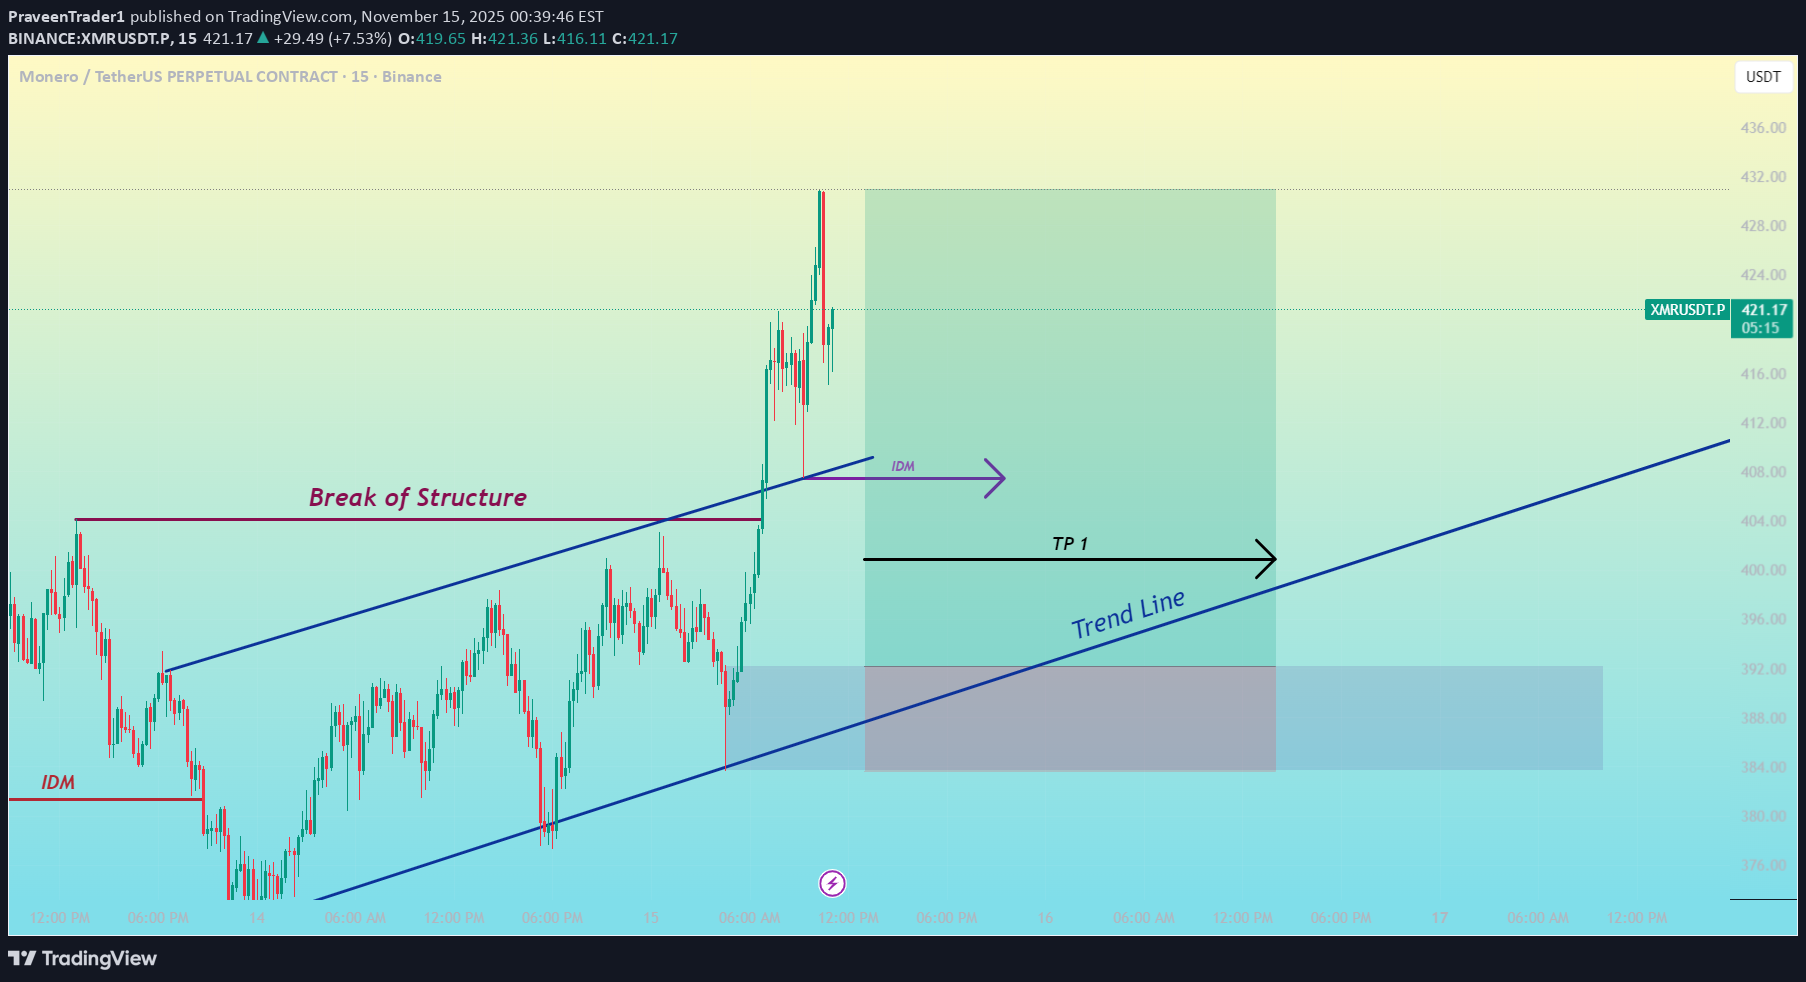
XMRUSDT is clearly in an uptrend, and we already witnessed a strong Break of Structure (BOS). After the BOS, price pulled back into the imbalance (IDM) region, which gives us a high-probability setup in the direction of the trend. The trendline support is holding well, and the market continues to respect higher highs and higher lows. As long as the IDM zone is protected, buyers remain in control. Trade Setup Entry: 391.17 Stop Loss: 483.60 Take Profit 1: 400.87 (1:1 RR) Take Profit 2: 430.99 (4.5 RR) I used Smart Money Concepts (SMC) combined with pure price action, and this setup has a higher probability of playing out in our direction if the entry gets triggered. The overall structure, trendline support, and IDM sweep all align perfectly for a continuation move.
CryptoNuclear
XMR/USDT - Rounded Bottom Signals: Breakout New Bullish Cycle?
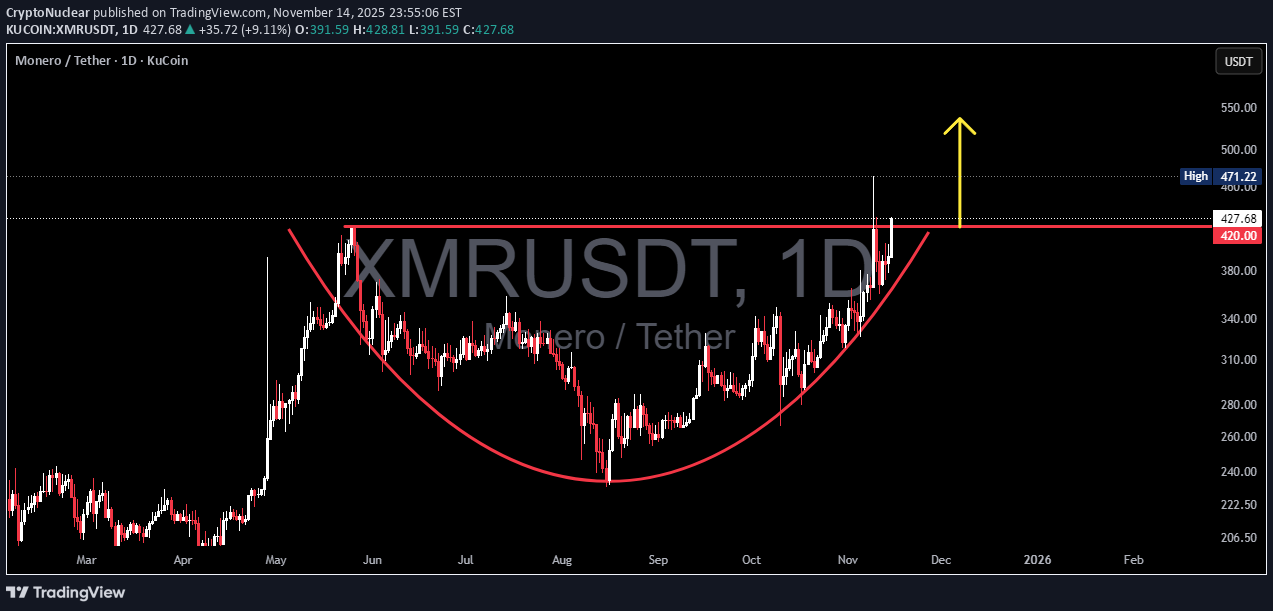
XMR has finally broken out of one of the strongest technical structures on the daily timeframe: a multi-month rounded bottom, a pattern that typically marks the transition from long distribution phases into new bullish cycles. After establishing a stable base near $235, price has been rising gradually, forming a clean upward curvature that reflects a steady shift from selling pressure toward sustained accumulation. A rounded structure this smooth rarely appears unless buyers have been consistently absorbing supply for a long period. Now, the market has touched and pierced the major historical resistance at $426, a level that has capped price for months. This breakout validates the pattern and suggests the market is shifting from consolidation into expansion. The quick spike toward $471 shows aggressive buying interest but also marks this region as a liquidity cluster that will play a crucial role in determining continuation. As long as price holds above the $420–426 rim, buyers maintain full control and the bullish probability remains dominant. Given the depth of the pattern at roughly $191, the measured breakout target sits around $615–$620, which is structurally reasonable if the breakout is confirmed and $426 flips into reliable support. --- Pattern Explanation (Clear and In-Depth) Pattern name: Rounded Bottom / Cup (pure cup, no handle formation). Formation duration: Multi-month, which increases reliability. Characteristics: stable bottom, consistent upward curvature, repeated rejections at the same horizontal level → market completing a major accumulation phase. Breakout confirmation: daily candle closing above the rim → shift in medium-term market structure. Large rounded bottoms like this are often precursors to trend reversals and are known for initiating strong directional moves. --- Bullish Scenario (Primary Outlook) 1. Price forms a clean daily close above $426. 2. Ideal retest occurs at $420–430 with lower-wick support and rising volume. 3. If confirmed, continuation targets become: $471 (local liquidity zone) $520 (psychological resistance) $618 (measured move) as the main structural target 4. As long as price holds above the ascending support and does not close below $420, the bullish structure remains intact. Market narrative: buyers are controlling the tempo, and momentum is transitioning decisively upward. --- Bearish Scenario (If Breakout Fails) 1. Breakout becomes a false breakout if price closes back below $420. 2. This would expose deeper corrective zones: $380–400 (ascending support) $340 $300 Even a return to the base of the pattern in a worst-case scenario 3. Bearish confirmation signals include: low breakout volume, repeated upper-wick rejections, and daily closes below the rim. Market narrative: buyers lose control, and the asset slips back into prolonged accumulation. --- Additional Insight A rounded bottom of this scale is more than a pattern; it often reflects a major shift in market psychology. It typically marks the transition from weak, low-interest conditions to renewed investor engagement. When paired with a breakout at a long-standing resistance, this formation is one of the strongest signals for potential medium-to-long-term trend continuation. For XMR, the structure shows that selling pressure that dominated earlier in the year has faded, and buyers are beginning to establish a clear advantage. --- #XMRUSDT #Monero #CryptoAnalysis #RoundedBottom #Breakout #TechnicalAnalysis #PriceAction #MarketStructure #CryptoTrading
XMR USDT LONG SIGNAL
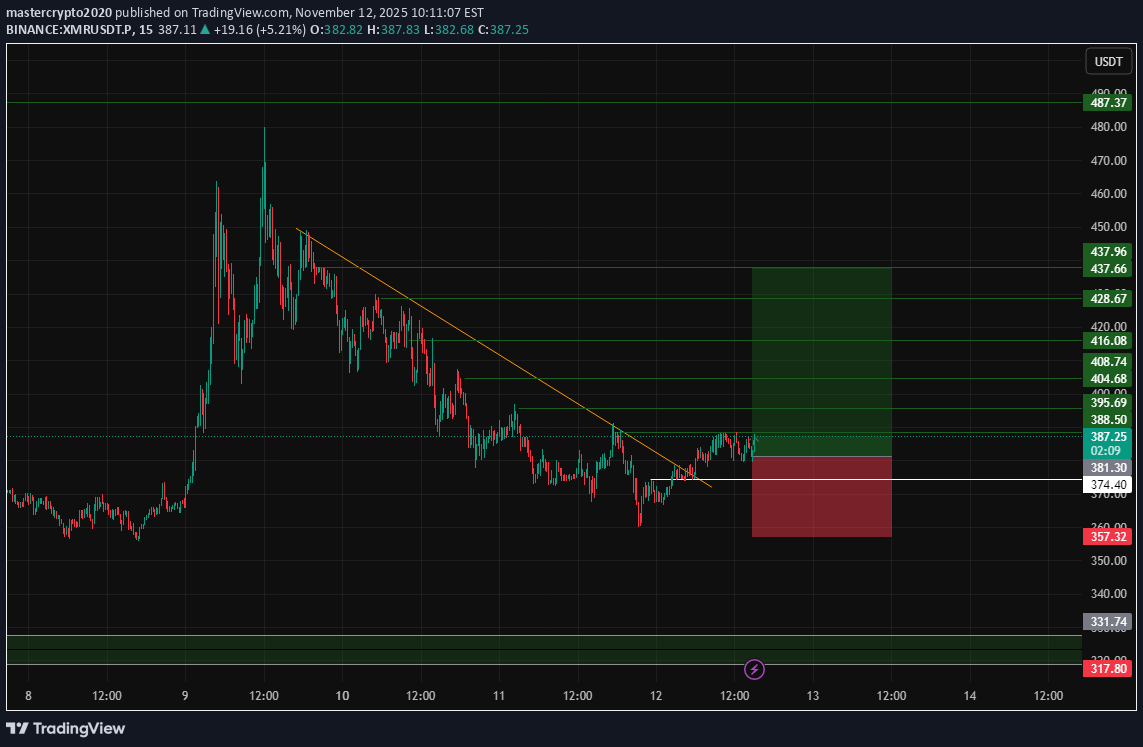
--- 📢 : XMR/USDT Type: Long Entry Zone: 374.10 – 381.30 🎯 Targets: • TP1 = 388.50 • TP2 = 395.69 • TP3 = 404.68 • TP4 = 416.00 • TP5 = 428.67 • TP6 = 437.66 🛑 Stop-Loss: 357.00 ⏱ Timeframe: 1H ⚖️ Risk/Reward Ratio: 2.35 💥 Suggested Leverage (if used): 3x–5x --- Analysis: Monero (XMR) is showing a strong bullish recovery from the key support area near 357–374. Price has reclaimed the short-term moving averages and is forming higher lows, suggesting accumulation by smart money. A clean breakout above 381 could confirm continuation toward 404–416 in the next impulse. RSI is turning up from mid-range (45–50), and MACD shows a bullish crossover, supporting the long bias. --- Trade Management: • Move stop-loss to entry once TP1 is reached. • Consider taking partial profits at each target level. • Use a trailing stop from TP3 onward to secure profits. --- ⚠️ Disclaimer: This analysis is for educational purposes only and not financial advice. Always perform your own due diligence and manage your risk responsibly.
Disclaimer
Any content and materials included in Finbeet's website and official communication channels are a compilation of personal opinions and analyses and are not binding. They do not constitute any recommendation for buying, selling, entering or exiting the stock market and cryptocurrency market. Also, all news and analyses included in the website and channels are merely republished information from official and unofficial domestic and foreign sources, and it is obvious that users of the said content are responsible for following up and ensuring the authenticity and accuracy of the materials. Therefore, while disclaiming responsibility, it is declared that the responsibility for any decision-making, action, and potential profit and loss in the capital market and cryptocurrency market lies with the trader.